
The corrugated boxes market is set to observe steady growth during the forecast period of 2017-2022. Logistic applications are expected to boost the growth rate of the corrugated boxes market. This is because of the growing demand for essential products including food, pharmaceuticals, tissue and hygiene products, and other consumer products due to the COVID-19 pandemic.
The global market for corrugated boxes is observing a tremendous growth in line with the development trends of the packaging and converting industries. Several factors, such as the rising demand for corrugated boxes from logistic applications and the fresh food and beverages, electronic goods, and the home and personal care goods industries, the increasing preference for sustainable packaging among consumers, and the remarkable progress of the e-commerce industry, are boosting this market substantially across the world.
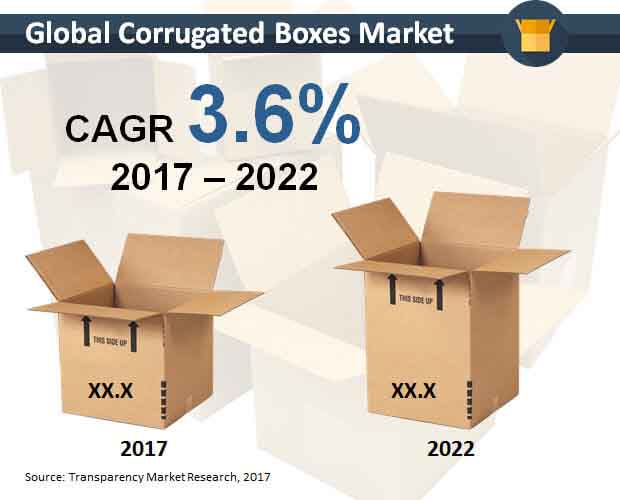
By 2017 end, the opportunity in this market is expected to reach a whopping sum of US$96.60 bn. Rising at a CAGR of 3.60% between 2017 and 2022, the market is projected to increase further to US$115.15 bn by the end of 2022. The increasing industrialization and the subsequent rise in the trade activities in emerging economies, such as India and China, is likely to propel this market over the next few years.
Broadly, the global market for corrugated boxes is assessed on four fronts: The source of the material, end user, packaging form, and the type of the board. Based on the source of the material, the market has been classified into virgin fiber and recycled fiber. Among the two, recycled fiber is more in demand and the trend is anticipated to remain so over the next few years.
By the end user, the market has been categorized into the food, beverages, tobacco, healthcare, personal care and cosmetics, homecare and toiletries, electronic and consumer durables, E-commerce, and the chemical and fertilizer industries. Corrugated boxes are mainly utilized to pack food and beverage products. The demand for these boxes has also increased in the personal care and cosmetics industry. However, it’s the E-commerce sector, which is providing the most promising opportunities for the growth of this market.
On the basis of the packaging form, the market has been divided into primary packaging and secondary packaging. Single wall, double wall, and triple wall are considered as the main types of the board available in this market.
The worldwide market for corrugated boxes is also analyzed on the basis of its geographical spread. Latin America, Asia Pacific excluding Japan (APEJ), Japan, North America, Europe, and the Middle East and Africa (MEA) are considered as the key geographical segments of this market. Asia Pacific excluding Japan has been dominating the global market and is expected to remain doing so in the near future, thanks to the increasing business and trade activities in this region. The APEJ market for corrugated boxes is projected to expand at a CAGR of 4.10% during the period from 2017 to 2022.
Among other regional markets, North America and Europe are expected to report a noticeable rise in the demand for corrugated boxes over the next few years, thanks to significant increase in E-commerce sector and the subsequent preference for online shopping among consumers. The presence of leading vendors in is also anticipated to benefits these regional markets in the near future.
The global market for corrugated boxes is highly competitive, thanks to the presence of a large pool of players. Stora Enso Oyj., International Paper Co., Smurfit Kappa Group Plc., Pratt Industries Inc., Sonoco Products Co., Huhtamaki Oyj, WestRock Co., KapStone Paper and Packaging Corp., DS Smith Plc., and Georgia Pacific LLC are some of the key vendors of corrugated boxes in the global market.
Rise in demand for corrugated boxes from emerging economies and growing popularity of growing demand from e-commerce, food & beverage and electronic sectors are hot bets for the market.
On the basis of type, the market is segmented into slotted boxes, telescope boxes, rigid boxes, and folder boxes. Slotted boxes are generally made from one piece of corrugated board which is usually stitched, taped, or glued. The blank, or tray, is scored and fitted to allow folding after which the boxes are dispatched flat to the user. To make a box, the user needs to square it up, place the product in the box, and shut the flaps. The flute is placed parallel to the depth to provide enough load
The key players are focusing on producing corrugated boxes targeted towards specific end uses. Increasing popularity of recycled packaging solutions is another key trend positively influencing the target market.
Increasing demand for corrugated boxes from food industry will drive the market. Moreover, growing popularity of corrugated boxes among manufacturers of cosmetic and personal care industry is another factor driving the demand for corrugated boxes.
Stora Enso Oyj., International Paper Co., Smurfit Kappa Group Plc., Pratt Industries Inc., Sonoco Products Co., Huhtamaki Oyj, WestRock Co., KapStone Paper and Packaging Corp., DS Smith Plc., and Georgia Pacific LLC are some of the key vendors of corrugated boxes in the global market.
1. Global Corrugated Boxes Market - Executive Summary
2. Global Corrugated Boxes Market Overview
2.1. Introduction
2.1.1. Global Corrugated Boxes Market Taxonomy
2.1.2. Global Corrugated Boxes Market Definition
2.2. Global Corrugated Boxes Market Size (US$ Mn) and Forecast, 2012-2022
2.2.1. Global Corrugated Boxes Market Y-o-Y Growth
2.3. Global Corrugated Boxes Market Dynamics
2.4. Supply Chain
2.5. Cost Structure
2.6. Pricing Analysis
2.7. Raw Material Sourcing Strategy and Analysis
2.8. List of Distributors
2.9. Key Participants Market Presence (Intensity Map) By Region
3. Global Corrugated Boxes Market Analysis and Forecast By Material Source
3.1. Global Corrugated Boxes Market Size and Forecast By Material Source, 2012-2022
3.1.1. Virgin Fiber Market Size and Forecast, 2012-2022
3.1.1.1. Revenue (US$ Mn) Comparison, By Region
3.1.1.2. Market Share Comparison, By Region
3.1.1.3. Y-o-Y growth Comparison, By Region
3.1.2. Recycled Fiber Market Size and Forecast, 2012-2022
3.1.2.1. Revenue (US$ Mn) Comparison, By Region
3.1.2.2. Market Share Comparison, By Region
3.1.2.3. Y-o-Y growth Comparison, By Region
4. Global Corrugated Boxes Market Analysis and Forecast By End User Industry
4.1. Global Corrugated Boxes Market Size and Forecast By End User Industry, 2012-2022
4.1.1. Food Market Size and Forecast, 2012-2022
4.1.1.1. Revenue (US$ Mn) Comparison, By Region
4.1.1.2. Market Share Comparison, By Region
4.1.1.3. Y-o-Y growth Comparison, By Region
4.1.2. Beverages Market Size and Forecast, 2012-2022
4.1.2.1. Revenue (US$ Mn) Comparison, By Region
4.1.2.2. Market Share Comparison, By Region
4.1.2.3. Y-o-Y growth Comparison, By Region
4.1.3. Tobacco Market Size and Forecast, 2012-2022
4.1.3.1. Revenue (US$ Mn) Comparison, By Region
4.1.3.2. Market Share Comparison, By Region
4.1.3.3. Y-o-Y growth Comparison, By Region
4.1.4. Healthcare Market Size and Forecast, 2012-2022
4.1.4.1. Revenue (US$ Mn) Comparison, By Region
4.1.4.2. Market Share Comparison, By Region
4.1.4.3. Y-o-Y growth Comparison, By Region
4.1.5. Personal Care & Cosmetics Market Size and Forecast, 2012-2022
4.1.5.1. Revenue (US$ Mn) Comparison, By Region
4.1.5.2. Market Share Comparison, By Region
4.1.5.3. Y-o-Y growth Comparison, By Region
4.1.6. Homecare & Toiletries Market Size and Forecast, 2012-2022
4.1.6.1. Revenue (US$ Mn) Comparison, By Region
4.1.6.2. Market Share Comparison, By Region
4.1.6.3. Y-o-Y growth Comparison, By Region
4.1.7. Electronic & Consumer Durables Market Size and Forecast, 2012-2022
4.1.7.1. Revenue (US$ Mn) Comparison, By Region
4.1.7.2. Market Share Comparison, By Region
4.1.7.3. Y-o-Y growth Comparison, By Region
4.1.8. E-Commerce Market Size and Forecast, 2012-2022
4.1.8.1. Revenue (US$ Mn) Comparison, By Region
4.1.8.2. Market Share Comparison, By Region
4.1.8.3. Y-o-Y growth Comparison, By Region
4.1.9. Chemical & Fertilizers Market Size and Forecast, 2012-2022
4.1.9.1. Revenue (US$ Mn) Comparison, By Region
4.1.9.2. Market Share Comparison, By Region
4.1.9.3. Y-o-Y growth Comparison, By Region
4.1.10. Others (Automotive Parts, Machinery components etc) Market Size and Forecast, 2012-2022
4.1.10.1.Revenue (US$ Mn) Comparison, By Region
4.1.10.2.Market Share Comparison, By Region
4.1.10.3.Y-o-Y growth Comparison, By Region
5. Global Corrugated Boxes Market Analysis and Forecast By Packaging Form
5.1. Global Corrugated Boxes Market Size and Forecast By Packaging Form, 2012-2022
5.1.1. Primary Packaging Market Size and Forecast, 2012-2022
5.1.1.1. Revenue (US$ Mn) Comparison, By Region
5.1.1.2. Market Share Comparison, By Region
5.1.1.3. Y-o-Y growth Comparison, By Region
5.1.2. Secondary Packaging Market Size and Forecast, 2012-2022
5.1.2.1. Revenue (US$ Mn) Comparison, By Region
5.1.2.2. Market Share Comparison, By Region
5.1.2.3. Y-o-Y growth Comparison, By Region
6. Global Corrugated Boxes Market Analysis and Forecast By Board Type
6.1. Global Corrugated Boxes Market Size and Forecast By Board Type, 2012-2022
6.1.1. Single Wall Market Size and Forecast, 2012-2022
6.1.1.1. Revenue (US$ Mn) Comparison, By Region
6.1.1.2. Market Share Comparison, By Region
6.1.1.3. Y-o-Y growth Comparison, By Region
6.1.2. Double Wall Market Size and Forecast, 2012-2022
6.1.2.1. Revenue (US$ Mn) Comparison, By Region
6.1.2.2. Market Share Comparison, By Region
6.1.2.3. Y-o-Y growth Comparison, By Region
6.1.3. Triple Wall Market Size and Forecast, 2012-2022
6.1.3.1. Revenue (US$ Mn) Comparison, By Region
6.1.3.2. Market Share Comparison, By Region
6.1.3.3. Y-o-Y growth Comparison, By Region
7. Global Corrugated Boxes Market Analysis and Forecast By Region
7.1. Global Corrugated Boxes Market Size and Forecast, 2012-2022
7.1.1. North America Corrugated Boxes Market Size and Forecast, 2012-2022
7.1.1.1. Revenue (US$ Mn) Comparison, By Material Source
7.1.1.2. Revenue (US$ Mn) Comparison, By End User Industry
7.1.1.3. Revenue (US$ Mn) Comparison, By Packaging Form
7.1.1.4. Revenue (US$ Mn) Comparison, By Board Type
7.1.2. Latin America Corrugated Boxes Market Size and Forecast, 2012-2022
7.1.2.1. Revenue (US$ Mn) Comparison, By Material Source
7.1.2.2. Revenue (US$ Mn) Comparison, By End User Industry
7.1.2.3. Revenue (US$ Mn) Comparison, By Packaging Form
7.1.2.4. Revenue (US$ Mn) Comparison, By Board Type
7.1.3. Europe Corrugated Boxes Market Size and Forecast, 2012-2022
7.1.3.1. Revenue (US$ Mn) Comparison, By Material Source
7.1.3.2. Revenue (US$ Mn) Comparison, By End User Industry
7.1.3.3. Revenue (US$ Mn) Comparison, By Packaging Form
7.1.3.4. Revenue (US$ Mn) Comparison, By Board Type
7.1.4. Japan Corrugated Boxes Market Size and Forecast, 2012-2022
7.1.4.1. Revenue (US$ Mn) Comparison, By Material Source
7.1.4.2. Revenue (US$ Mn) Comparison, By End User Industry
7.1.4.3. Revenue (US$ Mn) Comparison, By Packaging Form
7.1.4.4. Revenue (US$ Mn) Comparison, By Board Type
7.1.5. APEJ Corrugated Boxes Market Size and Forecast, 2012-2022
7.1.5.1. Revenue (US$ Mn) Comparison, By Material Source
7.1.5.2. Revenue (US$ Mn) Comparison, By End User Industry
7.1.5.3. Revenue (US$ Mn) Comparison, By Packaging Form
7.1.5.4. Revenue (US$ Mn) Comparison, By Board Type
7.1.6. MEA Corrugated Boxes Market Size and Forecast, 2012-2022
7.1.6.1. Revenue (US$ Mn) Comparison, By Material Source
7.1.6.2. Revenue (US$ Mn) Comparison, By End User Industry
7.1.6.3. Revenue (US$ Mn) Comparison, By Packaging Form
7.1.6.4. Revenue (US$ Mn) Comparison, By Board Type
8. North America Corrugated Boxes Market Analysis and Forecast, By Country, 2012-2022
8.1. US Corrugated Boxes Market Size and Forecast, 2012-2022
8.1.1. Revenue (US$ Mn) Comparison, By Material Source
8.1.2. Revenue (US$ Mn) Comparison, By End User Industry
8.1.3. Revenue (US$ Mn) Comparison, By Packaging Form
8.1.4. Revenue (US$ Mn) Comparison, By Board Type
8.2. Canada Corrugated Boxes Market Size and Forecast, 2012-2022
8.2.1. Revenue (US$ Mn) Comparison, By Material Source
8.2.2. Revenue (US$ Mn) Comparison, By End User Industry
8.2.3. Revenue (US$ Mn) Comparison, By Packaging Form
8.2.4. Revenue (US$ Mn) Comparison, By Board Type
9. Latin America Corrugated Boxes Market Analysis and Forecast, By Country, 2012-2022
9.1. Brazil Corrugated Boxes Market Size and Forecast, 2012-2022
9.1.1. Revenue (US$ Mn) Comparison, By Material Source
9.1.2. Revenue (US$ Mn) Comparison, By End User Industry
9.1.3. Revenue (US$ Mn) Comparison, By Packaging Form
9.1.4. Revenue (US$ Mn) Comparison, By Board Type
9.2. Mexico Corrugated Boxes Market Size and Forecast, 2012-2022
9.2.1. Revenue (US$ Mn) Comparison, By Material Source
9.2.2. Revenue (US$ Mn) Comparison, By End User Industry
9.2.3. Revenue (US$ Mn) Comparison, By Packaging Form
9.2.4. Revenue (US$ Mn) Comparison, By Board Type
9.3. Rest of Latin America Corrugated Boxes Market Size and Forecast, 2012-2022
9.3.1. Revenue (US$ Mn) Comparison, By Material Source
9.3.2. Revenue (US$ Mn) Comparison, By End User Industry
9.3.3. Revenue (US$ Mn) Comparison, By Packaging Form
9.3.4. Revenue (US$ Mn) Comparison, By Board Type
10. Europe Corrugated Boxes Market Analysis and Forecast, By Country, 2012-2022
10.1. Germany Corrugated Boxes Market Size and Forecast, 2012-2022
10.1.1. Revenue (US$ Mn) Comparison, By Material Source
10.1.2. Revenue (US$ Mn) Comparison, By End User Industry
10.1.3. Revenue (US$ Mn) Comparison, By Packaging Form
10.1.4. Revenue (US$ Mn) Comparison, By Board Type
10.2. UK Corrugated Boxes Market Size and Forecast, 2012-2022
10.2.1. Revenue (US$ Mn) Comparison, By Material Source
10.2.2. Revenue (US$ Mn) Comparison, By End User Industry
10.2.3. Revenue (US$ Mn) Comparison, By Packaging Form
10.2.4. Revenue (US$ Mn) Comparison, By Board Type
10.3. France Corrugated Boxes Market Size and Forecast, 2012-2022
10.3.1. Revenue (US$ Mn) Comparison, By Material Source
10.3.2. Revenue (US$ Mn) Comparison, By End User Industry
10.3.3. Revenue (US$ Mn) Comparison, By Packaging Form
10.3.4. Revenue (US$ Mn) Comparison, By Board Type
10.4. Russia Corrugated Boxes Market Size and Forecast, 2012-2022
10.4.1. Revenue (US$ Mn) Comparison, By Material Source
10.4.2. Revenue (US$ Mn) Comparison, By End User Industry
10.4.3. Revenue (US$ Mn) Comparison, By Packaging Form
10.4.4. Revenue (US$ Mn) Comparison, By Board Type
10.5. Italy Corrugated Boxes Market Size and Forecast, 2012-2022
10.5.1. Revenue (US$ Mn) Comparison, By Material Source
10.5.2. Revenue (US$ Mn) Comparison, By End User Industry
10.5.3. Revenue (US$ Mn) Comparison, By Packaging Form
10.5.4. Revenue (US$ Mn) Comparison, By Board Type
10.6. Rest of Europe Corrugated Boxes Market Size and Forecast, 2012-2022
10.6.1. Revenue (US$ Mn) Comparison, By Material Source
10.6.2. Revenue (US$ Mn) Comparison, By End User Industry
10.6.3. Revenue (US$ Mn) Comparison, By Packaging Form
10.6.4. Revenue (US$ Mn) Comparison, By Board Type
11. Japan Corrugated Boxes Market Analysis and Forecast, By Country, 2012-2022
11.1. Japan Corrugated Boxes Market Size and Forecast, 2012-2022
11.1.1. Revenue (US$ Mn) Comparison, By Material Source
11.1.2. Revenue (US$ Mn) Comparison, By End User Industry
11.1.3. Revenue (US$ Mn) Comparison, By Packaging Form
11.1.4. Revenue (US$ Mn) Comparison, By Board Type
12. APEJ Corrugated Boxes Market Analysis and Forecast, By Country, 2012-2022
12.1. China Corrugated Boxes Market Size and Forecast, 2012-2022
12.1.1. Revenue (US$ Mn) Comparison, By Material Source
12.1.2. Revenue (US$ Mn) Comparison, By End User Industry
12.1.3. Revenue (US$ Mn) Comparison, By Packaging Form
12.1.4. Revenue (US$ Mn) Comparison, By Board Type
12.2. India Corrugated Boxes Market Size and Forecast, 2012-2022
12.2.1. Revenue (US$ Mn) Comparison, By Material Source
12.2.2. Revenue (US$ Mn) Comparison, By End User Industry
12.2.3. Revenue (US$ Mn) Comparison, By Packaging Form
12.2.4. Revenue (US$ Mn) Comparison, By Board Type
12.3. Malaysia Corrugated Boxes Market Size and Forecast, 2012-2022
12.3.1. Revenue (US$ Mn) Comparison, By Material Source
12.3.2. Revenue (US$ Mn) Comparison, By End User Industry
12.3.3. Revenue (US$ Mn) Comparison, By Packaging Form
12.3.4. Revenue (US$ Mn) Comparison, By Board Type
12.4. Thailand Corrugated Boxes Market Size and Forecast, 2012-2022
12.4.1. Revenue (US$ Mn) Comparison, By Material Source
12.4.2. Revenue (US$ Mn) Comparison, By End User Industry
12.4.3. Revenue (US$ Mn) Comparison, By Packaging Form
12.4.4. Revenue (US$ Mn) Comparison, By Board Type
12.5. Australia & New Zealand Corrugated Boxes Market Size and Forecast, 2012-2022
12.5.1. Revenue (US$ Mn) Comparison, By Material Source
12.5.2. Revenue (US$ Mn) Comparison, By End User Industry
12.5.3. Revenue (US$ Mn) Comparison, By Packaging Form
12.5.4. Revenue (US$ Mn) Comparison, By Board Type
12.6. Rest of APEJ Corrugated Boxes Market Size and Forecast, 2012-2022
12.6.1. Revenue (US$ Mn) Comparison, By Material Source
12.6.2. Revenue (US$ Mn) Comparison, By End User Industry
12.6.3. Revenue (US$ Mn) Comparison, By Packaging Form
12.6.4. Revenue (US$ Mn) Comparison, By Board Type
13. MEA Corrugated Boxes Market Analysis and Forecast, By Country, 2012-2022
13.1. GCC Countries Corrugated Boxes Market Size and Forecast, 2012-2022
13.1.1. Revenue (US$ Mn) Comparison, By Material Source
13.1.2. Revenue (US$ Mn) Comparison, By End User Industry
13.1.3. Revenue (US$ Mn) Comparison, By Packaging Form
13.1.4. Revenue (US$ Mn) Comparison, By Board Type
13.2. South Africa Corrugated Boxes Market Size and Forecast, 2012-2022
13.2.1. Revenue (US$ Mn) Comparison, By Material Source
13.2.2. Revenue (US$ Mn) Comparison, By End User Industry
13.2.3. Revenue (US$ Mn) Comparison, By Packaging Form
13.2.4. Revenue (US$ Mn) Comparison, By Board Type
13.3. Israel Corrugated Boxes Market Size and Forecast, 2012-2022
13.3.1. Revenue (US$ Mn) Comparison, By Material Source
13.3.2. Revenue (US$ Mn) Comparison, By End User Industry
13.3.3. Revenue (US$ Mn) Comparison, By Packaging Form
13.3.4. Revenue (US$ Mn) Comparison, By Board Type
13.4. Rest of MEA Corrugated Boxes Market Size and Forecast, 2012-2022
13.4.1. Revenue (US$ Mn) Comparison, By Material Source
13.4.2. Revenue (US$ Mn) Comparison, By End User Industry
13.4.3. Revenue (US$ Mn) Comparison, By Packaging Form
13.4.4. Revenue (US$ Mn) Comparison, By Board Type
14. Global Corrugated Boxes Market Company Share, Competition Landscape and Company Profiles
14.1. Company Share Analysis
14.2. Competition Landscape
14.3. Company Profiles
14.3.1. International Paper Company
14.3.2. DS Smith Plc
14.3.3. Smurfit Kappa Group PLC
14.3.4. Sonoco Products Company
14.3.5. Georgia Pacific LLC
14.3.6. WestRock Company
14.3.7. Pratt Industries Inc.
14.3.8. Huhtamaki Oyj
14.3.9. KapStone Paper and Packaging Corp
14.3.10. Stora Enso Oyj
15. Research Methodology
16. Secondary and Primary Sources
17. Assumptions and Acronyms
18. Disclaimer
List of Tables
TABLE 1 Global Corrugated Boxes Market Value (US$ Mn), 2012-2016
TABLE 2 Global Corrugated Boxes Market Value (US$ Mn), 2017-2022
TABLE 3 Global Corrugated Boxes Market Value (US$ Mn) and Y-o-Y, 2015-2022
TABLE 4 Global Virgin Fiber Segment Value (US$ Mn), By Region 2012-2016
TABLE 5 Global Virgin Fiber Segment Value (US$ Mn), By Region 2017-2022
TABLE 6 Global Virgin Fiber Segment Market Share, By Region 2012-2016
TABLE 7 Global Virgin Fiber Segment Market Share, By Region 2017-2022
TABLE 8 Global Virgin Fiber Segment Y-o-Y, By Region 2015-2022
TABLE 9 Global Recycled Fiber Segment Value (US$ Mn), By Region 2012-2016
TABLE 10 Global Recycled Fiber Segment Value (US$ Mn), By Region 2017-2022
TABLE 11 Global Recycled Fiber Segment Market Share, By Region 2012-2016
TABLE 12 Global Recycled Fiber Segment Market Share, By Region 2017-2022
TABLE 13 Global Recycled Fiber Segment Y-o-Y, By Region 2015-2022
TABLE 14 Global Food Segment Value (US$ Mn), By Region 2012-2016
TABLE 15 Global Food Segment Value (US$ Mn), By Region 2017-2022
TABLE 16 Global Food Segment Market Share, By Region 2012-2016
TABLE 17 Global Food Segment Market Share, By Region 2017-2022
TABLE 18 Global Food Segment Y-o-Y, By Region 2015-2022
TABLE 19 Global Beverages Segment Value (US$ Mn), By Region 2012-2016
TABLE 20 Global Beverages Segment Value (US$ Mn), By Region 2017-2022
TABLE 21 Global Beverages Segment Market Share, By Region 2012-2016
TABLE 22 Global Beverages Segment Market Share, By Region 2017-2022
TABLE 23 Global Beverages Segment Y-o-Y, By Region 2015-2022
TABLE 24 Global Tobacco Segment Value (US$ Mn), By Region 2012-2016
TABLE 25 Global Tobacco Segment Value (US$ Mn), By Region 2017-2022
TABLE 26 Global Tobacco Segment Market Share, By Region 2012-2016
TABLE 27 Global Tobacco Segment Market Share, By Region 2017-2022
TABLE 28 Global Tobacco Segment Y-o-Y, By Region 2015-2022
TABLE 29 Global Healthcare Segment Value (US$ Mn), By Region 2012-2016
TABLE 30 Global Healthcare Segment Value (US$ Mn), By Region 2017-2022
TABLE 31 Global Healthcare Segment Market Share, By Region 2012-2016
TABLE 32 Global Healthcare Segment Market Share, By Region 2017-2022
TABLE 33 Global Healthcare Segment Y-o-Y, By Region 2015-2022
TABLE 34 Global Personal Care & Cosmetics Segment Value (US$ Mn), By Region 2012-2016
TABLE 35 Global Personal Care & Cosmetics Segment Value (US$ Mn), By Region 2017-2022
TABLE 36 Global Personal Care & Cosmetics Segment Market Share, By Region 2012-2016
TABLE 37 Global Personal Care & Cosmetics Segment Market Share, By Region 2017-2022
TABLE 38 Global Personal Care & Cosmetics Segment Y-o-Y, By Region 2015-2022
TABLE 39 Global Homecare & Toiletries Segment Value (US$ Mn), By Region 2012-2016
TABLE 40 Global Homecare & Toiletries Segment Value (US$ Mn), By Region 2017-2022
TABLE 41 Global Homecare & Toiletries Segment Market Share, By Region 2012-2016
TABLE 42 Global Homecare & Toiletries Segment Market Share, By Region 2017-2022
TABLE 43 Global Homecare & Toiletries Segment Y-o-Y, By Region 2015-2022
TABLE 44 Global Electronic & Consumer Durables Segment Value (US$ Mn), By Region 2012-2016
TABLE 45 Global Electronic & Consumer Durables Segment Value (US$ Mn), By Region 2017-2022
TABLE 46 Global Electronic & Consumer Durables Segment Market Share, By Region 2012-2016
TABLE 47 Global Electronic & Consumer Durables Segment Market Share, By Region 2017-2022
TABLE 48 Global Electronic & Consumer Durables Segment Y-o-Y, By Region 2015-2022
TABLE 49 Global E-Commerce Segment Value (US$ Mn), By Region 2012-2016
TABLE 50 Global E-Commerce Segment Value (US$ Mn), By Region 2017-2022
TABLE 51 Global E-Commerce Segment Market Share, By Region 2012-2016
TABLE 52 Global E-Commerce Segment Market Share, By Region 2017-2022
TABLE 53 Global E-Commerce Segment Y-o-Y, By Region 2015-2022
TABLE 54 Global Chemical & Fertilizers Segment Value (US$ Mn), By Region 2012-2016
TABLE 55 Global Chemical & Fertilizers Segment Value (US$ Mn), By Region 2017-2022
TABLE 56 Global Chemical & Fertilizers Segment Market Share, By Region 2012-2016
TABLE 57 Global Chemical & Fertilizers Segment Market Share, By Region 2017-2022
TABLE 58 Global Chemical & Fertilizers Segment Y-o-Y, By Region 2015-2022
TABLE 59 Global Others (Automotive Parts, Machinery components etc) Segment Value (US$ Mn), By Region 2012-2016
TABLE 60 Global Others (Automotive Parts, Machinery components etc) Segment Value (US$ Mn), By Region 2017-2022
TABLE 61 Global Others (Automotive Parts, Machinery components etc) Segment Market Share, By Region 2012-2016
TABLE 62 Global Others (Automotive Parts, Machinery components etc) Segment Market Share, By Region 2017-2022
TABLE 63 Global Others (Automotive Parts, Machinery components etc) Segment Y-o-Y, By Region 2015-2022
TABLE 64 Global Primary Packaging Segment Value (US$ Mn), By Region 2012-2016
TABLE 65 Global Primary Packaging Segment Value (US$ Mn), By Region 2017-2022
TABLE 66 Global Primary Packaging Segment Market Share, By Region 2012-2016
TABLE 67 Global Primary Packaging Segment Market Share, By Region 2017-2022
TABLE 68 Global Primary Packaging Segment Y-o-Y, By Region 2015-2022
TABLE 69 Global Secondary Packaging Segment Value (US$ Mn), By Region 2012-2016
TABLE 70 Global Secondary Packaging Segment Value (US$ Mn), By Region 2017-2022
TABLE 71 Global Secondary Packaging Segment Market Share, By Region 2012-2016
TABLE 72 Global Secondary Packaging Segment Market Share, By Region 2017-2022
TABLE 73 Global Secondary Packaging Segment Y-o-Y, By Region 2015-2022
TABLE 74 Global Single Wall Segment Value (US$ Mn), By Region 2012-2016
TABLE 75 Global Single Wall Segment Value (US$ Mn), By Region 2017-2022
TABLE 76 Global Single Wall Segment Market Share, By Region 2012-2016
TABLE 77 Global Single Wall Segment Market Share, By Region 2017-2022
TABLE 78 Global Single Wall Segment Y-o-Y, By Region 2015-2022
TABLE 79 Global Double Wall Segment Value (US$ Mn), By Region 2012-2016
TABLE 80 Global Double Wall Segment Value (US$ Mn), By Region 2017-2022
TABLE 81 Global Double Wall Segment Market Share, By Region 2012-2016
TABLE 82 Global Double Wall Segment Market Share, By Region 2017-2022
TABLE 83 Global Double Wall Segment Y-o-Y, By Region 2015-2022
TABLE 84 Global Tripe Wall Segment Value (US$ Mn), By Region 2012-2016
TABLE 85 Global Tripe Wall Segment Value (US$ Mn), By Region 2017-2022
TABLE 86 Global Tripe Wall Segment Market Share, By Region 2012-2016
TABLE 87 Global Tripe Wall Segment Market Share, By Region 2017-2022
TABLE 88 Global Tripe Wall Segment Y-o-Y, By Region 2015-2022
TABLE 89 North America Corrugated Boxes Market Value (US$ Mn), By Material Source2012-2016
TABLE 90 North America Corrugated Boxes Market Value (US$ Mn), By Material Source2017-2022
TABLE 91 North America Corrugated Boxes Market Value (US$ Mn), By End User Industry2012-2016
TABLE 92 North America Corrugated Boxes Market Value (US$ Mn), By End User Industry2017-2022
TABLE 93 North America Corrugated Boxes Market Value (US$ Mn), By Packaging Form2012-2016
TABLE 94 North America Corrugated Boxes Market Value (US$ Mn), By Packaging Form2017-2022
TABLE 95 North America Corrugated Boxes Market Value (US$ Mn), By Board Type2012-2016
TABLE 96 North America Corrugated Boxes Market Value (US$ Mn), By Board Type2017-2022
TABLE 97 Latin America Corrugated Boxes Market Value (US$ Mn), By Material Source2012-2016
TABLE 98 Latin America Corrugated Boxes Market Value (US$ Mn), By Material Source2017-2022
TABLE 99 Latin America Corrugated Boxes Market Value (US$ Mn), By End User Industry2012-2016
TABLE 100 Latin America Corrugated Boxes Market Value (US$ Mn), By End User Industry2017-2022
TABLE 101 Latin America Corrugated Boxes Market Value (US$ Mn), By Packaging Form2012-2016
TABLE 102 Latin America Corrugated Boxes Market Value (US$ Mn), By Packaging Form2017-2022
TABLE 103 Latin America Corrugated Boxes Market Value (US$ Mn), By Board Type2012-2016
TABLE 104 Latin America Corrugated Boxes Market Value (US$ Mn), By Board Type2017-2022
TABLE 105 Europe Corrugated Boxes Market Value (US$ Mn), By Material Source2012-2016
TABLE 106 Europe Corrugated Boxes Market Value (US$ Mn), By Material Source2017-2022
TABLE 107 Europe Corrugated Boxes Market Value (US$ Mn), By End User Industry2012-2016
TABLE 108 Europe Corrugated Boxes Market Value (US$ Mn), By End User Industry2017-2022
TABLE 109 Europe Corrugated Boxes Market Value (US$ Mn), By Packaging Form2012-2016
TABLE 110 Europe Corrugated Boxes Market Value (US$ Mn), By Packaging Form2017-2022
TABLE 111 Europe Corrugated Boxes Market Value (US$ Mn), By Board Type2012-2016
TABLE 112 Europe Corrugated Boxes Market Value (US$ Mn), By Board Type2017-2022
TABLE 113 Japan Corrugated Boxes Market Value (US$ Mn), By Material Source2012-2016
TABLE 114 Japan Corrugated Boxes Market Value (US$ Mn), By Material Source2017-2022
TABLE 115 Japan Corrugated Boxes Market Value (US$ Mn), By End User Industry2012-2016
TABLE 116 Japan Corrugated Boxes Market Value (US$ Mn), By End User Industry2017-2022
TABLE 117 Japan Corrugated Boxes Market Value (US$ Mn), By Packaging Form2012-2016
TABLE 118 Japan Corrugated Boxes Market Value (US$ Mn), By Packaging Form2017-2022
TABLE 119 Japan Corrugated Boxes Market Value (US$ Mn), By Board Type2012-2016
TABLE 120 Japan Corrugated Boxes Market Value (US$ Mn), By Board Type2017-2022
TABLE 121 APEJ Corrugated Boxes Market Value (US$ Mn), By Material Source2012-2016
TABLE 122 APEJ Corrugated Boxes Market Value (US$ Mn), By Material Source2017-2022
TABLE 123 APEJ Corrugated Boxes Market Value (US$ Mn), By End User Industry2012-2016
TABLE 124 APEJ Corrugated Boxes Market Value (US$ Mn), By End User Industry2017-2022
TABLE 125 APEJ Corrugated Boxes Market Value (US$ Mn), By Packaging Form2012-2016
TABLE 126 APEJ Corrugated Boxes Market Value (US$ Mn), By Packaging Form2017-2022
TABLE 127 APEJ Corrugated Boxes Market Value (US$ Mn), By Board Type2012-2016
TABLE 128 APEJ Corrugated Boxes Market Value (US$ Mn), By Board Type2017-2022
TABLE 129 MEA Corrugated Boxes Market Value (US$ Mn), By Material Source2012-2016
TABLE 130 MEA Corrugated Boxes Market Value (US$ Mn), By Material Source2017-2022
TABLE 131 MEA Corrugated Boxes Market Value (US$ Mn), By End User Industry2012-2016
TABLE 132 MEA Corrugated Boxes Market Value (US$ Mn), By End User Industry2017-2022
TABLE 133 MEA Corrugated Boxes Market Value (US$ Mn), By Packaging Form2012-2016
TABLE 134 MEA Corrugated Boxes Market Value (US$ Mn), By Packaging Form2017-2022
TABLE 135 MEA Corrugated Boxes Market Value (US$ Mn), By Board Type2012-2016
TABLE 136 MEA Corrugated Boxes Market Value (US$ Mn), By Board Type2017-2022
TABLE 137 US Corrugated Boxes Market Value (US$ Mn), By Material Source2012-2016
TABLE 138 US Corrugated Boxes Market Value (US$ Mn), By Material Source2017-2022
TABLE 139 US Corrugated Boxes Market Value (US$ Mn), By End User Industry2012-2016
TABLE 140 US Corrugated Boxes Market Value (US$ Mn), By End User Industry2017-2022
TABLE 141 US Corrugated Boxes Market Value (US$ Mn), By Packaging Form2012-2016
TABLE 142 US Corrugated Boxes Market Value (US$ Mn), By Packaging Form2017-2022
TABLE 143 US Corrugated Boxes Market Value (US$ Mn), By Board Type2012-2016
TABLE 144 US Corrugated Boxes Market Value (US$ Mn), By Board Type2017-2022
TABLE 145 Canada Corrugated Boxes Market Value (US$ Mn), By Material Source2012-2016
TABLE 146 Canada Corrugated Boxes Market Value (US$ Mn), By Material Source2017-2022
TABLE 147 Canada Corrugated Boxes Market Value (US$ Mn), By End User Industry2012-2016
TABLE 148 Canada Corrugated Boxes Market Value (US$ Mn), By End User Industry2017-2022
TABLE 149 Canada Corrugated Boxes Market Value (US$ Mn), By Packaging Form2012-2016
TABLE 150 Canada Corrugated Boxes Market Value (US$ Mn), By Packaging Form2017-2022
TABLE 151 Canada Corrugated Boxes Market Value (US$ Mn), By Board Type2012-2016
TABLE 152 Canada Corrugated Boxes Market Value (US$ Mn), By Board Type2017-2022
TABLE 153 Brazil Corrugated Boxes Market Value (US$ Mn), By Material Source2012-2016
TABLE 154 Brazil Corrugated Boxes Market Value (US$ Mn), By Material Source2017-2022
TABLE 155 Brazil Corrugated Boxes Market Value (US$ Mn), By End User Industry2012-2016
TABLE 156 Brazil Corrugated Boxes Market Value (US$ Mn), By End User Industry2017-2022
TABLE 157 Brazil Corrugated Boxes Market Value (US$ Mn), By Packaging Form2012-2016
TABLE 158 Brazil Corrugated Boxes Market Value (US$ Mn), By Packaging Form2017-2022
TABLE 159 Brazil Corrugated Boxes Market Value (US$ Mn), By Board Type2012-2016
TABLE 160 Brazil Corrugated Boxes Market Value (US$ Mn), By Board Type2017-2022
TABLE 161 Mexico Corrugated Boxes Market Value (US$ Mn), By Material Source2012-2016
TABLE 162 Mexico Corrugated Boxes Market Value (US$ Mn), By Material Source2017-2022
TABLE 163 Mexico Corrugated Boxes Market Value (US$ Mn), By End User Industry2012-2016
TABLE 164 Mexico Corrugated Boxes Market Value (US$ Mn), By End User Industry2017-2022
TABLE 165 Mexico Corrugated Boxes Market Value (US$ Mn), By Packaging Form2012-2016
TABLE 166 Mexico Corrugated Boxes Market Value (US$ Mn), By Packaging Form2017-2022
TABLE 167 Mexico Corrugated Boxes Market Value (US$ Mn), By Board Type2012-2016
TABLE 168 Mexico Corrugated Boxes Market Value (US$ Mn), By Board Type2017-2022
TABLE 169 Rest of Latin America Corrugated Boxes Market Value (US$ Mn), By Material Source2012-2016
TABLE 170 Rest of Latin America Corrugated Boxes Market Value (US$ Mn), By Material Source2017-2022
TABLE 171 Rest of Latin America Corrugated Boxes Market Value (US$ Mn), By End User Industry2012-2016
TABLE 172 Rest of Latin America Corrugated Boxes Market Value (US$ Mn), By End User Industry2017-2022
TABLE 173 Rest of Latin America Corrugated Boxes Market Value (US$ Mn), By Packaging Form2012-2016
TABLE 174 Rest of Latin America Corrugated Boxes Market Value (US$ Mn), By Packaging Form2017-2022
TABLE 175 Rest of Latin America Corrugated Boxes Market Value (US$ Mn), By Board Type2012-2016
TABLE 176 Rest of Latin America Corrugated Boxes Market Value (US$ Mn), By Board Type2017-2022
TABLE 177 Germany Corrugated Boxes Market Value (US$ Mn), By Material Source2012-2016
TABLE 178 Germany Corrugated Boxes Market Value (US$ Mn), By Material Source2017-2022
TABLE 179 Germany Corrugated Boxes Market Value (US$ Mn), By End User Industry2012-2016
TABLE 180 Germany Corrugated Boxes Market Value (US$ Mn), By End User Industry2017-2022
TABLE 181 Germany Corrugated Boxes Market Value (US$ Mn), By Packaging Form2012-2016
TABLE 182 Germany Corrugated Boxes Market Value (US$ Mn), By Packaging Form2017-2022
TABLE 183 Germany Corrugated Boxes Market Value (US$ Mn), By Board Type2012-2016
TABLE 184 Germany Corrugated Boxes Market Value (US$ Mn), By Board Type2017-2022
TABLE 185 UK Corrugated Boxes Market Value (US$ Mn), By Material Source2012-2016
TABLE 186 UK Corrugated Boxes Market Value (US$ Mn), By Material Source2017-2022
TABLE 187 UK Corrugated Boxes Market Value (US$ Mn), By End User Industry2012-2016
TABLE 188 UK Corrugated Boxes Market Value (US$ Mn), By End User Industry2017-2022
TABLE 189 UK Corrugated Boxes Market Value (US$ Mn), By Packaging Form2012-2016
TABLE 190 UK Corrugated Boxes Market Value (US$ Mn), By Packaging Form2017-2022
TABLE 191 UK Corrugated Boxes Market Value (US$ Mn), By Board Type2012-2016
TABLE 192 UK Corrugated Boxes Market Value (US$ Mn), By Board Type2017-2022
TABLE 193 France Corrugated Boxes Market Value (US$ Mn), By Material Source2012-2016
TABLE 194 France Corrugated Boxes Market Value (US$ Mn), By Material Source2017-2022
TABLE 195 France Corrugated Boxes Market Value (US$ Mn), By End User Industry2012-2016
TABLE 196 France Corrugated Boxes Market Value (US$ Mn), By End User Industry2017-2022
TABLE 197 France Corrugated Boxes Market Value (US$ Mn), By Packaging Form2012-2016
TABLE 198 France Corrugated Boxes Market Value (US$ Mn), By Packaging Form2017-2022
TABLE 199 France Corrugated Boxes Market Value (US$ Mn), By Board Type2012-2016
TABLE 200 France Corrugated Boxes Market Value (US$ Mn), By Board Type2017-2022
TABLE 201 Russia Corrugated Boxes Market Value (US$ Mn), By Material Source2012-2016
TABLE 202 Russia Corrugated Boxes Market Value (US$ Mn), By Material Source2017-2022
TABLE 203 Russia Corrugated Boxes Market Value (US$ Mn), By End User Industry2012-2016
TABLE 204 Russia Corrugated Boxes Market Value (US$ Mn), By End User Industry2017-2022
TABLE 205 Russia Corrugated Boxes Market Value (US$ Mn), By Packaging Form2012-2016
TABLE 206 Russia Corrugated Boxes Market Value (US$ Mn), By Packaging Form2017-2022
TABLE 207 Russia Corrugated Boxes Market Value (US$ Mn), By Board Type2012-2016
TABLE 208 Russia Corrugated Boxes Market Value (US$ Mn), By Board Type2017-2022
TABLE 209 Italy Corrugated Boxes Market Value (US$ Mn), By Material Source2012-2016
TABLE 210 Italy Corrugated Boxes Market Value (US$ Mn), By Material Source2017-2022
TABLE 211 Italy Corrugated Boxes Market Value (US$ Mn), By End User Industry2012-2016
TABLE 212 Italy Corrugated Boxes Market Value (US$ Mn), By End User Industry2017-2022
TABLE 213 Italy Corrugated Boxes Market Value (US$ Mn), By Packaging Form2012-2016
TABLE 214 Italy Corrugated Boxes Market Value (US$ Mn), By Packaging Form2017-2022
TABLE 215 Italy Corrugated Boxes Market Value (US$ Mn), By Board Type2012-2016
TABLE 216 Italy Corrugated Boxes Market Value (US$ Mn), By Board Type2017-2022
TABLE 217 Rest of Europe Corrugated Boxes Market Value (US$ Mn), By Material Source2012-2016
TABLE 218 Rest of Europe Corrugated Boxes Market Value (US$ Mn), By Material Source2017-2022
TABLE 219 Rest of Europe Corrugated Boxes Market Value (US$ Mn), By End User Industry2012-2016
TABLE 220 Rest of Europe Corrugated Boxes Market Value (US$ Mn), By End User Industry2017-2022
TABLE 221 Rest of Europe Corrugated Boxes Market Value (US$ Mn), By Packaging Form2012-2016
TABLE 222 Rest of Europe Corrugated Boxes Market Value (US$ Mn), By Packaging Form2017-2022
TABLE 223 Rest of Europe Corrugated Boxes Market Value (US$ Mn), By Board Type2012-2016
TABLE 224 Rest of Europe Corrugated Boxes Market Value (US$ Mn), By Board Type2017-2022
TABLE 225 Japan Corrugated Boxes Market Value (US$ Mn), By Material Source2012-2016
TABLE 226 Japan Corrugated Boxes Market Value (US$ Mn), By Material Source2017-2022
TABLE 227 Japan Corrugated Boxes Market Value (US$ Mn), By End User Industry2012-2016
TABLE 228 Japan Corrugated Boxes Market Value (US$ Mn), By End User Industry2017-2022
TABLE 229 Japan Corrugated Boxes Market Value (US$ Mn), By Packaging Form2012-2016
TABLE 230 Japan Corrugated Boxes Market Value (US$ Mn), By Packaging Form2017-2022
TABLE 231 Japan Corrugated Boxes Market Value (US$ Mn), By Board Type2012-2016
TABLE 232 Japan Corrugated Boxes Market Value (US$ Mn), By Board Type2017-2022
TABLE 233 China Corrugated Boxes Market Value (US$ Mn), By Material Source2012-2016
TABLE 234 China Corrugated Boxes Market Value (US$ Mn), By Material Source2017-2022
TABLE 235 China Corrugated Boxes Market Value (US$ Mn), By End User Industry2012-2016
TABLE 236 China Corrugated Boxes Market Value (US$ Mn), By End User Industry2017-2022
TABLE 237 China Corrugated Boxes Market Value (US$ Mn), By Packaging Form2012-2016
TABLE 238 China Corrugated Boxes Market Value (US$ Mn), By Packaging Form2017-2022
TABLE 239 China Corrugated Boxes Market Value (US$ Mn), By Board Type2012-2016
TABLE 240 China Corrugated Boxes Market Value (US$ Mn), By Board Type2017-2022
TABLE 241 India Corrugated Boxes Market Value (US$ Mn), By Material Source2012-2016
TABLE 242 India Corrugated Boxes Market Value (US$ Mn), By Material Source2017-2022
TABLE 243 India Corrugated Boxes Market Value (US$ Mn), By End User Industry2012-2016
TABLE 244 India Corrugated Boxes Market Value (US$ Mn), By End User Industry2017-2022
TABLE 245 India Corrugated Boxes Market Value (US$ Mn), By Packaging Form2012-2016
TABLE 246 India Corrugated Boxes Market Value (US$ Mn), By Packaging Form2017-2022
TABLE 247 India Corrugated Boxes Market Value (US$ Mn), By Board Type2012-2016
TABLE 248 India Corrugated Boxes Market Value (US$ Mn), By Board Type2017-2022
TABLE 249 Malaysia Corrugated Boxes Market Value (US$ Mn), By Material Source2012-2016
TABLE 250 Malaysia Corrugated Boxes Market Value (US$ Mn), By Material Source2017-2022
TABLE 251 Malaysia Corrugated Boxes Market Value (US$ Mn), By End User Industry2012-2016
TABLE 252 Malaysia Corrugated Boxes Market Value (US$ Mn), By End User Industry2017-2022
TABLE 253 Malaysia Corrugated Boxes Market Value (US$ Mn), By Packaging Form2012-2016
TABLE 254 Malaysia Corrugated Boxes Market Value (US$ Mn), By Packaging Form2017-2022
TABLE 255 Malaysia Corrugated Boxes Market Value (US$ Mn), By Board Type2012-2016
TABLE 256 Malaysia Corrugated Boxes Market Value (US$ Mn), By Board Type2017-2022
TABLE 257 Thailand Corrugated Boxes Market Value (US$ Mn), By Material Source2012-2016
TABLE 258 Thailand Corrugated Boxes Market Value (US$ Mn), By Material Source2017-2022
TABLE 259 Thailand Corrugated Boxes Market Value (US$ Mn), By End User Industry2012-2016
TABLE 260 Thailand Corrugated Boxes Market Value (US$ Mn), By End User Industry2017-2022
TABLE 261 Thailand Corrugated Boxes Market Value (US$ Mn), By Packaging Form2012-2016
TABLE 262 Thailand Corrugated Boxes Market Value (US$ Mn), By Packaging Form2017-2022
TABLE 263 Thailand Corrugated Boxes Market Value (US$ Mn), By Board Type2012-2016
TABLE 264 Thailand Corrugated Boxes Market Value (US$ Mn), By Board Type2017-2022
TABLE 265 Australia & New Zealand Corrugated Boxes Market Value (US$ Mn), By Material Source2012-2016
TABLE 266 Australia & New Zealand Corrugated Boxes Market Value (US$ Mn), By Material Source2017-2022
TABLE 267 Australia & New Zealand Corrugated Boxes Market Value (US$ Mn), By End User Industry2012-2016
TABLE 268 Australia & New Zealand Corrugated Boxes Market Value (US$ Mn), By End User Industry2017-2022
TABLE 269 Australia & New Zealand Corrugated Boxes Market Value (US$ Mn), By Packaging Form2012-2016
TABLE 270 Australia & New Zealand Corrugated Boxes Market Value (US$ Mn), By Packaging Form2017-2022
TABLE 271 Australia & New Zealand Corrugated Boxes Market Value (US$ Mn), By Board Type2012-2016
TABLE 272 Australia & New Zealand Corrugated Boxes Market Value (US$ Mn), By Board Type2017-2022
TABLE 273 Rest of APEJ Corrugated Boxes Market Value (US$ Mn), By Material Source2012-2016
TABLE 274 Rest of APEJ Corrugated Boxes Market Value (US$ Mn), By Material Source2017-2022
TABLE 275 Rest of APEJ Corrugated Boxes Market Value (US$ Mn), By End User Industry2012-2016
TABLE 276 Rest of APEJ Corrugated Boxes Market Value (US$ Mn), By End User Industry2017-2022
TABLE 277 Rest of APEJ Corrugated Boxes Market Value (US$ Mn), By Packaging Form2012-2016
TABLE 278 Rest of APEJ Corrugated Boxes Market Value (US$ Mn), By Packaging Form2017-2022
TABLE 279 Rest of APEJ Corrugated Boxes Market Value (US$ Mn), By Board Type2012-2016
TABLE 280 Rest of APEJ Corrugated Boxes Market Value (US$ Mn), By Board Type2017-2022
TABLE 281 GCC Countries Corrugated Boxes Market Value (US$ Mn), By Material Source2012-2016
TABLE 282 GCC Countries Corrugated Boxes Market Value (US$ Mn), By Material Source2017-2022
TABLE 283 GCC Countries Corrugated Boxes Market Value (US$ Mn), By End User Industry2012-2016
TABLE 284 GCC Countries Corrugated Boxes Market Value (US$ Mn), By End User Industry2017-2022
TABLE 285 GCC Countries Corrugated Boxes Market Value (US$ Mn), By Packaging Form2012-2016
TABLE 286 GCC Countries Corrugated Boxes Market Value (US$ Mn), By Packaging Form2017-2022
TABLE 287 GCC Countries Corrugated Boxes Market Value (US$ Mn), By Board Type2012-2016
TABLE 288 GCC Countries Corrugated Boxes Market Value (US$ Mn), By Board Type2017-2022
TABLE 289 South Africa Corrugated Boxes Market Value (US$ Mn), By Material Source2012-2016
TABLE 290 South Africa Corrugated Boxes Market Value (US$ Mn), By Material Source2017-2022
TABLE 291 South Africa Corrugated Boxes Market Value (US$ Mn), By End User Industry2012-2016
TABLE 292 South Africa Corrugated Boxes Market Value (US$ Mn), By End User Industry2017-2022
TABLE 293 South Africa Corrugated Boxes Market Value (US$ Mn), By Packaging Form2012-2016
TABLE 294 South Africa Corrugated Boxes Market Value (US$ Mn), By Packaging Form2017-2022
TABLE 295 South Africa Corrugated Boxes Market Value (US$ Mn), By Board Type2012-2016
TABLE 296 South Africa Corrugated Boxes Market Value (US$ Mn), By Board Type2017-2022
TABLE 297 Israel Corrugated Boxes Market Value (US$ Mn), By Material Source2012-2016
TABLE 298 Israel Corrugated Boxes Market Value (US$ Mn), By Material Source2017-2022
TABLE 299 Israel Corrugated Boxes Market Value (US$ Mn), By End User Industry2012-2016
TABLE 300 Israel Corrugated Boxes Market Value (US$ Mn), By End User Industry2017-2022
TABLE 301 Israel Corrugated Boxes Market Value (US$ Mn), By Packaging Form2012-2016
TABLE 302 Israel Corrugated Boxes Market Value (US$ Mn), By Packaging Form2017-2022
TABLE 303 Israel Corrugated Boxes Market Value (US$ Mn), By Board Type2012-2016
TABLE 304 Israel Corrugated Boxes Market Value (US$ Mn), By Board Type2017-2022
TABLE 305 Rest of MEA Corrugated Boxes Market Value (US$ Mn), By Material Source2012-2016
TABLE 306 Rest of MEA Corrugated Boxes Market Value (US$ Mn), By Material Source2017-2022
TABLE 307 Rest of MEA Corrugated Boxes Market Value (US$ Mn), By End User Industry2012-2016
TABLE 308 Rest of MEA Corrugated Boxes Market Value (US$ Mn), By End User Industry2017-2022
TABLE 309 Rest of MEA Corrugated Boxes Market Value (US$ Mn), By Packaging Form2012-2016
TABLE 310 Rest of MEA Corrugated Boxes Market Value (US$ Mn), By Packaging Form2017-2022
TABLE 311 Rest of MEA Corrugated Boxes Market Value (US$ Mn), By Board Type2012-2016
TABLE 312 Rest of MEA Corrugated Boxes Market Value (US$ Mn), By Board Type2017-2022
List of figures
FIG. 1 Global Corrugated Boxes Market Value (US$ Mn), 2012-2016
FIG. 2 Global Corrugated Boxes Market Value (US$ Mn) Forecast, 2017-2022
FIG. 3 Global Corrugated Boxes Market Value (US$ Mn) and Y-o-Y, 2015-2022
FIG. 4 Global Virgin Fiber Segment Market Value (US$ Mn) By Region, 2012-2016
FIG. 5 Global Virgin Fiber Segment Market Value (US$ Mn) By Region, 2017-2022
FIG. 6 Global Virgin Fiber Segment Y-o-Y Growth Rate, By Region, 2015-2022
FIG. 7 Global Recycled Fiber Segment Market Value (US$ Mn) By Region, 2012-2016
FIG. 8 Global Recycled Fiber Segment Market Value (US$ Mn) By Region, 2017-2022
FIG. 9 Global Recycled Fiber Segment Y-o-Y Growth Rate, By Region, 2015-2022
FIG. 10 Global Food Segment Market Value (US$ Mn) By Region, 2012-2016
FIG. 11 Global Food Segment Market Value (US$ Mn) By Region, 2017-2022
FIG. 12 Global Food Segment Y-o-Y Growth Rate, By Region, 2015-2022
FIG. 13 Global Beverages Segment Market Value (US$ Mn) By Region, 2012-2016
FIG. 14 Global Beverages Segment Market Value (US$ Mn) By Region, 2017-2022
FIG. 15 Global Beverages Segment Y-o-Y Growth Rate, By Region, 2015-2022
FIG. 16 Global Tobacco Segment Market Value (US$ Mn) By Region, 2012-2016
FIG. 17 Global Tobacco Segment Market Value (US$ Mn) By Region, 2017-2022
FIG. 18 Global Tobacco Segment Y-o-Y Growth Rate, By Region, 2015-2022
FIG. 19 Global Healthcare Segment Market Value (US$ Mn) By Region, 2012-2016
FIG. 20 Global Healthcare Segment Market Value (US$ Mn) By Region, 2017-2022
FIG. 21 Global Healthcare Segment Y-o-Y Growth Rate, By Region, 2015-2022
FIG. 22 Global Personal Care & Cosmetics Segment Market Value (US$ Mn) By Region, 2012-2016
FIG. 23 Global Personal Care & Cosmetics Segment Market Value (US$ Mn) By Region, 2017-2022
FIG. 24 Global Personal Care & Cosmetics Segment Y-o-Y Growth Rate, By Region, 2015-2022
FIG. 25 Global Homecare & Toiletries Segment Market Value (US$ Mn) By Region, 2012-2016
FIG. 26 Global Homecare & Toiletries Segment Market Value (US$ Mn) By Region, 2017-2022
FIG. 27 Global Homecare & Toiletries Segment Y-o-Y Growth Rate, By Region, 2015-2022
FIG. 28 Global Electronic & Consumer Durables Segment Market Value (US$ Mn) By Region, 2012-2016
FIG. 29 Global Electronic & Consumer Durables Segment Market Value (US$ Mn) By Region, 2017-2022
FIG. 30 Global Electronic & Consumer Durables Segment Y-o-Y Growth Rate, By Region, 2015-2022
FIG. 31 Global E-Commerce Segment Market Value (US$ Mn) By Region, 2012-2016
FIG. 32 Global E-Commerce Segment Market Value (US$ Mn) By Region, 2017-2022
FIG. 33 Global E-Commerce Segment Y-o-Y Growth Rate, By Region, 2015-2022
FIG. 34 Global Chemical & Fertilizers Segment Market Value (US$ Mn) By Region, 2012-2016
FIG. 35 Global Chemical & Fertilizers Segment Market Value (US$ Mn) By Region, 2017-2022
FIG. 36 Global Chemical & Fertilizers Segment Y-o-Y Growth Rate, By Region, 2015-2022
FIG. 37 Global Others (Automotive Parts, Machinery components etc) Segment Market Value (US$ Mn) By Region, 2012-2016
FIG. 38 Global Others (Automotive Parts, Machinery components etc) Segment Market Value (US$ Mn) By Region, 2017-2022
FIG. 39 Global Others (Automotive Parts, Machinery components etc) Segment Y-o-Y Growth Rate, By Region, 2015-2022
FIG. 40 Global Primary Packaging Segment Market Value (US$ Mn) By Region, 2012-2016
FIG. 41 Global Primary Packaging Segment Market Value (US$ Mn) By Region, 2017-2022
FIG. 42 Global Primary Packaging Segment Y-o-Y Growth Rate, By Region, 2015-2022
FIG. 43 Global Secondary Packaging Segment Market Value (US$ Mn) By Region, 2012-2016
FIG. 44 Global Secondary Packaging Segment Market Value (US$ Mn) By Region, 2017-2022
FIG. 45 Global Secondary Packaging Segment Y-o-Y Growth Rate, By Region, 2015-2022
FIG. 46 Global Single Wall Segment Market Value (US$ Mn) By Region, 2012-2016
FIG. 47 Global Single Wall Segment Market Value (US$ Mn) By Region, 2017-2022
FIG. 48 Global Single Wall Segment Y-o-Y Growth Rate, By Region, 2015-2022
FIG. 49 Global Double Wall Segment Market Value (US$ Mn) By Region, 2012-2016
FIG. 50 Global Double Wall Segment Market Value (US$ Mn) By Region, 2017-2022
FIG. 51 Global Double Wall Segment Y-o-Y Growth Rate, By Region, 2015-2022
FIG. 52 Global Tripe Wall Segment Market Value (US$ Mn) By Region, 2012-2016
FIG. 53 Global Tripe Wall Segment Market Value (US$ Mn) By Region, 2017-2022
FIG. 54 Global Tripe Wall Segment Y-o-Y Growth Rate, By Region, 2015-2022
FIG. 55 North America Corrugated Boxes Market Value (US$ Mn), By Material Source2012-2016
FIG. 56 North America Corrugated Boxes Market Value (US$ Mn), By Material Source2017-2022
FIG. 57 North America Corrugated Boxes Market Value (US$ Mn), By End User Industry2012-2016
FIG. 58 North America Corrugated Boxes Market Value (US$ Mn), By End User Industry2017-2022
FIG. 59 North America Corrugated Boxes Market Value (US$ Mn), By Packaging Form2012-2016
FIG. 60 North America Corrugated Boxes Market Value (US$ Mn), By Packaging Form2017-2022
FIG. 61 North America Corrugated Boxes Market Value (US$ Mn), By Board Type2012-2016
FIG. 62 North America Corrugated Boxes Market Value (US$ Mn), By Board Type2017-2022
FIG. 63 Latin America Corrugated Boxes Market Value (US$ Mn), By Material Source2012-2016
FIG. 64 Latin America Corrugated Boxes Market Value (US$ Mn), By Material Source2017-2022
FIG. 65 Latin America Corrugated Boxes Market Value (US$ Mn), By End User Industry2012-2016
FIG. 66 Latin America Corrugated Boxes Market Value (US$ Mn), By End User Industry2017-2022
FIG. 67 Latin America Corrugated Boxes Market Value (US$ Mn), By Packaging Form2012-2016
FIG. 68 Latin America Corrugated Boxes Market Value (US$ Mn), By Packaging Form2017-2022
FIG. 69 Latin America Corrugated Boxes Market Value (US$ Mn), By Board Type2012-2016
FIG. 70 Latin America Corrugated Boxes Market Value (US$ Mn), By Board Type2017-2022
FIG. 71 Europe Corrugated Boxes Market Value (US$ Mn), By Material Source2012-2016
FIG. 72 Europe Corrugated Boxes Market Value (US$ Mn), By Material Source2017-2022
FIG. 73 Europe Corrugated Boxes Market Value (US$ Mn), By End User Industry2012-2016
FIG. 74 Europe Corrugated Boxes Market Value (US$ Mn), By End User Industry2017-2022
FIG. 75 Europe Corrugated Boxes Market Value (US$ Mn), By Packaging Form2012-2016
FIG. 76 Europe Corrugated Boxes Market Value (US$ Mn), By Packaging Form2017-2022
FIG. 77 Europe Corrugated Boxes Market Value (US$ Mn), By Board Type2012-2016
FIG. 78 Europe Corrugated Boxes Market Value (US$ Mn), By Board Type2017-2022
FIG. 79 Japan Corrugated Boxes Market Value (US$ Mn), By Material Source2012-2016
FIG. 80 Japan Corrugated Boxes Market Value (US$ Mn), By Material Source2017-2022
FIG. 81 Japan Corrugated Boxes Market Value (US$ Mn), By End User Industry2012-2016
FIG. 82 Japan Corrugated Boxes Market Value (US$ Mn), By End User Industry2017-2022
FIG. 83 Japan Corrugated Boxes Market Value (US$ Mn), By Packaging Form2012-2016
FIG. 84 Japan Corrugated Boxes Market Value (US$ Mn), By Packaging Form2017-2022
FIG. 85 Japan Corrugated Boxes Market Value (US$ Mn), By Board Type2012-2016
FIG. 86 Japan Corrugated Boxes Market Value (US$ Mn), By Board Type2017-2022
FIG. 87 APEJ Corrugated Boxes Market Value (US$ Mn), By Material Source2012-2016
FIG. 88 APEJ Corrugated Boxes Market Value (US$ Mn), By Material Source2017-2022
FIG. 89 APEJ Corrugated Boxes Market Value (US$ Mn), By End User Industry2012-2016
FIG. 90 APEJ Corrugated Boxes Market Value (US$ Mn), By End User Industry2017-2022
FIG. 91 APEJ Corrugated Boxes Market Value (US$ Mn), By Packaging Form2012-2016
FIG. 92 APEJ Corrugated Boxes Market Value (US$ Mn), By Packaging Form2017-2022
FIG. 93 APEJ Corrugated Boxes Market Value (US$ Mn), By Board Type2012-2016
FIG. 94 APEJ Corrugated Boxes Market Value (US$ Mn), By Board Type2017-2022
FIG. 95 MEA Corrugated Boxes Market Value (US$ Mn), By Material Source2012-2016
FIG. 96 MEA Corrugated Boxes Market Value (US$ Mn), By Material Source2017-2022
FIG. 97 MEA Corrugated Boxes Market Value (US$ Mn), By End User Industry2012-2016
FIG. 98 MEA Corrugated Boxes Market Value (US$ Mn), By End User Industry2017-2022
FIG. 99 MEA Corrugated Boxes Market Value (US$ Mn), By Packaging Form2012-2016
FIG. 100 MEA Corrugated Boxes Market Value (US$ Mn), By Packaging Form2017-2022
FIG. 101 MEA Corrugated Boxes Market Value (US$ Mn), By Board Type2012-2016
FIG. 102 MEA Corrugated Boxes Market Value (US$ Mn), By Board Type2017-2022
Copyright © Transparency Market Research, Inc. All Rights reserved
Trust Online


Corrugated Boxes Market Growth Analysis Report