
Aluminum Powders, Pastes, and Flakes Market – Snapshot
Aluminum is one of the most abundant metals found in the Earth’s crust. It accounts for nearly 8% (by weight) of the Earth’s crust. Aluminum is the most widely used mental across the globe due to its wide availability and numerous properties. Aluminum powder is manufactured by feeding pure molten aluminum metal to a compressed gas jet and converting it to fine droplets. These droplets are solidified and collected. Powders collected through this process are graded, depending on their size and specification for various application. Aluminum powder is extensively used in a wide variety of applications such as aerospace & defense, industrial, automotive, and construction. Aluminum flakes and flake pigments are produced by dry ball milling of atomized aluminum under inert atmosphere or removal of solvent from wet-milled atomized aluminum under controlled conditions. Aluminum paste is made by ball milling of aluminum foil or aluminum powder in white solvents in the presence of a lubricant. Aluminum paste is extensively used by anti-corrosion paints, roof coatings, printing inks.
Increasing Demand for Aluminum, Powders, Pastes, and Flakes in Automotive Sector to Drive Market
Aluminum powder, paste & flakes are widely used in automotive paints & coatings. These are employed in the formulation of automotive coatings, as they enhance the esthetic properties. Smoother surface, lenticular shape of particles, and narrow distribution of particles ensure superior metallic finish in automotive coatings. Major applications of aluminum powder, paste, and flakes in the automotive industry includes automotive OEM, automotive interior coatings, wheel coatings, automotive parts and accessories, and automotive refinishes. Aluminum powder, paste, and flakes help improve various optical properties of automotive coatings such as tinting strength, brightness, gloss, and luster. These pigments increase resistance to degradation and improve the esthetic appeal. Additionally, specially developed grades of aluminum powder, paste, and flakes protect automotive components from damage caused by OEM recirculation. The global automotive industry has been expanding significantly over the last few years. Automotive production has been significantly increasing in developing countries such as China, India, and Brazil in the last few years. Rise in foreign investment in emerging economies has boosted the automotive industry. Major automotive manufacturers are focusing on strengthening their presence in BRIC countries. This, in turn, is propelling the demand for aluminum powder, paste, and flakes in the automotive industry in these countries.
Leading Players Focusing on Geographical Expansion
Key players profiled in the aluminum powders, pastes, and flakes market include United Company RUSAL Limited, Alcoa Corporation, Kymera International, The Metal Powder Company Ltd., Toyo Aluminium K.K., Aluminium Bahrain (Alba), United States Metal Powders, Inc., Silberline Manufacturing Co., Inc., Transmet Corporation, Valimet, Inc, Arasan Aluminium Industries (P) Ltd, and Carlfors Bruk AB. These players engage in collaborations, mergers & acquisitions (M&A), geographical expansion, and launch of new products. In September 24, 2015, Alcoa Corporation completed the expansion at its Tennessee, in the U.S. facility to cater to the demand for aluminum sheets from the automotive industry. The plant would provide aluminum sheets to automakers such as Ford Motor Company, Fiat Chrysler Automobiles, and General Motors.
Powders Segment to Dominate the Aluminum Powders, Pastes, and Flakes Market
In terms of type, the global aluminum powders, pastes, and flakes market has been segmented into powders, pastes and flakes. The powder segment accounted for a dominant share in the aluminum powders, pastes, and flakes market. Aluminum powder is a fine-granular powder of aluminum. Its color varies from silvery-white to gray. It is an odorless powder. Aluminum powder is a highly reactive and flammable material. Aluminum powder is manufactured in several forms such as flake-like particles and granular powder. Aluminum powder is used in paints, protective coatings, pigments, printing inks, rocket fuels, explosives, ceramics, and abrasives. The aluminum paste segment is anticipated to expand at a significant pace during the forecast period owing to the increase in demand for these pastes in paints, coatings, and inks applications.
Demand for Aluminum Powders, Pastes, and Flakes to Increase in Industrial Applications
Based on application, the aluminum powders, pastes, and flakes market has been divided into industrial, automotive, chemical, construction, blasting & explosives, and aerospace & defense. The industrial segment accounted for a major share of the aluminum powders, pastes, and flakes market. Industrial applications employ aluminum flakes, powders, and pastes for purposes such as coating systems for corrosion protection, primer/ship paints, roof coatings, coil/can coatings, and UV coatings. The aluminum coating protects the surface from moisture and environmental effects. Aluminum paste, especially leafing aluminum paste, is employed for roof coatings to protect the roof from moisture and corrosion. It also reflects UV rays thereby, providing protection from photochemical degradation. The aerospace & defense application segment is anticipated to expand at a significant pace during the forecast period owing to increasing number of aircraft deliveries across the globe.
Developing Economies to Present Lucrative Opportunities
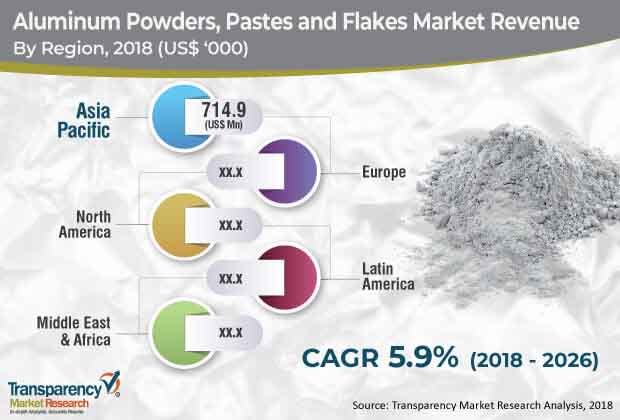
In terms of volume, Asia Pacific and Europe are leading regions of the global aluminum powders, pastes, and flakes market. In terms of value, the market in Asia Pacific is projected to expand at a substantial pace during the forecast period. The market in North America is estimated to expand considerably during the forecast period owing to the rise in the industrialization and increase in demand for these materials for making printing ink varnishes and protective coatings for applications in industries such as construction and automotive in the region. The market in India, ASEAN, Japan, and China is anticipated to expand at a substantial pace in the next few years due to the rise in demand for aluminum powders, pastes, and flakes in various applications such as automotive, construction, chemicals, and industrial.
|
Type |
|
|
Application |
|
|
Region |
|
1. Preface
1.1. Market Definition and Scope
1.2. Market Segmentation
1.3. Research Highlights
1.4. Key Research Objectives
2. Assumptions and Research Methodology
3. Executive Summary: Global Aluminum Powders, Pastes, and Flakes Market
4. Market Overview
4.1. Introduction
4.2. Product Definition
4.3. Market Indicators
4.4. Market Dynamics
4.4.1. Drivers
4.4.2. Restraints
4.4.3. Opportunities
4.5. Porter’s Five Forces Analysis
4.6. Value Chain Analysis
4.7. Cost/Margin Analysis, by Region
5. Manufacturing Cost Analysis
6. Global Aluminum Powders, Pastes, and Flakes Market Analysis and Forecast, by Type
6.1. Global Aluminum Powders, Pastes, and Flakes Market Volume (Tons) and Value (US$ Thousands), by Type, 2013–2026
6.1.1. Powders
6.1.2. Pastes
6.1.3. Flakes
6.2. Global Aluminum Powders, Pastes, and Flakes Market Attractiveness Analysis, by Type
7. Global Aluminum Powders, Pastes, and Flakes Market Analysis and Forecast, by Application
7.1. Global Aluminum Powders, Pastes, and Flakes Market Volume (Tons) and Value (US$ Thousands), by Application, 2013–2026
7.1.1. Industrial
7.1.2. Automotive
7.1.3. Chemicals
7.1.4. Construction
7.1.5. Blasting & Explosives
7.1.6. Aerospace & Defense
7.2. Global Aluminum Powders, Pastes, and Flakes Market Attractiveness Analysis, by Application
8. Global Aluminum Powders, Pastes, and Flakes Market Analysis and Forecast, by Region, 2013–2026
8.1. Global Aluminum Powder, Paste, and Flakes Market, Capacity, Production, Consumption, Revenue, Import, and Export by Region
8.2. Global Aluminum Powder, Paste and Flakes Market Production, Import, Export Analysis (2013–2017)
8.3. Global Aluminum, Powders, Pastes, and Flakes Market Capacity, Production, Price Trend Analysis (2013–2017)
8.4. Global Aluminum Powders, Pastes, and Flakes Market Volume (Tons) and Value (US$ Thousands) Forecast, by Region, 2013–2026
8.4.1. North America
8.4.2. Europe
8.4.3. Asia Pacific
8.4.4. Latin America
8.4.5. Middle East & Africa
9. North America Aluminum Powders, Pastes, and Flakes Market Analysis and Forecast
9.1. North America Aluminum Powders, Pastes, and Flakes Market Overview
9.2. North America Aluminum Powders, Pastes, and Flakes Market Analysis and Forecast, by Type
9.3. North America Aluminum Powders, Pastes, and Flakes Market Volume (Tons) and Value (US$ Thousands), by Type, 2013–2026
9.3.1. Powders
9.3.2. Pastes
9.3.3. Flakes
9.4. North America Aluminum Powders, Pastes, and Flakes Market Volume (Tons) and Value (US$ Thousands), by Application, 2013–2026
9.4.1. Industrial
9.4.2. Automotive
9.4.3. Chemicals
9.4.4. Construction
9.4.5. Blasting & Explosives
9.4.6. Aerospace & Defense
9.5. North America Aluminum, Powders, Pastes, and Flakes Market Production, Import, Export Analysis (2013–2017)
9.6. North America Aluminum, Powders, Pastes, and Flakes Market Capacity, Production, Price Trend Analysis (2013–2017)
9.7. North America Aluminum Powders, Pastes, and Flakes Market Volume (Tons) and Value (US$ Thousands), by Country, 2013–2026
9.7.1. U.S.
9.7.2. Canada
9.8. U.S. Aluminum Powders, Pastes, and Flakes Market Volume (Tons) and Value (US$ Thousands), by Type, 2013–2026
9.8.1. Powders
9.8.2. Pastes
9.8.3. Flakes
9.9. U.S. Aluminum Powders, Pastes, and Flakes Market Volume (Tons) and Value (US$ Thousands), by Application, 2013–2026
9.9.1. Industrial
9.9.2. Automotive
9.9.3. Chemicals
9.9.4. Construction
9.9.5. Blasting & Explosives
9.9.6. Aerospace & Defense
9.10. Canada Aluminum Powders, Pastes, and Flakes Market Volume (Tons) and Value (US$ Thousands), by Type, 2013–2026
9.10.1. Powders
9.10.2. Pastes
9.10.3. Flakes
9.11. Canada Aluminum Powders, Pastes, and Flakes Market Volume (Tons) and Value (US$ Thousands), by Application, 2013–2026
9.11.1. Industrial
9.11.2. Automotive
9.11.3. Chemicals
9.11.4. Construction
9.11.5. Blasting & Explosives
9.11.6. Aerospace & Defense
10. Europe Aluminum Powders, Pastes, and Flakes Market Analysis and Forecast
10.1. Europe Aluminum Powders, Pastes, and Flakes Market Overview
10.2. Europe Aluminum Powders, Pastes, and Flakes Market Volume (Tons) and Value (US$ Thousands), by Type, 2013–2026
10.2.1. Powders
10.2.2. Pastes
10.2.3. Flakes
10.3. Europe Aluminum Powders, Pastes, and Flakes Market Volume (Tons) and Value (US$ Thousands), by Application, 2013–2026
10.3.1. Industrial
10.3.2. Automotive
10.3.3. Chemicals
10.3.4. Construction
10.3.5. Blasting & Explosives
10.3.6. Aerospace & Defense
10.4. Europe Aluminum, Powders, Pastes, and Flakes Market Production, Import, Export Analysis (2013–2017)
10.5. Europe Aluminum, Powders, Pastes, and Flakes Market Capacity, Production, Price Trend Analysis (2013–2017)
10.6. Europe Aluminum Powders, Pastes, and Flakes Market Volume (Tons) and Value (US$ Thousands), by Country and Sub-region, 2017–2026
10.6.1. Germany
10.6.2. U.K.
10.6.3. France
10.6.4. Italy
10.6.5. Spain
10.6.6. Russia & CIS
10.6.7. Rest of Europe
10.7. Germany Aluminum Powders, Pastes, and Flakes Market Volume (Tons) and Value (US$ Thousands), by Type, 2013–2026
10.7.1. Powders
10.7.2. Pastes
10.7.3. Flakes
10.8. Germany Aluminum Powders, Pastes, and Flakes Market Volume (Tons) and Value (US$ Thousands), by Application, 2017–2026
10.8.1. Industrial
10.8.2. Automotive
10.8.3. Chemicals
10.8.4. Construction
10.8.5. Blasting & Explosives
10.8.6. Aerospace & Defense
10.9. U.K. Aluminum Powders, Pastes, and Flakes Market Volume (Tons) and Value (US$ Thousands), by Type, 2013–2026
10.9.1. Powders
10.9.2. Pastes
10.9.3. Flakes
10.10. U.K. Aluminum Powders, Pastes, and Flakes Market Volume (Tons) and Value (US$ Thousands), by Application, 2017–2026
10.10.1. Industrial
10.10.2. Automotive
10.10.3. Chemicals
10.10.4. Construction
10.10.5. Blasting & Explosives
10.10.6. Aerospace & Defense
10.11. France Aluminum Powders, Pastes, and Flakes Market Volume (Tons) and Value (US$ Thousands), by Type, 2013–2026
10.11.1. Powders
10.11.2. Pastes
10.11.3. Flakes
10.12. France Aluminum Powders, Pastes, and Flakes Market Volume (Tons) and Value (US$ Thousands), by Application, 2017–2026
10.12.1. Industrial
10.12.2. Automotive
10.12.3. Chemicals
10.12.4. Construction
10.12.5. Blasting & Explosives
10.12.6. Aerospace & Defense
10.13. Italy Aluminum Powders, Pastes, and Flakes Market Volume (Tons) and Value (US$ Thousands), by Type, 2013–2026
10.13.1. Powders
10.13.2. Pastes
10.13.3. Flakes
10.14. Italy Aluminum Powders, Pastes, and Flakes Market Volume (Tons) and Value (US$ Thousands), by Application, 2017–2026
10.14.1. Industrial
10.14.2. Automotive
10.14.3. Chemicals
10.14.4. Construction
10.14.5. Blasting & Explosives
10.14.6. Aerospace & Defense
10.15. Spain Aluminum Powders, Pastes, and Flakes Market Volume (Tons) and Value (US$ Thousands), by Type, 2013–2026
10.15.1. Powders
10.15.2. Pastes
10.15.3. Flakes
10.16. Spain Aluminum Powders, Pastes, and Flakes Market Volume (Tons) and Value (US$ Thousands), by Application, 2017–2026
10.16.1. Industrial
10.16.2. Automotive
10.16.3. Chemicals
10.16.4. Construction
10.16.5. Blasting & Explosives
10.16.6. Aerospace & Defense
10.17. Russia & CIS Aluminum Powders, Pastes, and Flakes Market Volume (Tons) and Value (US$ Thousands), by Type, 2013–2026
10.17.1. Powders
10.17.2. Pastes
10.17.3. Flakes
10.18. Russia & CIS Aluminum Powders, Pastes, and Flakes Market Volume (Tons) and Value (US$ Thousands), by Application, 2017–2026
10.18.1. Industrial
10.18.2. Automotive
10.18.3. Chemicals
10.18.4. Construction
10.18.5. Blasting & Explosives
10.18.6. Aerospace & Defense
10.19. Rest of Europe Aluminum Powders, Pastes, and Flakes Market Volume (Tons) and Value (US$ Thousands), by Type, 2013–2026
10.19.1. Powders
10.19.2. Pastes
10.19.3. Flakes
10.20. Rest of Europe Aluminum Powders, Pastes, and Flakes Market Volume (Tons) and Value (US$ Thousands), by Application, 2017–2026
10.20.1. Industrial
10.20.2. Automotive
10.20.3. Chemicals
10.20.4. Construction
10.20.5. Blasting & Explosives
10.20.6. Aerospace & Defense
11. Asia Pacific Aluminum Powders, Pastes, and Flakes Market Analysis and Forecast
11.1. Asia Pacific Aluminum Powders, Pastes, and Flakes Market Overview
11.2. Asia Pacific Aluminum Powders, Pastes, and Flakes Market Volume (Tons) and Value (US$ Thousands), by Type, 2013–2026
11.2.1. Powders
11.2.2. Pastes
11.2.3. Flakes
11.3. Asia Pacific Aluminum Powders, Pastes, and Flakes Market Volume (Tons) and Value (US$ Thousands), by Application, 2017–2026
11.3.1. Industrial
11.3.2. Automotive
11.3.3. Chemicals
11.3.4. Construction
11.3.5. Blasting & Explosives
11.3.6. Aerospace & Defense
11.4. Asia Pacific Aluminum Powders, Pastes, and Flakes Market Volume (Tons) and Value (US$ Thousands), by Country and Sub-region, 2013–2026
11.4.1. China
11.4.2. Japan
11.4.3. India
11.4.4. ASEAN
11.4.5. Rest of Asia Pacific
11.5. China Aluminum Powders, Pastes, and Flakes Market Volume (Tons) and Value (US$ Thousands), by Type, 2013–2026
11.5.1. Powders
11.5.2. Pastes
11.5.3. Flakes
11.6. China Aluminum Powders, Pastes, and Flakes Market Volume (Tons) and Value (US$ Thousands), by Application, 2013–2026
11.6.1. Industrial
11.6.2. Automotive
11.6.3. Chemicals
11.6.4. Construction
11.6.5. Blasting & Explosives
11.6.6. Aerospace & Defense
11.7. China Aluminum, Powders, Pastes, and Flakes Market Production, Import, Export Analysis (2013–2017)
11.8. China Aluminum, Powders, Pastes, and Flakes Market Capacity, Production, Price Trend Analysis (2013–2017)
11.9. Japan Aluminum Powders, Pastes, and Flakes Market Volume (Tons) and Value (US$ Thousands), by Type, 2013–2026
11.9.1. Powders
11.9.2. Pastes
11.9.3. Flakes
11.10. Japan Aluminum Powders, Pastes, and Flakes Market Volume (Tons) and Value (US$ Thousands), by Application, 2013–2026
11.10.1. Industrial
11.10.2. Automotive
11.10.3. Chemicals
11.10.4. Construction
11.10.5. Blasting & Explosives
11.10.6. Aerospace & Defense
11.11. Japan Aluminum, Powders, Pastes, and Flakes Market Production, Import, Export Analysis (2013–2017)
11.12. Japan Aluminum, Powders, Pastes, and Flakes Market Capacity, Production, Price Trend Analysis (2013–2017)
11.13. India Aluminum Powders, Pastes, and Flakes Market Volume (Tons) and Value (US$ Thousands), by Type, 2013–2026
11.13.1. Powders
11.13.2. Pastes
11.13.3. Flakes
11.14. India Aluminum Powders, Pastes, and Flakes Market Volume (Tons) and Value (US$ Thousands), by Application, 2013–2026
11.14.1. Industrial
11.14.2. Automotive
11.14.3. Chemicals
11.14.4. Construction
11.14.5. Blasting & Explosives
11.14.6. Aerospace & Defense
11.15. India Aluminum, Powders, Pastes, and Flakes Market Production, Import, Export Analysis (2013–2017)
11.16. India Aluminum, Powders, Pastes, and Flakes Market Capacity, Production, Price Trend Analysis (2013–2017)
11.17. ASEAN Aluminum Powders, Pastes, and Flakes Market Volume (Tons) and Value (US$ Thousands), by Type, 2013–2026
11.17.1. Powders
11.17.2. Pastes
11.17.3. Flakes
11.18. ASEAN Aluminum Powders, Pastes, and Flakes Market Volume (Tons) and Value (US$ Thousands), by Application, 2013–2026
11.18.1. Industrial
11.18.2. Automotive
11.18.3. Chemicals
11.18.4. Construction
11.18.5. Blasting & Explosives
11.18.6. Aerospace & Defense
11.19. ASEAN Aluminum, Powders, Pastes, and Flakes Market Production, Import, Export Analysis (2013–2017)
11.20. ASEAN Aluminum, Powders, Pastes, and Flakes Market Capacity, Production, Price Trend Analysis (2013–2017)
11.21. Rest of Asia Pacific Aluminum Powders, Pastes, and Flakes Market Volume (Tons) and Value (US$ Thousands), by Type, 2013–2026
11.21.1. Powders
11.21.2. Pastes
11.21.3. Flakes
11.22. Rest of Asia Pacific Aluminum Powders, Pastes, and Flakes Market Volume (Tons) and Value (US$ Thousands), by Application, 2013–2026
11.22.1. Industrial
11.22.2. Automotive
11.22.3. Chemicals
11.22.4. Construction
11.22.5. Blasting & Explosives
11.22.6. Aerospace & Defense
12. Latin America Aluminum Powders, Pastes, and Flakes Market Analysis and Forecast
12.1. Latin America Aluminum Powders, Pastes, and Flakes Market Overview
12.2. Latin America Aluminum Powders, Pastes, and Flakes Market Volume (Tons) and Value (US$ Thousands), by Type, 2013–2026
12.2.1. Powders
12.2.2. Pastes
12.2.3. Flakes
12.3. Latin America Aluminum Powders, Pastes, and Flakes Market Volume (Tons) and Value (US$ Thousands), by Application, 2013–2026
12.3.1. Industrial
12.3.2. Automotive
12.3.3. Chemicals
12.3.4. Construction
12.3.5. Blasting & Explosives
12.3.6. Aerospace & Defense
12.4. Latin America Aluminum Powders, Pastes, and Flakes Market Volume (Tons) and Value (US$ Thousands), by Country and Sub-region, 2013–2026
12.4.1. Brazil
12.4.2. Mexico
12.4.3. Rest of Latin America
12.5. Brazil Aluminum Powders, Pastes, and Flakes Market Volume (Tons) and Value (US$ Thousands), by Type, 2013–2026
12.5.1. Powders
12.5.2. Pastes
12.5.3. Flakes
12.6. Brazil Aluminum Powders, Pastes, and Flakes Market Volume (Tons) and Value (US$ Thousands), by Application, 2013–2026
12.6.1. Industrial
12.6.2. Automotive
12.6.3. Chemicals
12.6.4. Construction
12.6.5. Blasting & Explosives
12.6.6. Aerospace & Defense
12.7. Mexico Aluminum Powders, Pastes, and Flakes Market Volume (Tons) and Value (US$ Thousands), by Type, 2013–2026
12.7.1. Powders
12.7.2. Pastes
12.7.3. Flakes
12.8. Mexico Aluminum Powders, Pastes, and Flakes Market Volume (Tons) and Value (US$ Thousands), by Application, 2013–2026
12.8.1. Industrial
12.8.2. Automotive
12.8.3. Chemicals
12.8.4. Construction
12.8.5. Blasting & Explosives
12.8.6. Aerospace & Defense
12.9. Rest of Latin America Aluminum Powders, Pastes, and Flakes Market Volume (Tons) and Value (US$ Thousands), by Type, 2013–2026
12.9.1. Powders
12.9.2. Pastes
12.9.3. Flakes
12.10. Rest of Latin America Aluminum Powders, Pastes, and Flakes Market Volume (Tons) and Value (US$ Thousands), by Application, 2013–2026
12.10.1. Industrial
12.10.2. Automotive
12.10.3. Chemicals
12.10.4. Construction
12.10.5. Blasting & Explosives
12.10.6. Aerospace & Defense
13. Middle East & Africa Aluminum Powders, Pastes, and Flakes Market Analysis and Forecast
13.1. Middle East & Africa Aluminum Powders, Pastes, and Flakes Market Overview
13.2. Middle East & Africa Aluminum Powders, Pastes, and Flakes Market Volume (Tons) and Value (US$ Thousands), by Type, 2013–2026
13.2.1. Powders
13.2.2. Pastes
13.2.3. Flakes
13.3. Middle East & Africa Aluminum Powders, Pastes, and Flakes Market Volume (Tons) and Value (US$ Thousands), by Application, 2013–2026
13.3.1. Industrial
13.3.2. Automotive
13.3.3. Chemicals
13.3.4. Construction
13.3.5. Blasting & Explosives
13.3.6. Aerospace & Defense
13.4. Middle East & Africa Aluminum Powders, Pastes, and Flakes Market Volume (Tons) and Value (US$ Thousands), by Country and Sub-region, 2013–2026
13.4.1. GCC
13.4.2. South Africa
13.4.3. Rest of Middle East & Africa
13.5. GCC Aluminum Powders, Pastes, and Flakes Market Volume (Tons) and Value (US$ Thousands), by Type, 2013–2026
13.5.1. Powders
13.5.2. Pastes
13.5.3. Flakes
13.6. GCC Aluminum Powders, Pastes, and Flakes Market Volume (Tons) and Value (US$ Thousands), by Application, 2013–2026
13.6.1. Industrial
13.6.2. Automotive
13.6.3. Chemicals
13.6.4. Construction
13.6.5. Blasting & Explosives
13.6.6. Aerospace & Defense
13.7. South Africa Aluminum Powders, Pastes, and Flakes Market Volume (Tons) and Value (US$ Thousands), by Type, 2013–2026
13.7.1. Powders
13.7.2. Pastes
13.7.3. Flakes
13.8. South Africa Aluminum Powders, Pastes, and Flakes Market Volume (Tons) and Value (US$ Thousands), by Application, 2013–2026
13.8.1. Industrial
13.8.2. Automotive
13.8.3. Chemicals
13.8.4. Construction
13.8.5. Blasting & Explosives
13.8.6. Aerospace & Defense
13.9. Rest of Middle East & Africa Aluminum Powders, Pastes, and Flakes Market Volume (Tons) and Value (US$ Thousands), by Type, 2013–2026
13.9.1. Powders
13.9.2. Pastes
13.9.3. Flakes
13.10. Rest of Middle East & Africa Aluminum Powders, Pastes, and Flakes Market Volume (Tons) and Value (US$ Thousands), by Application, 2013–2026
13.10.1. Industrial
13.10.2. Automotive
13.10.3. Chemicals
13.10.4. Construction
13.10.5. Blasting & Explosives
13.10.6. Aerospace & Defense
14. Competition Landscape
14.1. Competition Matrix
14.2. Global Aluminum Powders, Pastes, and Flakes Market Share Analysis, by Company (2017)
14.3. Competitive Business Strategies
14.4. Company Profiles
14.4.1. Alcoa Corporation
14.4.1.1. Headquarters, Year of Establishment, Revenue, Key Management, Number of Employees
14.4.1.2. Business Segments
14.4.1.3. Products
14.4.1.4. Revenue (US$ Mn) and Y-o-Y Growth (%), 2015–2017
14.4.1.5. Strategic Overview
14.4.2. AMG Advanced Metallurgical Group N.V.
14.4.2.1. Headquarters, Year of Establishment, Revenue, Key Management, Number of Employees
14.4.2.2. Business Segments
14.4.2.3. Products
14.4.2.4. Revenue (US$ Mn) and Y-o-Y Growth (%), 2015–2017
14.4.2.5. Strategic Overview
14.4.3. Aluminium Bahrain (Alba)
14.4.3.1. Headquarters, Year of Establishment, Revenue, Key Management, Number of Employees
14.4.3.2. Business Segments
14.4.3.3. Products
14.4.3.4. Revenue (US$ Mn) and Y-o-Y Growth (%), 2015–2017
14.4.3.5. Strategic Overview
14.4.4. United Company RUSAL Limited
14.4.4.1. Headquarters, Year of Establishment, Revenue, Key Management, Number of Employees
14.4.4.2. Business Segments
14.4.4.3. Products
14.4.4.4. Revenue (US$ Mn) and Y-o-Y Growth (%), 2015–2017
14.4.4.5. Strategic Overview
14.4.5. MMP INDUSTRIES LIMITED
14.4.5.1. Headquarters, Year of Establishment, Revenue, Key Management, Number of Employees
14.4.5.2. Business Segments
14.4.5.3. Products
14.4.5.4. Revenue (US$ Mn) and Y-o-Y Growth (%), 2015–2017
14.4.5.5. Strategic Overview
14.4.6. United States Metal Powders, Inc.
14.4.6.1. Headquarters, Year of Establishment, Revenue, Key Management, Number of Employees
14.4.6.2. Business Segments
14.4.6.3. Products
14.4.7. Carlfors Bruk AB
14.4.7.1. Headquarters, Year of Establishment, Revenue, Key Management, Number of Employees
14.4.7.2. Business Segments
14.4.7.3. Products
14.4.8. Silberline Manufacturing Co., Inc.
14.4.8.1. Headquarters, Year of Establishment, Revenue, Key Management, Number of Employees
14.4.8.2. Business Segments
14.4.8.3. Products
14.4.8.4. Strategic Overview
14.4.9. Transmet Corporation
14.4.9.1. Headquarters, Year of Establishment, Revenue, Key Management, Number of Employees
14.4.9.2. Business Segment
14.4.9.3. Products
14.4.10. Valimet, Inc.
14.4.10.1. Headquarters, Year of Establishment, Revenue, Key Management, Number of Employees
14.4.10.2. Business Segment
14.4.10.3. Products
14.4.11. THE METAL POWDER COMPANY LIMITED.
14.4.11.1. Headquarters, Year of Establishment, Revenue, Key Management, Number of Employees
14.4.11.2. Business Segment
14.4.11.3. Products
14.4.12. Kymera International
14.4.12.1. Headquarters, Year of Establishment, Revenue, Key Management, Number of Employees
14.4.12.2. Business Segment
14.4.12.3. Products
14.4.13. Arasan Aluminium Industries (P) Ltd
14.4.13.1. Headquarters, Year of Establishment, Revenue, Key Management, Number of Employees
14.4.13.2. Business Segment
14.4.13.3. Products
15. Primary Insights
List of Tables
Table 01 Global Aluminum, Powders, Pastes, and Flakes Market Volume (Tons) Forecast, by Type, 2013–2026
Table 02 Global Aluminum, Powders, Pastes, and Flakes Market Size (US$ Thousand) Forecast, by Type, 2013–2026
Table 03 Global Aluminum, Powders, Pastes, and Flakes Market Volume (Tons) Forecast, by Application, 2013–2026
Table 04 Global Aluminum, Powders, Pastes, and Flakes Market Size (US$ Mn) Forecast, by Application, 2013–2026
Table 05 North America Aluminum, Powders, Pastes, and Flakes Market Volume (Tons) Forecast, by Type, 2013–2026
Table 06 North America Aluminum, Powders, Pastes, and Flakes Market Size (US$ Thousand) Forecast, by Type, 2013–2026
Table 07 North America Aluminum, Powders, Pastes, and Flakes Market Volume (Tons) Forecast, by Application, 2013–2026
Table 08 North America Aluminum, Powders, Pastes, and Flakes Market Size (US$ Thousand) Forecast, by Application, 2013–2026
Table 09 North America Aluminum, Powders, Pastes, and Flakes Market Volume (Tons) Forecast, by Country, 2013–2026
Table 10 North America Aluminum, Powders, Pastes, and Flakes Market Size (US$ Thousand) Forecast, by Country, 2013–2026
Table 11 U.S. Aluminum, Powders, Pastes, and Flakes Market Volume (Tons) Forecast, by Type, 2013–2026
Table 12 U.S. Aluminum, Powders, Pastes, and Flakes Market Size (US$ Thousand) Forecast, by Type, 2013–2026
Table 13 U.S. Aluminum, Powders, Pastes, and Flakes Market Volume (Tons) Forecast, by Application, 2013–2026
Table 14 U.S. Aluminum, Powders, Pastes, and Flakes Market Size (US$ Thousand) Forecast, by Application, 2013–2026
Table 15 Canada Aluminum, Powders, Pastes, and Flakes Market Volume (Tons) Forecast, by Type, 2013–2026
Table 16 Canada Aluminum, Powders, Pastes, and Flakes Market Size (US$ Thousand) Forecast, by Type, 2013–2026
Table 17 Canada Aluminum, Powders, Pastes, and Flakes Market Volume (Tons) Forecast, by Application, 2013–2026
Table 18 Canada Aluminum, Powders, Pastes, and Flakes Market Size (US$ Thousand) Forecast, by Application, 2013–2026
Table 19 Europe Aluminum, Powders, Pastes, and Flakes Market Volume (Tons) Forecast, by Type, 2013–2026
Table 20 Europe Aluminum, Powders, Pastes, and Flakes Market Size (US$ Thousand) Forecast, by Type, 2013–2026
Table 21 Europe Aluminum, Powders, Pastes, and Flakes Market Volume (Tons) Forecast, by Application, 2013–2026
Table 22 Europe Aluminum, Powders, Pastes, and Flakes Market Size (US$ Thousand) Forecast, by Application, 2013–2026
Table 23 Europe Aluminum, Powders, Pastes, and Flakes Market Volume (Tons) Forecast, by Country and Sub-region, 2013–2026
Table 24 Europe Aluminum, Powders, Pastes, and Flakes Market Size (US$ Thousand) Forecast, by Country and Sub-region, 2013–2026
Table 25 Germany Aluminum, Powders, Pastes, and Flakes Market Volume (Tons) Forecast, by Type, 2013–2026
Table 26 Germany Aluminum, Powders, Pastes, and Flakes Market Size (US$ Thousand) Forecast, by Type, 2013–2026
Table 27 Germany Aluminum, Powders, Pastes, and Flakes Market Volume (Tons) Forecast, by Application, 2013–2026
Table 28 Germany Aluminum, Powders, Pastes, and Flakes Market Size (US$ Thousand) Forecast, by Application, 2013–2026
Table 29 U.K. Aluminum, Powders, Pastes, and Flakes Market Volume (Tons) Forecast, by Type, 2013–2026
Table 30 U.K. Aluminum, Powders, Pastes, and Flakes Market Size (US$ Thousand) Forecast, by Type, 2013–2026
Table 31 U.K. Aluminum, Powders, Pastes, and Flakes Market Volume (Tons) Forecast, by Application, 2013–2026
Table 32 U.K. Aluminum, Powders, Pastes, and Flakes Market Size (US$ Thousand) Forecast, by Application, 2013–2026
Table 33 France Aluminum, Powders, Pastes, and Flakes Market Volume (Tons) Forecast, by Type, 2013–2026
Table 34 France Aluminum, Powders, Pastes, and Flakes Market Size (US$ Thousand) Forecast, by Type, 2013–2026
Table 35 France Aluminum, Powders, Pastes, and Flakes Market Volume (Tons) Forecast, by Application, 2013–2026
Table 36 France Aluminum, Powders, Pastes, and Flakes Market Size (US$ Thousand) Forecast, by Application, 2013–2026
Table 37 Italy Aluminum, Powders, Pastes, and Flakes Market Volume (Tons) Forecast, by Type, 2013–2026
Table 38 Italy Aluminum, Powders, Pastes, and Flakes Market Size (US$ Thousand) Forecast, by Type, 2013–2026
Table 39 Italy Aluminum, Powders, Pastes, and Flakes Market Volume (Tons) Forecast, by Application, 2013–2026
Table 40 Italy Aluminum, Powders, Pastes, and Flakes Market Size (US$ Thousand) Forecast, by Application, 2013–2026
Table 41 Spain Aluminum, Powders, Pastes, and Flakes Market Volume (Tons) Forecast, by Type, 2013–2026
Table 42 Spain Aluminum, Powders, Pastes, and Flakes Market Size (US$ Thousand) Forecast, by Type, 2013–2026
Table 43 Spain Aluminum, Powders, Pastes, and Flakes Market Volume (Tons) Forecast, by Application, 2013–2026
Table 44 Spain Aluminum, Powders, Pastes, and Flakes Market Size (US$ Thousand) Forecast, by Application, 2013–2026
Table 45 Russia & CIS Aluminum, Powders, Pastes, and Flakes Market Volume (Tons) Forecast, by Type, 2013–2026
Table 46 Russia & CIS Aluminum, Powders, Pastes, and Flakes Market Size (US$ Thousand) Forecast, by Type, 2013–2026
Table 47 Russia & CIS Aluminum, Powders, Pastes, and Flakes Market Volume (Tons) Forecast, by Application, 2013–2026
Table 48 Russia & CIS Aluminum, Powders, Pastes, and Flakes Market Size (US$ Thousand) Forecast, by Application, 2013–2026
Table 49 Rest of Europe Aluminum, Powders, Pastes, and Flakes Market Volume (Tons) Forecast, by Type, 2013–2026
Table 50 Rest of Europe Aluminum, Powders, Pastes, and Flakes Market Size (US$ Thousand) Forecast, by Type, 2013–2026
Table 51 Rest of Europe Aluminum, Powders, Pastes, and Flakes Market Volume (Tons) Forecast, by Application, 2013–2026
Table 52 Rest of Europe Aluminum, Powders, Pastes, and Flakes Market Size (US$ Thousand) Forecast, by Application, 2013–2026
Table 53 Asia Pacific Aluminum, Powders, Pastes, and Flakes Market Volume (Tons) Forecast, by Type, 2013–2026
Table 54 Asia Pacific Aluminum, Powders, Pastes, and Flakes Market Size (US$ Thousand) Forecast, by Type, 2013–2026
Table 55 Asia Pacific Aluminum, Powders, Pastes, and Flakes Market Volume (Tons) Forecast, by Application, 2013–2026
Table 56 Asia Pacific Aluminum, Powders, Pastes, and Flakes Market Size (US$ Thousand) Forecast, by Application, 2013–2026
Table 57 Asia Pacific Aluminum, Powders, Pastes, and Flakes Market Volume (Tons) Forecast, by Country and Sub-region, 2013–2026
Table 58 Asia Pacific Aluminum, Powders, Pastes, and Flakes Market Size (US$ Thousand) Forecast, by Country and Sub-region, 2013–2026
Table 59 China Aluminum, Powders, Pastes, and Flakes Market Volume (Tons) Forecast, by Type, 2013–2026
Table 60 China Aluminum, Powders, Pastes, and Flakes Market Size (US$ Thousand) Forecast, by Type, 2013–2026
Table 61 China Aluminum, Powders, Pastes, and Flakes Market Volume (Tons) Forecast, by Application, 2013–2026
Table 62 China Aluminum, Powders, Pastes, and Flakes Market Size (US$ Thousand) Forecast, by Application, 2013–2026
Table 63 Japan Aluminum, Powders, Pastes, and Flakes Market Volume (Tons) Forecast, by Type, 2013–2026
Table 64 Japan Aluminum, Powders, Pastes, and Flakes Market Size (US$ Thousand) Forecast, by Type, 2013–2026
Table 65 Japan Aluminum, Powders, Pastes, and Flakes Market Volume (Tons) Forecast, by Application, 2013–2026
Table 66 Japan Aluminum, Powders, Pastes, and Flakes Market Size (US$ Thousand) Forecast, by Application, 2013–2026
Table 67 India Aluminum, Powders, Pastes, and Flakes Market Volume (Tons) Forecast, by Type, 2013–2026
Table 68 India Aluminum, Powders, Pastes, and Flakes Market Size (US$ Thousand) Forecast, by Type, 2013–2026
Table 69 India Aluminum, Powders, Pastes, and Flakes Market Volume (Tons) Forecast, by Application, 2013–2026
Table 70 India Aluminum, Powders, Pastes, and Flakes Market Size (US$ Thousand) Forecast, by Application, 2013–2026
Table 71 ASEAN Aluminum, Powders, Pastes, and Flakes Market Volume (Tons) Forecast, by Type, 2013–2026
Table 72 ASEAN Aluminum, Powders, Pastes, and Flakes Market Size (US$ Thousand) Forecast, by Type, 2013–2026
Table 73 ASEAN Aluminum, Powders, Pastes, and Flakes Market Volume (Tons) Forecast, by Application, 2013–2026
Table 74 ASEAN Aluminum, Powders, Pastes, and Flakes Market Size (US$ Thousand) Forecast, by Application, 2013–2026
Table 75 Rest of Asia Pacific Aluminum, Powders, Pastes, and Flakes Market Volume (Tons) Forecast, by Type, 2013–2026
Table 76 Rest of Asia Pacific Aluminum, Powders, Pastes, and Flakes Market Size (US$ Thousand) Forecast, by Type, 2013–2026
Table 77 Rest of Asia Pacific Aluminum, Powders, Pastes, and Flakes Market Volume (Tons) Forecast, by Application, 2013–2026
Table 78 Rest of Asia Pacific Aluminum, Powders, Pastes, and Flakes Market Size (US$ Thousand) Forecast, by Application, 2013–2026
Table 79 Latin America Aluminum, Powders, Pastes, and Flakes Market Volume (Tons) Forecast, by Type, 2013–2026
Table 80 Latin America Aluminum, Powders, Pastes, and Flakes Market Size (US$ Thousand) Forecast, by Type, 2013–2026
Table 81 Latin America Aluminum, Powders, Pastes, and Flakes Market Volume (Tons) Forecast, by Application, 2013–2026
Table 82 Latin America Aluminum, Powders, Pastes, and Flakes Market Size (US$ Thousand) Forecast, by Application, 2013–2026
Table 83 Latin America Aluminum, Powders, Pastes, and Flakes Market Volume (Tons) Forecast, by Country and Sub-region, 2013–2026
Table 84 Latin America Aluminum, Powders, Pastes, and Flakes Market Size (US$ Thousand) Forecast, by Country and Sub-region, 2013–2026
Table 85 Brazil Aluminum, Powders, Pastes, and Flakes Market Volume (Tons) Forecast, by Type, 2013–2026
Table 86 Brazil Aluminum, Powders, Pastes, and Flakes Market Size (US$ Thousand) Forecast, by Type, 2013–2026
Table 87 Brazil Aluminum, Powders, Pastes, and Flakes Market Volume (Tons) Forecast, by Application, 2013–2026
Table 88 Brazil Aluminum, Powders, Pastes, and Flakes Market Size (US$ Thousand) Forecast, by Application, 2013–2026
Table 89 Mexico Aluminum, Powders, Pastes, and Flakes Market Volume (Tons) Forecast, by Type, 2013–2026
Table 90 Mexico Aluminum, Powders, Pastes, and Flakes Market Size (US$ Thousand) Forecast, by Type, 2013–2026
Table 91 Mexico Aluminum, Powders, Pastes, and Flakes Market Volume (Tons) Forecast, by Application, 2013–2026
Table 92 Mexico Aluminum, Powders, Pastes, and Flakes Market Size (US$ Thousand) Forecast, by Application, 2013–2026
Table 93 Rest of Latin America Aluminum, Powders, Pastes, and Flakes Market Volume (Tons) Forecast, by Type, 2013–2026
Table 94 Rest of Latin America Aluminum, Powders, Pastes, and Flakes Market Size (US$ Thousand) Forecast, by Type, 2013–2026
Table 95 Rest of Latin America Aluminum, Powders, Pastes, and Flakes Market Volume (Tons) Forecast, by Application, 2013–2026
Table 96 Rest of Latin America Aluminum, Powders, Pastes, and Flakes Market Size (US$ Thousand) Forecast, by Application, 2013–2026
Table 97 Middle East & Africa Aluminum, Powders, Pastes, and Flakes Market Volume (Tons) Forecast, by Type, 2013–2026
Table 98 Middle East & Africa Aluminum, Powders, Pastes, and Flakes Market Size (US$ Thousand) Forecast, by Type, 2013–2026
Table 99 Middle East & Africa Aluminum, Powders, Pastes, and Flakes Market Volume (Tons) Forecast, by Application, 2013–2026
Table 100 Middle East & Africa Aluminum, Powders, Pastes, and Flakes Market Size (US$ Thousand) Forecast, by Application, 2013–2026
Table 101 Middle East & Africa Aluminum, Powders, Pastes, and Flakes Market Volume (Tons) Forecast, by Country and Sub-region, 2013–2026
Table 102 Middle East & Africa Aluminum, Powders, Pastes, and Flakes Market Size (US$ Thousand) Forecast, by Country and Sub-region, 2013–2026
Table 103 GCC Aluminum, Powders, Pastes, and Flakes Market Volume (Tons) Forecast, by Type, 2013–2026
Table 104 GCC Aluminum, Powders, Pastes, and Flakes Market Size (US$ Thousand) Forecast, by Type, 2013–2026
Table 105 GCC Aluminum, Powders, Pastes, and Flakes Market Volume (Tons) Forecast, by Application, 2013–2026
Table 106 GCC Aluminum, Powders, Pastes, and Flakes Market Size (US$ Thousand) Forecast, by Application, 2013–2026
Table 107 South Africa Aluminum, Powders, Pastes, and Flakes Market Volume (Tons) Forecast, by Type, 2013–2026
Table 108 South Africa Aluminum, Powders, Pastes, and Flakes Market Size (US$ Thousand) Forecast, by Type, 2013–2026
Table 109 South Africa Aluminum, Powders, Pastes, and Flakes Market Volume (Tons) Forecast, by Application, 2013–2026
Table 110 South Africa Aluminum, Powders, Pastes, and Flakes Market Size (US$ Thousand) Forecast, by Application, 2013–2026
Table 111 Rest of Middle East & Africa Aluminum, Powders, Pastes, and Flakes Market Volume (Tons) Forecast, by Type, 2013–2026
Table 112 Rest of Middle East & Africa Aluminum, Powders, Pastes, and Flakes Market Size (US$ Thousand) Forecast, by Type, 2013–2026
Table 113 Rest of Middle East & Africa Aluminum, Powders, Pastes, and Flakes Market Volume (Tons) Forecast, by Application, 2013–2026
Table 114 Rest of Middle East & Africa Aluminum, Powders, Pastes, and Flakes Market Size (US$ Thousand) Forecast, by Application, 2013–2026
List of Figures
Figure 01 Global Aluminum Powders, Pastes & Flakes Market Snapshot, Indicative Volume (Tons) and Value (US$ Thousand), 2013–2026
Figure 02 Automotive Sales (Million Units), 2005–2015
Figure 03 Global Aluminum Powders, Pastes, and Flakes Market Volume and Y-o-Y Growth (%), Flakes & Flake Pigments, 2013–2026
Figure 04 Global Aluminum Powders, Pastes, and Flakes Market Volume and Y-o-Y Growth (%), by Powders, 2013–2026
Figure 05 Global Aluminum Powders, Pastes, and Flakes Market Volume and Y-o-Y Growth (%), by Pastes, 2013–2026
Figure 06 Global Aluminum Powders, Pastes, and Flakes Consumption, by Type, 2013
Figure 07 Global Aluminum Powders, Pastes, and Flakes Consumption, by Type, 2026
Figure 08 Global Aluminum Powders, Pastes, and Flakes Consumption Comparison, by Application (2013–2026)
Figure 09 Global Aluminum Powders, Pastes, and Flakes Market Volume and Y-o-Y Growth (%), Industrial, 2013–2026
Figure 10 Global Aluminum Powders, Pastes, and Flakes Market Volume and Y-o-Y Growth (%), by Automotive, 2013–2026
Figure 11 Global Aluminum Powders, Pastes, and Flakes Market Volume and Y-o-Y Growth (%), Chemical, 2013–2026
Figure 12 Global Aluminum Powders, Pastes, and Flakes Market Volume and Y-o-Y Growth (%), by Construction, 2013–2026
Figure 13 Global Aluminum Powders, Pastes, and Flakes Market Volume and Y-o-Y Growth (%), Explosives and Blasting, 2013–2026
Figure 14 Global Aluminum Powders, Pastes, and Flakes Market Volume and Y-o-Y Growth (%), by Defense and Aerospace, 2013–2026
Figure 15 Global Aluminum Powders, Pastes, and Flakes Consumption by Application in 2013
Figure 16 Global Aluminum Powders, Pastes, and Flakes Consumption by Application in 2026
Figure 17 Global Aluminum Powder, Paste, and Flakes Market Capacity, by Region (2013–2017)
Figure 18 Global Aluminum Powder, Paste, and Flakes Market Production, by Region (2013–2017)
Figure 19 Global Aluminum Powder, Paste, and Flakes Market Production, by Region (2013–2017)
Figure 20 Global Aluminum, Powders, Pastes, and Flakes Market Production, Analysis (2013–2017)
Figure 21 Global Aluminum, Powders, Pastes, and Flakes Market Import, Analysis (2013–2017)
Figure 22 Global Aluminum, Powders, Pastes, and Flakes Market Import, Analysis (2013–2017)
Figure 23 Global Aluminum, Powders, Pastes, and Flakes Market Capacity, Production, Comparison Analysis (2013–2017)
Figure 24 Global Aluminum, Powders, Pastes, and Flakes Market Capacity, Price Trend Analysis (2013–2017)
Figure 25 North America Aluminum Powders, Pastes and Flakes Market Value (US$ Thousand) and Volume (Tons) Forecast, 2017–2026
Figure 26 North America Aluminum Powders, Pastes and Flakes Market Attractiveness, by Country
Figure 27 North America Aluminum, Powders, Pastes, and Flakes Market Value Share, by Type, 2013 and 2026
Figure 28 North America Aluminum, Powders, Pastes, and Flakes Market Value Share, by Application, 2013 and 2026
Figure 29 North America Aluminum, Powders, Pastes, and Flakes Market Value Share, by Country, 2013 and 2026
Figure 30 North America Aluminum, Powders, Pastes, and Flakes Market Production, Analysis (2013–2017)
Figure 31 North America Aluminum, Powders, Pastes, and Flakes Market Import, Analysis (2013–2017)
Figure 32 North America Aluminum, Powders, Pastes, and Flakes Market Import, Analysis (2013–2017)
Figure 33 North America Aluminum, Powders, Pastes, and Flakes Market Capacity, Production, Comparison Analysis (2013–2017)
Figure 34 North America Aluminum, Powders, Pastes, and Flakes Market Capacity, Price Trend Analysis (2013–2017)
Figure 35 Europe Aluminum Powders, Pastes and Flakes Market Value (US$ Thousand) and Volume (Tons) Forecast, 2017–2026
Figure 36 Europe Aluminum Powders, Pastes and Flakes Market Attractiveness, by Country and Sub-region
Figure 37 Europe Aluminum, Powders, Pastes, and Flakes Market Value Share, by Type, 2013 and 2026
Figure 38 Europe Aluminum, Powders, Pastes, and Flakes Market Value Share, by Application, 2013 and 2026
Figure 39 Europe Aluminum, Powders, Pastes, and Flakes Market Value Share, by Country and Sub-region, 2013 and 2026
Figure 40 Europe Aluminum, Powders, Pastes, and Flakes Market Production, Analysis (2013–2017)
Figure 41 Europe Aluminum, Powders, Pastes, and Flakes Market Import, Analysis (2013–2017)
Figure 42 Europe Aluminum, Powders, Pastes, and Flakes Market Import, Analysis (2013–2017)
Figure 43 Europe Aluminum, Powders, Pastes, and Flakes Market Capacity, Production, Comparison Analysis (2013–2017)
Figure 44 Europe Aluminum, Powders, Pastes, and Flakes Market Capacity, Price Trend Analysis (2013–2017)
Figure 45 Asia Pacific Aluminum Powders, Pastes and Flakes Market Value (US$ Thousand) and Volume (Tons) Forecast, 2017–2026
Figure 46 Asia Pacific Aluminum Powders, Pastes and Flakes Market Attractiveness, by Country and Sub-region
Figure 47 Asia Pacific Aluminum, Powders, Pastes, and Flakes Market Value Share, by Type, 2013 and 2026
Figure 48 Asia Pacific Aluminum, Powders, Pastes, and Flakes Market Value Share, by Application, 2013 and 2026
Figure 49 Asia Pacific Aluminum, Powders, Pastes, and Flakes Market Value Share, by Country and Sub-region, 2013 and 2026
Figure 50 China Aluminum, Powders, Pastes, and Flakes Market Production, Analysis (2013–2017)
Figure 51 China Aluminum, Powders, Pastes, and Flakes Market Import, Analysis (2013–2017)
Figure 52 China Aluminum, Powders, Pastes, and Flakes Market Import, Analysis (2013–2017)
Figure 53 China Aluminum, Powders, Pastes, and Flakes Market Capacity, Production, Comparison Analysis (2013–2017)
Figure 54 China Aluminum, Powders, Pastes, and Flakes Market Capacity, Price Trend Analysis (2013–2017)
Figure 55 Japan Aluminum, Powders, Pastes, and Flakes Market Production, Analysis (2013–2017)
Figure 56 Japan Aluminum, Powders, Pastes, and Flakes Market Import, Analysis (2013–2017)
Figure 57 Japan Aluminum, Powders, Pastes, and Flakes Market Import, Analysis (2013–2017)
Figure 58 Japan Aluminum, Powders, Pastes, and Flakes Market Capacity, Production, Comparison Analysis (2013–2017)
Figure 59 Japan Aluminum, Powders, Pastes, and Flakes Market Capacity, Price Trend Analysis (2013–2017)
Figure 60 India Aluminum, Powders, Pastes, and Flakes Market Production, Analysis (2013–2017)
Figure 61 India Aluminum, Powders, Pastes, and Flakes Market Import, Analysis (2013–2017)
Figure 62 India Aluminum, Powders, Pastes, and Flakes Market Import, Analysis (2013–2017)
Figure 63 India Aluminum, Powders, Pastes, and Flakes Market Capacity, Production, Comparison Analysis (2013–2017)
Figure 64 India Aluminum, Powders, Pastes, and Flakes Market Capacity, Price Trend Analysis (2013–2017)
Figure 65 ASEAN Aluminum, Powders, Pastes, and Flakes Market Production, Analysis (2013–2017)
Figure 66 ASEAN Aluminum, Powders, Pastes, and Flakes Market Import, Analysis (2013–2017)
Figure 67 ASEAN Aluminum, Powders, Pastes, and Flakes Market Import, Analysis (2013–2017)
Figure 68 India Aluminum, Powders, Pastes, and Flakes Market Capacity, Production, Comparison Analysis (2013–2017)
Figure 69 India Aluminum, Powders, Pastes, and Flakes Market Capacity, Price Trend Analysis (2013–2017)
Figure 70 Latin America Aluminum Powders, Pastes and Flakes Market Value (US$ Thousand) and Volume (Tons) Forecast, 2017–2026
Figure 71 Latin America Aluminum Powders, Pastes and Flakes Market Attractiveness, by Country and Sub-region
Figure 72 Latin America Aluminum, Powders, Pastes, and Flakes Market Value Share, by Type, 2013 and 2026
Figure 73 Latin America Aluminum, Powders, Pastes, and Flakes Market Value Share, by Application, 2013 and 2026
Figure 74 Latin America Aluminum, Powders, Pastes, and Flakes Market Value Share, by Country and Sub-region, 2013 and 2026
Figure 75 Middle East & Africa Aluminum Powders, Pastes and Flakes Market Value (US$ Thousand) and Volume (Tons) Forecast, 2017–2026
Figure 76 Middle East & Africa Aluminum Powders, Pastes and Flakes Market Attractiveness, by Country and Sub-region
Figure 77 Middle East & Africa Aluminum, Powders, Pastes, and Flakes Market Value Share, by Type, 2013 and 2026
Figure 78 Middle East & Africa Aluminum, Powders, Pastes, and Flakes Market Value Share, by Application, 2013 and 2026
Figure 79 Middle East & Africa Aluminum, Powders, Pastes, and Flakes Market Value Share, by Country and Sub-region, 2013 and 2026
Figure 80 Aluminum Powders, Pastes & Flakes Market Share Analysis, by Company (2017)
Copyright © Transparency Market Research, Inc. All Rights reserved
Trust Online


Aluminum Powders, Pastes, and Flakes Market