
Global Enterprise Social Software Market: Snapshot
The global enterprise social software market is foretold to grow at a faster pace in the present enterprise ecosystem. The demand for enterprise social software systems and solutions could increase in the near future because of their user-friendly and flexible nature focused on improving the business value of organizations across the globe. Besides sheer social networking and connectivity, these solutions offer various benefits to users. Early adopters of enterprise social software are evangelizing the different advantages of this social suite even now. Prominent pervasiveness and global adoption trends across most verticals are clear signs of the optimistic growth of the market.
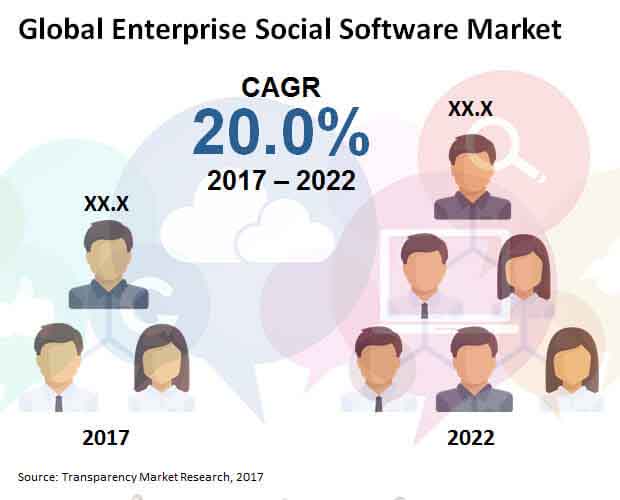
The global enterprise social software market is foreseen to expand at a CAGR of 20.0% during the forecast period 2017–2022. By 2022, the market could be valued at a US$6.1 bn from a US$2.4 bn achieved in 2017.
Market to Witness Superiority of Large Enterprise in Terms of Size
The world enterprise social software market is prognosticated to be cataloged into three segments, viz. large, medium, and small, on the basis of enterprise size. Out of these markets, large enterprise could generate an overpowering revenue of US$4.0 bn by the end of 2022. The absolute growth produced by this segment could be larger than any other under the same classification. However, there could be a slight drop in the market share of large enterprise, from a 69.0% in 2017 to a 66.1% in 2022.
In terms of segmentation by vertical, the world enterprise social software market is envisaged to be segregated into banking, financial services, and insurance (BFSI), healthcare, IT and telecommunications, retail, and government. As per deployment, on-premise and cloud-based could be the key markets for enterprise social software.
The analysts provide a deep insight into all of these segments so that readers could gain a sound understanding of their future projections and performance in the world enterprise social software market.
North America to Clasp Towering Share with Handsome CAGR
As far as the geographical study of the international enterprise social software market is concerned, prime regions such as North America, Latin America, Europe, Asia Pacific except Japan (APEJ), and the Middle East and Africa (MEA) and Japan could take a significant position. Nevertheless, North America is envisioned to be an extremely promising market for enterprise social software with a 21.5% CAGR expected to be posted between 2017 and 2022. Throughout the course of the forecast timeframe, the region could dominate the market in view of revenue.
Japan and the MEA are anticipated to lose massive basis points (BPS) in their market share by 2022 over 2017, i.e. 170 and 92 respectively. Europe could be a lucrative region for the international enterprise social software market as it is projected to reach a valuation of US$1.3 bn by 2022 end. APEJ, on other hand, could reach a US$1.0 bn by the same year.
Some of the crucial industry players in the worldwide enterprise social software market are predicted to be Aurea, Inc., IBM Corporation, Lithium Technologies, Inc., Microsoft Corporation, Salesforce.com, Inc., SAP, Socialtext, Inc., Synacor, Inc., TIBCO Software, Inc., and VMWare, Inc.
1. Global Enterprise Social Software Market - Executive Summary
2. Global Enterprise Social Software Market Overview
2.1. Introduction
2.1.1. Global Enterprise Social Software Market Taxonomy
2.1.2. Global Enterprise Social Software Market Definition
2.2. Global Enterprise Social Software Market Size (US$ Mn) and Forecast, 2012-2022
2.2.1. Global Enterprise Social Software Market Y-o-Y Growth
2.3. Global Enterprise Social Software Market Dynamics
2.4. Supply Chain
2.5. Cost Structure
2.6. Pricing Analysis
2.7. Raw Material Sourcing Strategy and Analysis
2.8. List of Distributors
2.9. Key Participants Market Presence (Intensity Map) By Region
3. Global Enterprise Social Software Market Analysis and Forecast By Enterprise Size
3.1. Global Enterprise Social Software Market Size and Forecast By Enterprise Size, 2012-2022
3.1.1. Small Enterprise Social Software Market Size and Forecast, 2012-2022
3.1.1.1. Revenue (US$ Mn) Comparison, By Region
3.1.1.2. Market Share Comparison, By Region
3.1.1.3. Y-o-Y growth Comparison, By Region
3.1.2. Medium Enterprise Social Software Market Size and Forecast, 2012-2022
3.1.2.1. Revenue (US$ Mn) Comparison, By Region
3.1.2.2. Market Share Comparison, By Region
3.1.2.3. Y-o-Y growth Comparison, By Region
3.1.3. Large Enterprise Social Software Market Size and Forecast, 2012-2022
3.1.3.1. Revenue (US$ Mn) Comparison, By Region
3.1.3.2. Market Share Comparison, By Region
3.1.3.3. Y-o-Y growth Comparison, By Region
4. Global Enterprise Social Software Market Analysis and Forecast By Vertical
4.1. Global Enterprise Social Software Market Size and Forecast By Vertical, 2012-2022
4.1.1. BFSI Enterprise Social Software Market Size and Forecast, 2012-2022
4.1.1.1. Revenue (US$ Mn) Comparison, By Region
4.1.1.2. Market Share Comparison, By Region
4.1.1.3. Y-o-Y growth Comparison, By Region
4.1.2. Healthcare Enterprise Social Software Market Size and Forecast, 2012-2022
4.1.2.1. Revenue (US$ Mn) Comparison, By Region
4.1.2.2. Market Share Comparison, By Region
4.1.2.3. Y-o-Y growth Comparison, By Region
4.1.3. IT and Telecommunications Enterprise Social Software Market Size and Forecast, 2012-2022
4.1.3.1. Revenue (US$ Mn) Comparison, By Region
4.1.3.2. Market Share Comparison, By Region
4.1.3.3. Y-o-Y growth Comparison, By Region
4.1.4. Retail Enterprise Social Software Market Size and Forecast, 2012-2022
4.1.4.1. Revenue (US$ Mn) Comparison, By Region
4.1.4.2. Market Share Comparison, By Region
4.1.4.3. Y-o-Y growth Comparison, By Region
4.1.5. Government Enterprise Social Software Market Size and Forecast, 2012-2022
4.1.5.1. Revenue (US$ Mn) Comparison, By Region
4.1.5.2. Market Share Comparison, By Region
4.1.5.3. Y-o-Y growth Comparison, By Region
4.1.6. Others Enterprise Social Software Market Size and Forecast, 2012-2022
4.1.6.1. Revenue (US$ Mn) Comparison, By Region
4.1.6.2. Market Share Comparison, By Region
4.1.6.3. Y-o-Y growth Comparison, By Region
5. Global Enterprise Social Software Market Analysis and Forecast By Deployment
5.1. Global Enterprise Social Software Market Size and Forecast By Deployment, 2012-2022
5.1.1. On-Premise Enterprise Social Software Market Size and Forecast, 2012-2022
5.1.1.1. Revenue (US$ Mn) Comparison, By Region
5.1.1.2. Market Share Comparison, By Region
5.1.1.3. Y-o-Y growth Comparison, By Region
5.1.2. Cloud-based Enterprise Social Software Market Size and Forecast, 2012-2022
5.1.2.1. Revenue (US$ Mn) Comparison, By Region
5.1.2.2. Market Share Comparison, By Region
5.1.2.3. Y-o-Y growth Comparison, By Region
6. Global Enterprise Social Software Market Analysis and Forecast By Region
6.1. Global Enterprise Social Software Market Size and Forecast, 2012-2022
6.1.1. North America Enterprise Social Software Market Size and Forecast, 2012-2022
6.1.1.1. Revenue (US$ Mn) Comparison, By Enterprise Size
6.1.1.2. Revenue (US$ Mn) Comparison, By Vertical
6.1.1.3. Revenue (US$ Mn) Comparison, By Deployment
6.1.2. Latin America Enterprise Social Software Market Size and Forecast, 2012-2022
6.1.2.1. Revenue (US$ Mn) Comparison, By Enterprise Size
6.1.2.2. Revenue (US$ Mn) Comparison, By Vertical
6.1.2.3. Revenue (US$ Mn) Comparison, By Deployment
6.1.3. Europe Enterprise Social Software Market Size and Forecast, 2012-2022
6.1.3.1. Revenue (US$ Mn) Comparison, By Enterprise Size
6.1.3.2. Revenue (US$ Mn) Comparison, By Vertical
6.1.3.3. Revenue (US$ Mn) Comparison, By Deployment
6.1.4. Japan Enterprise Social Software Market Size and Forecast, 2012-2022
6.1.4.1. Revenue (US$ Mn) Comparison, By Enterprise Size
6.1.4.2. Revenue (US$ Mn) Comparison, By Vertical
6.1.4.3. Revenue (US$ Mn) Comparison, By Deployment
6.1.5. APEJ Enterprise Social Software Market Size and Forecast, 2012-2022
6.1.5.1. Revenue (US$ Mn) Comparison, By Enterprise Size
6.1.5.2. Revenue (US$ Mn) Comparison, By Vertical
6.1.5.3. Revenue (US$ Mn) Comparison, By Deployment
6.1.6. MEA Enterprise Social Software Market Size and Forecast, 2012-2022
6.1.6.1. Revenue (US$ Mn) Comparison, By Enterprise Size
6.1.6.2. Revenue (US$ Mn) Comparison, By Vertical
6.1.6.3. Revenue (US$ Mn) Comparison, By Deployment
7. North America Enterprise Social Software Market Analysis and Forecast, By Country, 2012-2022
7.1. US Enterprise Social Software Market Size and Forecast, 2012-2022
7.1.1. Revenue (US$ Mn) Comparison, By Enterprise Size
7.1.2. Revenue (US$ Mn) Comparison, By Vertical
7.1.3. Revenue (US$ Mn) Comparison, By Deployment
7.2. Canada Enterprise Social Software Market Size and Forecast, 2012-2022
7.2.1. Revenue (US$ Mn) Comparison, By Enterprise Size
7.2.2. Revenue (US$ Mn) Comparison, By Vertical
7.2.3. Revenue (US$ Mn) Comparison, By Deployment
8. Latin America Enterprise Social Software Market Analysis and Forecast, By Country, 2012-2022
8.1. Brazil Enterprise Social Software Market Size and Forecast, 2012-2022
8.1.1. Revenue (US$ Mn) Comparison, By Enterprise Size
8.1.2. Revenue (US$ Mn) Comparison, By Vertical
8.1.3. Revenue (US$ Mn) Comparison, By Deployment
8.2. Mexico Enterprise Social Software Market Size and Forecast, 2012-2022
8.2.1. Revenue (US$ Mn) Comparison, By Enterprise Size
8.2.2. Revenue (US$ Mn) Comparison, By Vertical
8.2.3. Revenue (US$ Mn) Comparison, By Deployment
8.3. Argentina Enterprise Social Software Market Size and Forecast, 2012-2022
8.3.1. Revenue (US$ Mn) Comparison, By Enterprise Size
8.3.2. Revenue (US$ Mn) Comparison, By Vertical
8.3.3. Revenue (US$ Mn) Comparison, By Deployment
9. Europe Enterprise Social Software Market Analysis and Forecast, By Country, 2012-2022
9.1. Germany Enterprise Social Software Market Size and Forecast, 2012-2022
9.1.1. Revenue (US$ Mn) Comparison, By Enterprise Size
9.1.2. Revenue (US$ Mn) Comparison, By Vertical
9.1.3. Revenue (US$ Mn) Comparison, By Deployment
9.2. UK Enterprise Social Software Market Size and Forecast, 2012-2022
9.2.1. Revenue (US$ Mn) Comparison, By Enterprise Size
9.2.2. Revenue (US$ Mn) Comparison, By Vertical
9.2.3. Revenue (US$ Mn) Comparison, By Deployment
9.3. France Enterprise Social Software Market Size and Forecast, 2012-2022
9.3.1. Revenue (US$ Mn) Comparison, By Enterprise Size
9.3.2. Revenue (US$ Mn) Comparison, By Vertical
9.3.3. Revenue (US$ Mn) Comparison, By Deployment
9.4. Spain Enterprise Social Software Market Size and Forecast, 2012-2022
9.4.1. Revenue (US$ Mn) Comparison, By Enterprise Size
9.4.2. Revenue (US$ Mn) Comparison, By Vertical
9.4.3. Revenue (US$ Mn) Comparison, By Deployment
9.5. Italy Enterprise Social Software Market Size and Forecast, 2012-2022
9.5.1. Revenue (US$ Mn) Comparison, By Enterprise Size
9.5.2. Revenue (US$ Mn) Comparison, By Vertical
9.5.3. Revenue (US$ Mn) Comparison, By Deployment
9.6. Nordic Enterprise Social Software Market Size and Forecast, 2012-2022
9.6.1. Revenue (US$ Mn) Comparison, By Enterprise Size
9.6.2. Revenue (US$ Mn) Comparison, By Vertical
9.6.3. Revenue (US$ Mn) Comparison, By Deployment
10. Japan Enterprise Social Software Market Analysis and Forecast, By Country, 2012-2022
10.1. Japan Enterprise Social Software Market Size and Forecast, 2012-2022
10.1.1. Revenue (US$ Mn) Comparison, By Enterprise Size
10.1.2. Revenue (US$ Mn) Comparison, By Vertical
10.1.3. Revenue (US$ Mn) Comparison, By Deployment
11. APEJ Enterprise Social Software Market Analysis and Forecast, By Country, 2012-2022
11.1. China Enterprise Social Software Market Size and Forecast, 2012-2022
11.1.1. Revenue (US$ Mn) Comparison, By Enterprise Size
11.1.2. Revenue (US$ Mn) Comparison, By Vertical
11.1.3. Revenue (US$ Mn) Comparison, By Deployment
11.2. India Enterprise Social Software Market Size and Forecast, 2012-2022
11.2.1. Revenue (US$ Mn) Comparison, By Enterprise Size
11.2.2. Revenue (US$ Mn) Comparison, By Vertical
11.2.3. Revenue (US$ Mn) Comparison, By Deployment
11.3. Malaysia Enterprise Social Software Market Size and Forecast, 2012-2022
11.3.1. Revenue (US$ Mn) Comparison, By Enterprise Size
11.3.2. Revenue (US$ Mn) Comparison, By Vertical
11.3.3. Revenue (US$ Mn) Comparison, By Deployment
11.4. Thailand Enterprise Social Software Market Size and Forecast, 2012-2022
11.4.1. Revenue (US$ Mn) Comparison, By Enterprise Size
11.4.2. Revenue (US$ Mn) Comparison, By Vertical
11.4.3. Revenue (US$ Mn) Comparison, By Deployment
11.5. Singapore Enterprise Social Software Market Size and Forecast, 2012-2022
11.5.1. Revenue (US$ Mn) Comparison, By Enterprise Size
11.5.2. Revenue (US$ Mn) Comparison, By Vertical
11.5.3. Revenue (US$ Mn) Comparison, By Deployment
11.6. Australia Enterprise Social Software Market Size and Forecast, 2012-2022
11.6.1. Revenue (US$ Mn) Comparison, By Enterprise Size
11.6.2. Revenue (US$ Mn) Comparison, By Vertical
11.6.3. Revenue (US$ Mn) Comparison, By Deployment
12. MEA Enterprise Social Software Market Analysis and Forecast, By Country, 2012-2022
12.1. GCC Countries Enterprise Social Software Market Size and Forecast, 2012-2022
12.1.1. Revenue (US$ Mn) Comparison, By Enterprise Size
12.1.2. Revenue (US$ Mn) Comparison, By Vertical
12.1.3. Revenue (US$ Mn) Comparison, By Deployment
12.2. South Africa Enterprise Social Software Market Size and Forecast, 2012-2022
12.2.1. Revenue (US$ Mn) Comparison, By Enterprise Size
12.2.2. Revenue (US$ Mn) Comparison, By Vertical
12.2.3. Revenue (US$ Mn) Comparison, By Deployment
12.3. Nigeria Enterprise Social Software Market Size and Forecast, 2012-2022
12.3.1. Revenue (US$ Mn) Comparison, By Enterprise Size
12.3.2. Revenue (US$ Mn) Comparison, By Vertical
12.3.3. Revenue (US$ Mn) Comparison, By Deployment
12.4. Israel Enterprise Social Software Market Size and Forecast, 2012-2022
12.4.1. Revenue (US$ Mn) Comparison, By Enterprise Size
12.4.2. Revenue (US$ Mn) Comparison, By Vertical
12.4.3. Revenue (US$ Mn) Comparison, By Deployment
13. Global Enterprise Social Software Market Company Share, Competition Landscape and Company Profiles
13.1. Company Share Analysis
13.2. Competition Landscape
13.3. Company Profiles
13.3.1. Aurea, Inc.
13.3.2. IBM Corporation
13.3.3. Lithium Technologies, Inc.
13.3.4. Microsoft Corporation
13.3.5. Salesforce.com, Inc.
13.3.6. SAP
13.3.7. Socialtext, Inc.
13.3.8. Synacor, Inc.
13.3.9. TIBCO Software, Inc.
13.3.10. VMWare, Inc.
14. Research Methodology
15. Secondary and Primary Sources
16. Assumptions and Acronyms
17. Disclaimer
List Of Tables
TABLE 1 Global Enterprise Social Software Market Value (US$ Mn), 2012-2016
TABLE 2 Global Enterprise Social Software Market Value (US$ Mn), 2017-2022
TABLE 3 Global Enterprise Social Software Market Value (US$ Mn) and Y-o-Y, 2015-2022
TABLE 4 Global Small Enterprise Segment Value (US$ Mn), By Region 2012-2016
TABLE 5 Global Small Enterprise Segment Value (US$ Mn), By Region 2017-2022
TABLE 6 Global Small Enterprise Segment Market Share, By Region 2012-2016
TABLE 7 Global Small Enterprise Segment Market Share, By Region 2017-2022
TABLE 8 Global Small Enterprise Segment Y-o-Y, By Region 2015-2022
TABLE 9 Global Medium Enterprise Segment Value (US$ Mn), By Region 2012-2016
TABLE 10 Global Medium Enterprise Segment Value (US$ Mn), By Region 2017-2022
TABLE 11 Global Medium Enterprise Segment Market Share, By Region 2012-2016
TABLE 12 Global Medium Enterprise Segment Market Share, By Region 2017-2022
TABLE 13 Global Medium Enterprise Segment Y-o-Y, By Region 2015-2022
TABLE 14 Global Large Enterprise Segment Value (US$ Mn), By Region 2012-2016
TABLE 15 Global Large Enterprise Segment Value (US$ Mn), By Region 2017-2022
TABLE 16 Global Large Enterprise Segment Market Share, By Region 2012-2016
TABLE 17 Global Large Enterprise Segment Market Share, By Region 2017-2022
TABLE 18 Global Large Enterprise Segment Y-o-Y, By Region 2015-2022
TABLE 19 Global BFSI Segment Value (US$ Mn), By Region 2012-2016
TABLE 20 Global BFSI Segment Value (US$ Mn), By Region 2017-2022
TABLE 21 Global BFSI Segment Market Share, By Region 2012-2016
TABLE 22 Global BFSI Segment Market Share, By Region 2017-2022
TABLE 23 Global BFSI Segment Y-o-Y, By Region 2015-2022
TABLE 24 Global Healthcare Segment Value (US$ Mn), By Region 2012-2016
TABLE 25 Global Healthcare Segment Value (US$ Mn), By Region 2017-2022
TABLE 26 Global Healthcare Segment Market Share, By Region 2012-2016
TABLE 27 Global Healthcare Segment Market Share, By Region 2017-2022
TABLE 28 Global Healthcare Segment Y-o-Y, By Region 2015-2022
TABLE 29 Global IT and Telecommunications Segment Value (US$ Mn), By Region 2012-2016
TABLE 30 Global IT and Telecommunications Segment Value (US$ Mn), By Region 2017-2022
TABLE 31 Global IT and Telecommunications Segment Market Share, By Region 2012-2016
TABLE 32 Global IT and Telecommunications Segment Market Share, By Region 2017-2022
TABLE 33 Global IT and Telecommunications Segment Y-o-Y, By Region 2015-2022
TABLE 34 Global Retail Segment Value (US$ Mn), By Region 2012-2016
TABLE 35 Global Retail Segment Value (US$ Mn), By Region 2017-2022
TABLE 36 Global Retail Segment Market Share, By Region 2012-2016
TABLE 37 Global Retail Segment Market Share, By Region 2017-2022
TABLE 38 Global Retail Segment Y-o-Y, By Region 2015-2022
TABLE 39 Global Government Segment Value (US$ Mn), By Region 2012-2016
TABLE 40 Global Government Segment Value (US$ Mn), By Region 2017-2022
TABLE 41 Global Government Segment Market Share, By Region 2012-2016
TABLE 42 Global Government Segment Market Share, By Region 2017-2022
TABLE 43 Global Government Segment Y-o-Y, By Region 2015-2022
TABLE 44 Global Others Segment Value (US$ Mn), By Region 2012-2016
TABLE 45 Global Others Segment Value (US$ Mn), By Region 2017-2022
TABLE 46 Global Others Segment Market Share, By Region 2012-2016
TABLE 47 Global Others Segment Market Share, By Region 2017-2022
TABLE 48 Global Others Segment Y-o-Y, By Region 2015-2022
TABLE 49 Global On-Premise Segment Value (US$ Mn), By Region 2012-2016
TABLE 50 Global On-Premise Segment Value (US$ Mn), By Region 2017-2022
TABLE 51 Global On-Premise Segment Market Share, By Region 2012-2016
TABLE 52 Global On-Premise Segment Market Share, By Region 2017-2022
TABLE 53 Global On-Premise Segment Y-o-Y, By Region 2015-2022
TABLE 54 Global Cloud-based Segment Value (US$ Mn), By Region 2012-2016
TABLE 55 Global Cloud-based Segment Value (US$ Mn), By Region 2017-2022
TABLE 56 Global Cloud-based Segment Market Share, By Region 2012-2016
TABLE 57 Global Cloud-based Segment Market Share, By Region 2017-2022
TABLE 58 Global Cloud-based Segment Y-o-Y, By Region 2015-2022
TABLE 59 North America Enterprise Social Software Market Value (US$ Mn), By Enterprise Size 2012-2016
TABLE 60 North America Enterprise Social Software Market Value (US$ Mn), By Enterprise Size 2017-2022
TABLE 61 North America Enterprise Social Software Market Value (US$ Mn), By Vertical 2012-2016
TABLE 62 North America Enterprise Social Software Market Value (US$ Mn), By Vertical 2017-2022
TABLE 63 North America Enterprise Social Software Market Value (US$ Mn), By Deployment 2012-2016
TABLE 64 North America Enterprise Social Software Market Value (US$ Mn), By Deployment 2017-2022
TABLE 65 Latin America Enterprise Social Software Market Value (US$ Mn), By Enterprise Size 2012-2016
TABLE 66 Latin America Enterprise Social Software Market Value (US$ Mn), By Enterprise Size 2017-2022
TABLE 67 Latin America Enterprise Social Software Market Value (US$ Mn), By Vertical 2012-2016
TABLE 68 Latin America Enterprise Social Software Market Value (US$ Mn), By Vertical 2017-2022
TABLE 69 Latin America Enterprise Social Software Market Value (US$ Mn), By Deployment 2012-2016
TABLE 70 Latin America Enterprise Social Software Market Value (US$ Mn), By Deployment 2017-2022
TABLE 71 Europe Enterprise Social Software Market Value (US$ Mn), By Enterprise Size 2012-2016
TABLE 72 Europe Enterprise Social Software Market Value (US$ Mn), By Enterprise Size 2017-2022
TABLE 73 Europe Enterprise Social Software Market Value (US$ Mn), By Vertical 2012-2016
TABLE 74 Europe Enterprise Social Software Market Value (US$ Mn), By Vertical 2017-2022
TABLE 75 Europe Enterprise Social Software Market Value (US$ Mn), By Deployment 2012-2016
TABLE 76 Europe Enterprise Social Software Market Value (US$ Mn), By Deployment 2017-2022
TABLE 77 Japan Enterprise Social Software Market Value (US$ Mn), By Enterprise Size 2012-2016
TABLE 78 Japan Enterprise Social Software Market Value (US$ Mn), By Enterprise Size 2017-2022
TABLE 79 Japan Enterprise Social Software Market Value (US$ Mn), By Vertical 2012-2016
TABLE 80 Japan Enterprise Social Software Market Value (US$ Mn), By Vertical 2017-2022
TABLE 81 Japan Enterprise Social Software Market Value (US$ Mn), By Deployment 2012-2016
TABLE 82 Japan Enterprise Social Software Market Value (US$ Mn), By Deployment 2017-2022
TABLE 83 APEJ Enterprise Social Software Market Value (US$ Mn), By Enterprise Size 2012-2016
TABLE 84 APEJ Enterprise Social Software Market Value (US$ Mn), By Enterprise Size 2017-2022
TABLE 85 APEJ Enterprise Social Software Market Value (US$ Mn), By Vertical 2012-2016
TABLE 86 APEJ Enterprise Social Software Market Value (US$ Mn), By Vertical 2017-2022
TABLE 87 APEJ Enterprise Social Software Market Value (US$ Mn), By Deployment 2012-2016
TABLE 88 APEJ Enterprise Social Software Market Value (US$ Mn), By Deployment 2017-2022
TABLE 89 MEA Enterprise Social Software Market Value (US$ Mn), By Enterprise Size 2012-2016
TABLE 90 MEA Enterprise Social Software Market Value (US$ Mn), By Enterprise Size 2017-2022
TABLE 91 MEA Enterprise Social Software Market Value (US$ Mn), By Vertical 2012-2016
TABLE 92 MEA Enterprise Social Software Market Value (US$ Mn), By Vertical 2017-2022
TABLE 93 MEA Enterprise Social Software Market Value (US$ Mn), By Deployment 2012-2016
TABLE 94 MEA Enterprise Social Software Market Value (US$ Mn), By Deployment 2017-2022
TABLE 95 US Enterprise Social Software Market Value (US$ Mn), By Enterprise Size 2012-2016
TABLE 96 US Enterprise Social Software Market Value (US$ Mn), By Enterprise Size 2017-2022
TABLE 97 US Enterprise Social Software Market Value (US$ Mn), By Vertical 2012-2016
TABLE 98 US Enterprise Social Software Market Value (US$ Mn), By Vertical 2017-2022
TABLE 99 US Enterprise Social Software Market Value (US$ Mn), By Deployment 2012-2016
TABLE 100 US Enterprise Social Software Market Value (US$ Mn), By Deployment 2017-2022
TABLE 101 Canada Enterprise Social Software Market Value (US$ Mn), By Enterprise Size 2012-2016
TABLE 102 Canada Enterprise Social Software Market Value (US$ Mn), By Enterprise Size 2017-2022
TABLE 103 Canada Enterprise Social Software Market Value (US$ Mn), By Vertical 2012-2016
TABLE 104 Canada Enterprise Social Software Market Value (US$ Mn), By Vertical 2017-2022
TABLE 105 Canada Enterprise Social Software Market Value (US$ Mn), By Deployment 2012-2016
TABLE 106 Canada Enterprise Social Software Market Value (US$ Mn), By Deployment 2017-2022
TABLE 107 Brazil Enterprise Social Software Market Value (US$ Mn), By Enterprise Size 2012-2016
TABLE 108 Brazil Enterprise Social Software Market Value (US$ Mn), By Enterprise Size 2017-2022
TABLE 109 Brazil Enterprise Social Software Market Value (US$ Mn), By Vertical 2012-2016
TABLE 110 Brazil Enterprise Social Software Market Value (US$ Mn), By Vertical 2017-2022
TABLE 111 Brazil Enterprise Social Software Market Value (US$ Mn), By Deployment 2012-2016
TABLE 112 Brazil Enterprise Social Software Market Value (US$ Mn), By Deployment 2017-2022
TABLE 113 Mexico Enterprise Social Software Market Value (US$ Mn), By Enterprise Size 2012-2016
TABLE 114 Mexico Enterprise Social Software Market Value (US$ Mn), By Enterprise Size 2017-2022
TABLE 115 Mexico Enterprise Social Software Market Value (US$ Mn), By Vertical 2012-2016
TABLE 116 Mexico Enterprise Social Software Market Value (US$ Mn), By Vertical 2017-2022
TABLE 117 Mexico Enterprise Social Software Market Value (US$ Mn), By Deployment 2012-2016
TABLE 118 Mexico Enterprise Social Software Market Value (US$ Mn), By Deployment 2017-2022
TABLE 119 Argentina Enterprise Social Software Market Value (US$ Mn), By Enterprise Size 2012-2016
TABLE 120 Argentina Enterprise Social Software Market Value (US$ Mn), By Enterprise Size 2017-2022
TABLE 121 Argentina Enterprise Social Software Market Value (US$ Mn), By Vertical 2012-2016
TABLE 122 Argentina Enterprise Social Software Market Value (US$ Mn), By Vertical 2017-2022
TABLE 123 Argentina Enterprise Social Software Market Value (US$ Mn), By Deployment 2012-2016
TABLE 124 Argentina Enterprise Social Software Market Value (US$ Mn), By Deployment 2017-2022
TABLE 125 Germany Enterprise Social Software Market Value (US$ Mn), By Enterprise Size 2012-2016
TABLE 126 Germany Enterprise Social Software Market Value (US$ Mn), By Enterprise Size 2017-2022
TABLE 127 Germany Enterprise Social Software Market Value (US$ Mn), By Vertical 2012-2016
TABLE 128 Germany Enterprise Social Software Market Value (US$ Mn), By Vertical 2017-2022
TABLE 129 Germany Enterprise Social Software Market Value (US$ Mn), By Deployment 2012-2016
TABLE 130 Germany Enterprise Social Software Market Value (US$ Mn), By Deployment 2017-2022
TABLE 131 UK Enterprise Social Software Market Value (US$ Mn), By Enterprise Size 2012-2016
TABLE 132 UK Enterprise Social Software Market Value (US$ Mn), By Enterprise Size 2017-2022
TABLE 133 UK Enterprise Social Software Market Value (US$ Mn), By Vertical 2012-2016
TABLE 134 UK Enterprise Social Software Market Value (US$ Mn), By Vertical 2017-2022
TABLE 135 UK Enterprise Social Software Market Value (US$ Mn), By Deployment 2012-2016
TABLE 136 UK Enterprise Social Software Market Value (US$ Mn), By Deployment 2017-2022
TABLE 137 France Enterprise Social Software Market Value (US$ Mn), By Enterprise Size 2012-2016
TABLE 138 France Enterprise Social Software Market Value (US$ Mn), By Enterprise Size 2017-2022
TABLE 139 France Enterprise Social Software Market Value (US$ Mn), By Vertical 2012-2016
TABLE 140 France Enterprise Social Software Market Value (US$ Mn), By Vertical 2017-2022
TABLE 141 France Enterprise Social Software Market Value (US$ Mn), By Deployment 2012-2016
TABLE 142 France Enterprise Social Software Market Value (US$ Mn), By Deployment 2017-2022
TABLE 143 Spain Enterprise Social Software Market Value (US$ Mn), By Enterprise Size 2012-2016
TABLE 144 Spain Enterprise Social Software Market Value (US$ Mn), By Enterprise Size 2017-2022
TABLE 145 Spain Enterprise Social Software Market Value (US$ Mn), By Vertical 2012-2016
TABLE 146 Spain Enterprise Social Software Market Value (US$ Mn), By Vertical 2017-2022
TABLE 147 Spain Enterprise Social Software Market Value (US$ Mn), By Deployment 2012-2016
TABLE 148 Spain Enterprise Social Software Market Value (US$ Mn), By Deployment 2017-2022
TABLE 149 Italy Enterprise Social Software Market Value (US$ Mn), By Enterprise Size 2012-2016
TABLE 150 Italy Enterprise Social Software Market Value (US$ Mn), By Enterprise Size 2017-2022
TABLE 151 Italy Enterprise Social Software Market Value (US$ Mn), By Vertical 2012-2016
TABLE 152 Italy Enterprise Social Software Market Value (US$ Mn), By Vertical 2017-2022
TABLE 153 Italy Enterprise Social Software Market Value (US$ Mn), By Deployment 2012-2016
TABLE 154 Italy Enterprise Social Software Market Value (US$ Mn), By Deployment 2017-2022
TABLE 155 Nordic Enterprise Social Software Market Value (US$ Mn), By Enterprise Size 2012-2016
TABLE 156 Nordic Enterprise Social Software Market Value (US$ Mn), By Enterprise Size 2017-2022
TABLE 157 Nordic Enterprise Social Software Market Value (US$ Mn), By Vertical 2012-2016
TABLE 158 Nordic Enterprise Social Software Market Value (US$ Mn), By Vertical 2017-2022
TABLE 159 Nordic Enterprise Social Software Market Value (US$ Mn), By Deployment 2012-2016
TABLE 160 Nordic Enterprise Social Software Market Value (US$ Mn), By Deployment 2017-2022
TABLE 161 Japan Enterprise Social Software Market Value (US$ Mn), By Enterprise Size 2012-2016
TABLE 162 Japan Enterprise Social Software Market Value (US$ Mn), By Enterprise Size 2017-2022
TABLE 163 Japan Enterprise Social Software Market Value (US$ Mn), By Vertical 2012-2016
TABLE 164 Japan Enterprise Social Software Market Value (US$ Mn), By Vertical 2017-2022
TABLE 165 Japan Enterprise Social Software Market Value (US$ Mn), By Deployment 2012-2016
TABLE 166 Japan Enterprise Social Software Market Value (US$ Mn), By Deployment 2017-2022
TABLE 167 China Enterprise Social Software Market Value (US$ Mn), By Enterprise Size 2012-2016
TABLE 168 China Enterprise Social Software Market Value (US$ Mn), By Enterprise Size 2017-2022
TABLE 169 China Enterprise Social Software Market Value (US$ Mn), By Vertical 2012-2016
TABLE 170 China Enterprise Social Software Market Value (US$ Mn), By Vertical 2017-2022
TABLE 171 China Enterprise Social Software Market Value (US$ Mn), By Deployment 2012-2016
TABLE 172 China Enterprise Social Software Market Value (US$ Mn), By Deployment 2017-2022
TABLE 173 India Enterprise Social Software Market Value (US$ Mn), By Enterprise Size 2012-2016
TABLE 174 India Enterprise Social Software Market Value (US$ Mn), By Enterprise Size 2017-2022
TABLE 175 India Enterprise Social Software Market Value (US$ Mn), By Vertical 2012-2016
TABLE 176 India Enterprise Social Software Market Value (US$ Mn), By Vertical 2017-2022
TABLE 177 India Enterprise Social Software Market Value (US$ Mn), By Deployment 2012-2016
TABLE 178 India Enterprise Social Software Market Value (US$ Mn), By Deployment 2017-2022
TABLE 179 Malaysia Enterprise Social Software Market Value (US$ Mn), By Enterprise Size 2012-2016
TABLE 180 Malaysia Enterprise Social Software Market Value (US$ Mn), By Enterprise Size 2017-2022
TABLE 181 Malaysia Enterprise Social Software Market Value (US$ Mn), By Vertical 2012-2016
TABLE 182 Malaysia Enterprise Social Software Market Value (US$ Mn), By Vertical 2017-2022
TABLE 183 Malaysia Enterprise Social Software Market Value (US$ Mn), By Deployment 2012-2016
TABLE 184 Malaysia Enterprise Social Software Market Value (US$ Mn), By Deployment 2017-2022
TABLE 185 Thailand Enterprise Social Software Market Value (US$ Mn), By Enterprise Size 2012-2016
TABLE 186 Thailand Enterprise Social Software Market Value (US$ Mn), By Enterprise Size 2017-2022
TABLE 187 Thailand Enterprise Social Software Market Value (US$ Mn), By Vertical 2012-2016
TABLE 188 Thailand Enterprise Social Software Market Value (US$ Mn), By Vertical 2017-2022
TABLE 189 Thailand Enterprise Social Software Market Value (US$ Mn), By Deployment 2012-2016
TABLE 190 Thailand Enterprise Social Software Market Value (US$ Mn), By Deployment 2017-2022
TABLE 191 Singapore Enterprise Social Software Market Value (US$ Mn), By Enterprise Size 2012-2016
TABLE 192 Singapore Enterprise Social Software Market Value (US$ Mn), By Enterprise Size 2017-2022
TABLE 193 Singapore Enterprise Social Software Market Value (US$ Mn), By Vertical 2012-2016
TABLE 194 Singapore Enterprise Social Software Market Value (US$ Mn), By Vertical 2017-2022
TABLE 195 Singapore Enterprise Social Software Market Value (US$ Mn), By Deployment 2012-2016
TABLE 196 Singapore Enterprise Social Software Market Value (US$ Mn), By Deployment 2017-2022
TABLE 197 Australia Enterprise Social Software Market Value (US$ Mn), By Enterprise Size 2012-2016
TABLE 198 Australia Enterprise Social Software Market Value (US$ Mn), By Enterprise Size 2017-2022
TABLE 199 Australia Enterprise Social Software Market Value (US$ Mn), By Vertical 2012-2016
TABLE 200 Australia Enterprise Social Software Market Value (US$ Mn), By Vertical 2017-2022
TABLE 201 Australia Enterprise Social Software Market Value (US$ Mn), By Deployment 2012-2016
TABLE 202 Australia Enterprise Social Software Market Value (US$ Mn), By Deployment 2017-2022
TABLE 203 GCC Countries Enterprise Social Software Market Value (US$ Mn), By Enterprise Size 2012-2016
TABLE 204 GCC Countries Enterprise Social Software Market Value (US$ Mn), By Enterprise Size 2017-2022
TABLE 205 GCC Countries Enterprise Social Software Market Value (US$ Mn), By Vertical 2012-2016
TABLE 206 GCC Countries Enterprise Social Software Market Value (US$ Mn), By Vertical 2017-2022
TABLE 207 GCC Countries Enterprise Social Software Market Value (US$ Mn), By Deployment 2012-2016
TABLE 208 GCC Countries Enterprise Social Software Market Value (US$ Mn), By Deployment 2017-2022
TABLE 209 South Africa Enterprise Social Software Market Value (US$ Mn), By Enterprise Size 2012-2016
TABLE 210 South Africa Enterprise Social Software Market Value (US$ Mn), By Enterprise Size 2017-2022
TABLE 211 South Africa Enterprise Social Software Market Value (US$ Mn), By Vertical 2012-2016
TABLE 212 South Africa Enterprise Social Software Market Value (US$ Mn), By Vertical 2017-2022
TABLE 213 South Africa Enterprise Social Software Market Value (US$ Mn), By Deployment 2012-2016
TABLE 214 South Africa Enterprise Social Software Market Value (US$ Mn), By Deployment 2017-2022
TABLE 215 Nigeria Enterprise Social Software Market Value (US$ Mn), By Enterprise Size 2012-2016
TABLE 216 Nigeria Enterprise Social Software Market Value (US$ Mn), By Enterprise Size 2017-2022
TABLE 217 Nigeria Enterprise Social Software Market Value (US$ Mn), By Vertical 2012-2016
TABLE 218 Nigeria Enterprise Social Software Market Value (US$ Mn), By Vertical 2017-2022
TABLE 219 Nigeria Enterprise Social Software Market Value (US$ Mn), By Deployment 2012-2016
TABLE 220 Nigeria Enterprise Social Software Market Value (US$ Mn), By Deployment 2017-2022
TABLE 221 Israel Enterprise Social Software Market Value (US$ Mn), By Enterprise Size 2012-2016
TABLE 222 Israel Enterprise Social Software Market Value (US$ Mn), By Enterprise Size 2017-2022
TABLE 223 Israel Enterprise Social Software Market Value (US$ Mn), By Vertical 2012-2016
TABLE 224 Israel Enterprise Social Software Market Value (US$ Mn), By Vertical 2017-2022
TABLE 225 Israel Enterprise Social Software Market Value (US$ Mn), By Deployment 2012-2016
TABLE 226 Israel Enterprise Social Software Market Value (US$ Mn), By Deployment 2017-2022
List Of Figures
FIG. 1 Global Enterprise Social Software Market Value (US$ Mn), 2012-2016
FIG. 2 Global Enterprise Social Software Market Value (US$ Mn) Forecast, 2017-2022
FIG. 3 Global Enterprise Social Software Market Value (US$ Mn) and Y-o-Y, 2015-2022
FIG. 4 Global Small Enterprise Segment Market Value (US$ Mn) By Region, 2012-2016
FIG. 5 Global Small Enterprise Segment Market Value (US$ Mn) By Region, 2017-2022
FIG. 6 Global Small Enterprise Segment Y-o-Y Growth Rate, By Region, 2015-2022
FIG. 7 Global Medium Enterprise Segment Market Value (US$ Mn) By Region, 2012-2016
FIG. 8 Global Medium Enterprise Segment Market Value (US$ Mn) By Region, 2017-2022
FIG. 9 Global Medium Enterprise Segment Y-o-Y Growth Rate, By Region, 2015-2022
FIG. 10 Global Large Enterprise Segment Market Value (US$ Mn) By Region, 2012-2016
FIG. 11 Global Large Enterprise Segment Market Value (US$ Mn) By Region, 2017-2022
FIG. 12 Global Large Enterprise Segment Y-o-Y Growth Rate, By Region, 2015-2022
FIG. 13 Global BFSI Segment Market Value (US$ Mn) By Region, 2012-2016
FIG. 14 Global BFSI Segment Market Value (US$ Mn) By Region, 2017-2022
FIG. 15 Global BFSI Segment Y-o-Y Growth Rate, By Region, 2015-2022
FIG. 16 Global Healthcare Segment Market Value (US$ Mn) By Region, 2012-2016
FIG. 17 Global Healthcare Segment Market Value (US$ Mn) By Region, 2017-2022
FIG. 18 Global Healthcare Segment Y-o-Y Growth Rate, By Region, 2015-2022
FIG. 19 Global IT and Telecommunications Segment Market Value (US$ Mn) By Region, 2012-2016
FIG. 20 Global IT and Telecommunications Segment Market Value (US$ Mn) By Region, 2017-2022
FIG. 21 Global IT and Telecommunications Segment Y-o-Y Growth Rate, By Region, 2015-2022
FIG. 22 Global Retail Segment Market Value (US$ Mn) By Region, 2012-2016
FIG. 23 Global Retail Segment Market Value (US$ Mn) By Region, 2017-2022
FIG. 24 Global Retail Segment Y-o-Y Growth Rate, By Region, 2015-2022
FIG. 25 Global Government Segment Market Value (US$ Mn) By Region, 2012-2016
FIG. 26 Global Government Segment Market Value (US$ Mn) By Region, 2017-2022
FIG. 27 Global Government Segment Y-o-Y Growth Rate, By Region, 2015-2022
FIG. 28 Global Others Segment Market Value (US$ Mn) By Region, 2012-2016
FIG. 29 Global Others Segment Market Value (US$ Mn) By Region, 2017-2022
FIG. 30 Global Others Segment Y-o-Y Growth Rate, By Region, 2015-2022
FIG. 31 Global On-Premise Segment Market Value (US$ Mn) By Region, 2012-2016
FIG. 32 Global On-Premise Segment Market Value (US$ Mn) By Region, 2017-2022
FIG. 33 Global On-Premise Segment Y-o-Y Growth Rate, By Region, 2015-2022
FIG. 34 Global Cloud-based Segment Market Value (US$ Mn) By Region, 2012-2016
FIG. 35 Global Cloud-based Segment Market Value (US$ Mn) By Region, 2017-2022
FIG. 36 Global Cloud-based Segment Y-o-Y Growth Rate, By Region, 2015-2022
FIG. 37 North America Enterprise Social Software Market Value (US$ Mn), By Enterprise Size 2012-2016
FIG. 38 North America Enterprise Social Software Market Value (US$ Mn), By Enterprise Size 2017-2022
FIG. 39 North America Enterprise Social Software Market Value (US$ Mn), By Vertical 2012-2016
FIG. 40 North America Enterprise Social Software Market Value (US$ Mn), By Vertical 2017-2022
FIG. 41 North America Enterprise Social Software Market Value (US$ Mn), By Deployment 2012-2016
FIG. 42 North America Enterprise Social Software Market Value (US$ Mn), By Deployment 2017-2022
FIG. 43 Latin America Enterprise Social Software Market Value (US$ Mn), By Enterprise Size 2012-2016
FIG. 44 Latin America Enterprise Social Software Market Value (US$ Mn), By Enterprise Size 2017-2022
FIG. 45 Latin America Enterprise Social Software Market Value (US$ Mn), By Vertical 2012-2016
FIG. 46 Latin America Enterprise Social Software Market Value (US$ Mn), By Vertical 2017-2022
FIG. 47 Latin America Enterprise Social Software Market Value (US$ Mn), By Deployment 2012-2016
FIG. 48 Latin America Enterprise Social Software Market Value (US$ Mn), By Deployment 2017-2022
FIG. 49 Europe Enterprise Social Software Market Value (US$ Mn), By Enterprise Size 2012-2016
FIG. 50 Europe Enterprise Social Software Market Value (US$ Mn), By Enterprise Size 2017-2022
FIG. 51 Europe Enterprise Social Software Market Value (US$ Mn), By Vertical 2012-2016
FIG. 52 Europe Enterprise Social Software Market Value (US$ Mn), By Vertical 2017-2022
FIG. 53 Europe Enterprise Social Software Market Value (US$ Mn), By Deployment 2012-2016
FIG. 54 Europe Enterprise Social Software Market Value (US$ Mn), By Deployment 2017-2022
FIG. 55 Japan Enterprise Social Software Market Value (US$ Mn), By Enterprise Size 2012-2016
FIG. 56 Japan Enterprise Social Software Market Value (US$ Mn), By Enterprise Size 2017-2022
FIG. 57 Japan Enterprise Social Software Market Value (US$ Mn), By Vertical 2012-2016
FIG. 58 Japan Enterprise Social Software Market Value (US$ Mn), By Vertical 2017-2022
FIG. 59 Japan Enterprise Social Software Market Value (US$ Mn), By Deployment 2012-2016
FIG. 60 Japan Enterprise Social Software Market Value (US$ Mn), By Deployment 2017-2022
FIG. 61 APEJ Enterprise Social Software Market Value (US$ Mn), By Enterprise Size 2012-2016
FIG. 62 APEJ Enterprise Social Software Market Value (US$ Mn), By Enterprise Size 2017-2022
FIG. 63 APEJ Enterprise Social Software Market Value (US$ Mn), By Vertical 2012-2016
FIG. 64 APEJ Enterprise Social Software Market Value (US$ Mn), By Vertical 2017-2022
FIG. 65 APEJ Enterprise Social Software Market Value (US$ Mn), By Deployment 2012-2016
FIG. 66 APEJ Enterprise Social Software Market Value (US$ Mn), By Deployment 2017-2022
FIG. 67 MEA Enterprise Social Software Market Value (US$ Mn), By Enterprise Size 2012-2016
FIG. 68 MEA Enterprise Social Software Market Value (US$ Mn), By Enterprise Size 2017-2022
FIG. 69 MEA Enterprise Social Software Market Value (US$ Mn), By Vertical 2012-2016
FIG. 70 MEA Enterprise Social Software Market Value (US$ Mn), By Vertical 2017-2022
FIG. 71 MEA Enterprise Social Software Market Value (US$ Mn), By Deployment 2012-2016
FIG. 72 MEA Enterprise Social Software Market Value (US$ Mn), By Deployment 2017-2022
Copyright © Transparency Market Research, Inc. All Rights reserved
Trust Online


Enterprise Social Software Market