
Global Bromine Market: Snapshot
Established global behemoths wield a substantial control over the bromine market, worldwide. Their dominant position is a result of their massive manufacturing capacities and significant geographical outreach. Armed with substantial technological and financial resources, the companies have been nimbly adapting to various market changes. In order to bolster their positions further, these companies have been leveraging astute pricing policies and product development.
Bromine and its derivatives are increasingly finding application in lessening mercury emissions from smokestacks of coal-fired plants that poses hazard to human health. In fact, many governments and other authorities already have regulations in place to arrest mercury emission. This in turn has provided a fillip to the global bromine market. Besides, bromine is also used in water treatment – be it industrial water treatment or residential or commercial water purification. This is another growth driver in the market.
Negatively impacting its market, on the other hand, is the fact that bromine is a hazardous waste, which has to be disposed of carefully so as to cause minimum damage to the environment and humans. Further, bromine vapor is highly corrosive. The problem becomes aggravated in presence of moisture on account of the formation of acids. Therefore, bromine needs be kept dry during transportation and storage.
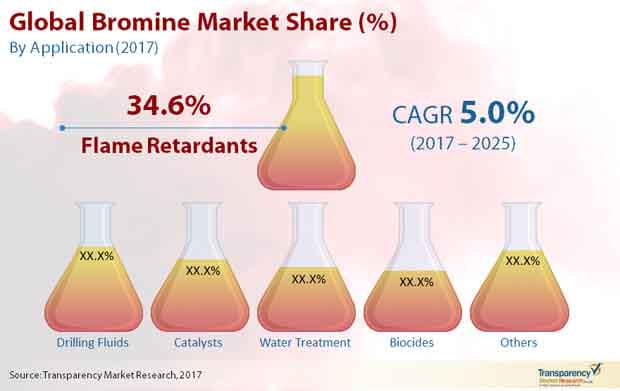
A report by Transparency Market Research, forecasts the global bromine market to expand at a lackluster CAGR of 5.0% from 2017 to 2025, to become worth US$2.674 bn by 2025 from US$1.74 in 2016.
Unabated Oil and Gas Drilling Activities to Stoke Maximum Growth in Drilling Fluids
The global bromine market can be divided into flame retardants, drilling fluids, biocides, catalysts, water treatment, etc. based on its different applications. Of them, the segment of flame retardants accounts for maximum market share. Going forward, the segment is expected to retain its leading share in the market, albeit reducing it slightly to 32.6% by 2025 by clocking the minimum CAGR of 4.2%. This is because, bromine, which is used to manufacture brominated flame retardants (BFR) which is added to a wide array of products, ranging from textiles, plastics, and electrical/electronic equipment, is being banned or restricted on account of its ill-effects on human health. This is proving a major impediment to the growth in the global bromine market.
Another major application of bromine is as clear brine fluids in drilling fluids. With oil and gas drilling activities showing little signs of slowing down in the near future, despite oversupply, the segment is slated to clock continued growth as they are used in the completion process of oil and gas extraction. The segment is expected to register a CAGR of 5.4% from 2017 to 2025.
Vis-à-vis growth rate, however, water treatment application is anticipated to surpass all other applications by registering a CAGR of 6.1% between 2017 and 2025.
Powered by Demand from China, Asia Pacific Leads Market
From a geographical standpoint, Asia Pacific leads the global bromine market both in terms of growth pace and share in revenue. In 2016, the region contributed a significant 50.0% share in the revenue in the market. The region is predicted to grow its leading share vis-à-vis volume in the near future mainly on the back of massive demand from China, which accounts for over half the demand for bromine in the region.
North America and Europe are mature markets and demand for bromine is low in Latin America and the Middle East and Africa. Israel, China, the U.S., and Jordan are the major manufacturers of bromine.
Some of the prominent participants operating in the global bromine market are Albemarle Corporation, Israel Chemical Ltd. (ICL), Jordan Bromine Company Limited, and Gulf Resources Inc.
Expanding Array of Applications in Bromine Market Keeps Opportunities Fervent
The use of bromine has expanded steadily since it was discovered. The growing array of applications of bromine and bromine compounds has underpinned the prospects in the bromine market. In sync with this trend, production of commercial brominated products have risen in the developing and developed world over the past few decades. Some of the foremost applications that drive revenue growth are agriculture, photography, healthcare, and water purification. In healthcare, drug makers have used bromine compounds to develop wide range of OTC medicines and prescription drugs. In recent times, players in the bromine market are realizing vast revenue potential from the ongoing research and development for developing drugs for cancer, AIDS, and the Alzheimer’s. Another emerging application is the incredible avenue in the electric vehicle industry, where bromine compounds are being viewed as an attractive contender for battery making. Perhaps a large chunk of revenues have come from the use of bromine as a water disinfectant especially in large and small public drinking-water plants. However, the use of the compound in purification of potable water for residential application is limited, due to cost constraints. Ongoing research in microbiocidal efficacy of bromine along with advances in water disinfestation equipment is spurring the growth prospects in the bromine market.
In wake of outbreaks in early 2020 to mid-2020, the pandemic drew concerted action from governments around the world. The healthcare systems had sprung into action and governments in numerous countries were proactive to impose restrictions that could contain the spread of the virus. However, the second wave of Covid-19 pandemic has been fiercer than expected in some regions. The mortality in affected people has unleashed disruptions to economies and health systems have been severely impaired. The surge in cases in some regions has led to a deep chasm in the demand and supply and demand dynamics. On the other hand, seeing the substantial gap between supply and demand for essential products such as oxygen cylinders, raw materials for vaccines, and protective equipment has spurred new opportunities to manufacturers. All these trends are expected to shape the expansion of the bromine market.
The global bromine market has been segmented as follows:
|
Application Analysis |
|
|
Regional Analysis |
|
1. Preface
1.1. Report Scope and Market Segmentation
1.2. Research Highlights
2. Assumptions and Research Methodology
2.1. Report Assumptions
2.2. Secondary Sources and Acronyms Used
2.3. Research Methodology
3. Executive Summary
3.1. Market Snapshot
3.2. Top Trends
4. Market Overview
4.1. Product Overview
4.2. Key Industry Developments
4.3. Market Indicators
4.4. Drivers and Restraints Snapshot Analysis
4.4.1. Drivers
4.4.2. Restraints
4.4.3. Opportunities
4.5. Global Bromine Market Analysis and Forecast
4.6. Porter’s Analysis
4.6.1. Threat of Substitutes
4.6.2. Bargaining Power of Buyers
4.6.3. Bargaining Power of Suppliers
4.6.4. Threat of New Entrants
4.6.5. Degree of Competition
4.7. Value Chain Analysis
4.8. Global Demand-Supply Scenario
4.9. Global Bromine Market Outlook, 2016
4.10. Regulatory Scenario
4.11. Global Bromine Market: SWOT Analysis
4.12. Bromine Market Prices, by Application, US$/Ton, 2016–2025
5. Bromine Market Analysis, by Application
5.1. Introduction
5.2. Key Findings
5.3. Global Bromine Market Value Share Analysis, by Application
5.4. Global Bromine Market Forecast and Analysis, by Application
5.4.1. Flame Retardant
5.4.2. Drilling Fluids
5.4.3. Biocides
5.4.4. Catalysts
5.4.5. Water Treatment
5.4.6. Others
5.5. Global Bromine Market Attractiveness Analysis, by Application
5.6. Market Trends
6. Global Bromine Market Analysis by Region
6.1. Global Market Size Growth Scenario, by Region, 2016
6.2. Key Findings
6.3. Global Bromine Market Value Share Analysis, by Region
6.4. Global Bromine Market Forecast, by Region
6.4.1. North America
6.4.2. Latin America
6.4.3. Europe
6.4.4. Asia Pacific
6.4.5. Middle East and Africa
6.5. Global Bromine Market Attractiveness Analysis, by Region
7. North America Bromine Market Analysis
7.1. Key Findings
7.2. North America Bromine Market Overview
7.3. North America Bromine Market Value Share Analysis, by Application
7.4. North America Bromine Market Forecast, by Application
7.5. North America Bromine Market Value Share Analysis, by Country
7.6. North America Bromine Market Forecast, by Country
7.6.1. U.S. Bromine Market Analysis
7.6.2. U.S. Bromine Market Forecast, by Application
7.6.3. Canada Bromine Market Analysis
7.6.4. Canada Bromine Market Forecast, by Application
7.7. North America Bromine Market Attractiveness Analysis, by Application
7.8. North America PEST Analysis
8. Latin America Bromine Market Analysis
8.1. Key Findings
8.2. Latin America Bromine Market Overview
8.3. Latin America Bromine Market Value Share Analysis, by Application
8.4. Latin America Bromine Market Forecast, by Application
8.5. Latin America Bromine Market Value Share Analysis, by Country
8.6. Latin America Bromine Market Forecast, by Country
8.6.1. Brazil Bromine Market Analysis
8.6.2. Brazil Bromine Market Forecast, by Application
8.6.3. Mexico Bromine Market Analysis
8.6.4. Mexico Bromine Market Forecast, by Application
8.6.5. Rest of Latin America Bromine Market Analysis
8.6.6. Rest of Latin America Bromine Market Forecast, by Application
8.7. Latin America Bromine Market Attractiveness Analysis, by Application
8.8. Latin America PEST Analysis
9. Europe Bromine Market Analysis
9.1. Key Findings
9.2. Europe Bromine Market Overview
9.3. Europe Bromine Market Value Share Analysis, by Application
9.4. Europe Bromine Market Forecast, by Application
9.5. Europe Bromine Market Value Share Analysis, by Country
9.6. Europe Bromine Market Forecast, by Country
9.6.1. Germany Bromine Market Analysis
9.6.2. Germany Bromine Market Forecast, by Application
9.6.3. France Bromine Market Analysis
9.6.4. France Bromine Market Forecast, by Application
9.6.5. U.K. Bromine Market Analysis
9.6.6. U.K. Bromine Market Forecast, by Application
9.6.7. Russia Bromine Market Analysis
9.6.8. Russia Bromine Market Forecast, by Application
9.6.9. Italy Bromine Market Analysis
9.6.10. Italy Bromine Market Forecast, by Application
9.6.11. Rest of Europe Bromine Market Analysis
9.6.12. Rest of Europe Bromine Market Forecast, by Application
9.7. Europe Bromine Market Attractiveness Analysis, by Application
9.8. Europe PEST Analysis
10. Asia Pacific Bromine Market Analysis
10.1. Key Findings
10.2. Asia Pacific Bromine Market Overview
10.3. Asia Pacific Bromine Market Value Share Analysis, by Application
10.4. Asia Pacific Bromine Market Forecast, by Application
10.5. Asia Pacific Bromine Market Value Share Analysis, by Country
10.6. Asia Pacific Bromine Market Forecast, by Country
10.6.1. China Bromine Market Analysis
10.6.2. China Bromine Market Forecast, by Application
10.6.3. Japan Bromine Market Analysis
10.6.4. Japan Bromine Market Forecast, by Application
10.6.5. India Bromine Market Analysis
10.6.6. India Bromine Market Forecast, by Application
10.6.7. ASEAN Bromine Market Analysis
10.6.8. ASEAN Bromine Market Forecast, by Application
10.6.9. Rest of Asia Pacific Bromine Market Analysis
10.6.10. Rest of Asia Pacific Bromine Market Forecast, by Application
10.7. Asia Pacific Bromine Market Attractiveness Analysis, by Application
10.8. Asia Pacific PEST Analysis
11. Middle East & Africa Bromine Market Analysis
11.1. Key Findings
11.2. Middle East & Africa Bromine Market Overview
11.3. Middle East & Africa Bromine Market Value Share Analysis, by Application
11.4. Middle East & Africa Bromine Market Forecast, by Application
11.5. Middle East & Africa Bromine Market Value Share Analysis, by Country
11.6. Middle East & Africa Bromine Market Forecast, by Country
11.6.1. GCC Bromine Market Analysis
11.6.2. GCC Bromine Market Forecast, by Application
11.6.3. South Africa Bromine Market Analysis
11.6.4. South Africa Bromine Market Forecast, by Application
11.6.5. Rest of Middle East & Africa Bromine Market Analysis
11.6.6. Rest of Middle East & Africa Bromine Market Forecast, by Application
11.7. Middle East & Africa Bromine Market Attractiveness Analysis, by Application
11.8. Middle East & Africa PEST Analysis
12. Competition Landscape
12.1. Bromine Market Share Analysis, by Company Production, 2016
12.2. Competition Matrix
12.3. Company Profiles
12.3.1. Albemarle Corporation
12.3.1.1. Company Description
12.3.1.2. Business Overview
12.3.1.3. Financial Details
12.3.1.4. Strategic Overview
12.3.1.5. Product Details
12.3.1.6. Recent Developments
12.3.2. Agrocel Industries LTD
12.3.2.1. Company Description
12.3.2.2. Business Overview
12.3.2.3. Product Details
12.3.3. Hindustan Salts Limited
12.3.3.1. Company Description
12.3.3.2. Business Overview
12.3.3.3. Financial Details
12.3.3.4. Strategic Overview
12.3.3.5. Product Details
12.3.3.6. Recent Developments
12.3.4. Israel Chemical Ltd. (ICL)
12.3.4.1. Company Description
12.3.4.2. Business Overview
12.3.4.3. Financial Details
12.3.4.4. Strategic Overview
12.3.4.5. Product Details
12.3.4.6. Recent Developments
12.3.5. Jordan Bromine Company Limited
12.3.5.1. Company Description
12.3.5.2. Business Overview
12.3.6. MORRE-TEC Industries
12.3.6.1. Company Description
12.3.6.2. Business Overview
12.3.7. Perekop Bromine
12.3.7.1. Company Description
12.3.7.2. Business Overview
12.3.8. Shandong Dadi Salt Chemical Group Co. Ltd.
12.3.8.1. Company Description
12.3.8.2. Product Details
12.3.9. Shandong Haiwang Chemical Co., Ltd.
12.3.9.1. Company Description
12.3.9.2. Business Overview
12.3.10. Shandong Yuyuan Group Co. Ltd.
12.3.10.1. Company Description
12.3.10.2. Product Details
12.3.11. Solaris ChemTech Industries Limited (SCIL)
12.3.11.1. Company Description
12.3.11.2. Business Overview
12.3.11.3. Product Details
12.3.12. TETRA Technologies, Inc.
12.3.12.1. Company Description
12.3.12.2. Business Overview
12.3.13. Tosoh Corporation
12.3.13.1. Company Description
12.3.13.2. Business Overview
12.3.13.3. Financial Details
12.3.13.4. Strategic Overview
13. Primary Research – Key Insights
List of Tables
Table 01(a): Global Bromine Market Volume (Tons) Forecast, by Application, 2016–2025
Table 01(b): Global Bromine Market Revenue (US$ Mn) Forecast, by Application, 2016–2025
Table 02: Global Bromine Market Volume (Tons) and Revenue (US$ Mn) Forecast, by Region, 2016–2025
Table 03(a): North America Bromine Market Volume (Tons) Forecast, by Application, 2016–2025
Table 03(b): North America Bromine Market Revenue (US$ Mn) Forecast, by Application, 2016–2025
Table 04: North America Bromine Market Volume (Tons) and Revenue (US$ Mn) Forecast, by Country, 2016–2025
Table 05(a): U.S. Bromine Market Volume (Tons) Forecast, by Application, 2016–2025
Table 05(b): U.S. Bromine Market Revenue (US$ Mn) Forecast, by Application, 2016–2025
Table 06(a): Canada Bromine Market Volume (Tons) Forecast, by Application, 2016–2025
Table 06(b): Canada Bromine Market Revenue (US$ Mn) Forecast, by Application, 2016–2025
Table 07(a): Latin America Bromine Market Volume (Tons) Forecast, by Application, 2016–2025
Table 07(b): Latin America Bromine Market Revenue (US$ Mn) Forecast, by Application, 2016–2025
Table 08: Latin America Bromine Market Volume (Tons) and Revenue (US$ Mn) Forecast, by Country/Sub-region, 2016–2025
Table 09(a): Brazil Bromine Market Volume (Tons) Forecast, by Application, 2016–2025
Table 09(b): Brazil Bromine Market Revenue (US$ Mn) Forecast, by Application, 2016–2025
Table 10(a): Mexico Bromine Market Volume (Tons) Forecast, by Application, 2016–2025
Table 10(b): Mexico Bromine Market Revenue (US$ Mn) Forecast, by Application, 2016–2025
Table 11(a): Rest of Latin America Bromine Market Volume (Tons) Forecast, by Application, 2016–2025
Table 11(b): Rest of Latin America Bromine Market Revenue (US$ Mn) Forecast, by Application, 2016–2025
Table 12(a): Europe Bromine Market Volume (Tons) Forecast, by Application, 2016–2025
Table 12(b): Europe Bromine Market Revenue (US$ Mn) Forecast, by Application, 2016–2025
Table 13(a): Europe Bromine Market Volume (Tons) and Revenue (US$ Mn) Forecast, by Country/Sub-region, 2016–2025
Table 13(b): Europe Bromine Market Volume (Tons) and Revenue (US$ Mn) Forecast, by Country/Sub-region, 2016–2025
Table 14(a): Germany Bromine Market Volume (Tons) Forecast, by Application, 2016–2025
Table 14(b): Germany Bromine Market Revenue (US$ Mn) Forecast, by Application, 2016–2025
Table 15(a): France Bromine Market Volume (Tons) Forecast, by Application, 2016–2025
Table 15(b): France Bromine Market Revenue (US$ Mn) Forecast, by Application, 2016–2025
Table 16(a): U.K. Bromine Market Volume (Tons) Forecast, by Application, 2016–2025
Table 16(b): U.K. Bromine Market Revenue (US$ Mn) Forecast, by Application, 2016–2025
Table 17(a): Russia Bromine Market Volume (Tons) Forecast, by Application, 2016–2025
Table 17(b): Russia Bromine Market Revenue (US$ Mn) Forecast, by Application, 2016–2025
Table 18(a): Italy Bromine Market Volume (Tons) Forecast, by Application, 2016–2025
Table 18(b): Italy Bromine Market Revenue (US$ Mn) Forecast, by Application, 2016–2025
Table 19(a): Rest of Europe Bromine Market Volume (Tons) Forecast, by Application, 2016–2025
Table 19(b): Rest of Europe Bromine Market Revenue (US$ Mn) Forecast, by Application, 2016–2025
Table 20(a): Asia Pacific Bromine Market Volume (Tons) Forecast, by Application, 2016–2025
Table 20(b): Asia Pacific Bromine Market Revenue (US$ Mn) Forecast, by Application, 2016–2025
Table 21: Asia Pacific Bromine Market Volume (Tons) and Revenue (US$ Mn) Forecast, by Country/Sub-region, 2016–2025
Table 22(a): China Bromine Market Volume (Tons) Forecast, by Application, 2016–2025
Table 22(b): China Bromine Market Revenue (US$ Mn) Forecast, by Application, 2016–2025
Table 23(a): Japan Bromine Market Volume (Tons) Forecast, by Application, 2016–2025
Table 23(b): Japan Bromine Market Revenue (US$ Mn) Forecast, by Application, 2016–2025
Table 24(a): India Bromine Market Volume (Tons) Forecast, by Application, 2016–2025
Table 24(b): India Bromine Market Revenue (US$ Mn) Forecast, by Application, 2016–2025
Table 25(a): ASEAN Bromine Market Volume (Tons) Forecast, by Application, 2016–2025
Table 25(b): ASEAN Bromine Market Revenue (US$ Mn) Forecast, by Application, 2016–2025
Table 26(a): Rest of Asia Pacific Bromine Market Volume (Tons) Forecast, by Application, 2016–2025
Table 26(b): Rest of Asia Pacific Bromine Market Revenue (US$ Mn) Forecast, by Application, 2016–2025
Table 27(a): Middle East & Africa Bromine Market Volume (Tons) Forecast, by Application, 2016–2025
Table 27(b): Middle East & Africa Bromine Market Revenue (US$ Mn) Forecast, by Application, 2016–2025
Table 28: MEA Bromine Market Volume (Tons) and Revenue (US$ Mn) Forecast, by Country/Sub-region, 2016–2025
Table 29(a): GCC Bromine Market Volume (Tons) Forecast, by Application, 2016–2025
Table 29(b): GCC Bromine Market Revenue (US$ Mn) Forecast, by Application, 2016–2025
Table 30(a): South Africa Bromine Market Volume (Tons) Forecast, by Application, 2016–2025
Table 30(b): South Africa Bromine Market Revenue (US$ Mn) Forecast, by Application, 2016–2025
Table 31(a): Rest of Middle East & Africa Bromine Market Volume (Tons) Forecast, by Application, 2016–2025
Table 31(b): Rest of Middle East & Africa Bromine Market Revenue (US$ Mn) Forecast, by Application, 2016–2025
List of Figures
Figure 01: Market Snapshot
Figure 02: Share held by Asia Pacific in Terms of Consumption, 2016–2025
Figure 03: Global Bromine Market Volume (Tons) and Size (US$ Mn) Analysis, 2016–2025
Figure 04: Global Bromine Market Size and Volume, Y-o-Y Growth Projection, 2017–2025
Figure 05: Global Bromine Market Value Share, by Application, 2016
Figure 06: Global Bromine Market Volume Share, by Region, 2016
Figure 07: Prices of Bromine, by Application, US$/Ton, 2016–2025
Figure 08: Prices of Bromine, by Region, US$/Ton, 2016–2025
Figure 09: Global Bromine Market Value Share Analysis, by Application, 2016 and 2025
Figure 10: Global Bromine Market Revenue (US$ Mn) and Volume (Tons) Analysis for Flame Retardants, 2016–2025
Figure 11: Global Bromine Market Revenue (US$ Mn) and Volume (Tons) Analysis for Drilling Fluids, 2016–2025
Figure 12: Global Bromine Market Revenue (US$ Mn) and Volume (Tons) Analysis for Biocides, 2016–2025
Figure 13: Global Bromine Market Revenue (US$ Mn) and Volume (Tons) Analysis for Catalysts, 2016–2025
Figure 14: Global Bromine Market Revenue (US$ Mn) and Volume (Tons) Analysis for Water Treatment, 2016–2025
Figure 15: Global Bromine Market Revenue (US$ Mn) and Volume (Tons) Analysis for Others, 2016–2025
Figure 16: Global Bromine Market Attractiveness Analysis, by Application
Figure 17: Global Bromine Market Value Share Analysis, by Region, 2016 and 2025
Figure 18: Global Bromine Market Attractiveness Analysis, by Region
Figure 19: North America Bromine Market Size (US$ Mn) and Volume (Tons) Forecast, 2016–2025
Figure 20: North America Bromine Market Attractiveness Analysis, by Country
Figure 21: North America Bromine Market Value Share Analysis, by Application, 2016 and 2025
Figure 22: North America Bromine Market Value Share Analysis, by Country, 2016 and 2025
Figure 23: U.S. Bromine Market Value Share Analysis, by Application, 2016 and 2025
Figure 24: U.S. Bromine Market Size (US$ Mn) and Volume (Tons) Forecast, 2016–2025
Figure 25: Canada Bromine Market Value Share Analysis, by Application, 2016 and 2025
Figure 26: Canada Bromine Market Size (US$ Mn) and Volume (Tons) Forecast, 2016–2025
Figure 27: North America Bromine Market Attractiveness Analysis, by Application
Figure 28: Latin America Bromine Market Volume (Tons) and Size (US$ Mn) Forecast, 2016–2025
Figure 29: Latin America Bromine Market Attractiveness Analysis, by Country/Sub-region
Figure 30: Latin America Bromine Market Value Share Analysis, by Application, 2016 and 2025
Figure 31: Latin America Bromine Market Value Share Analysis, by Country/Sub-region, 2016 and 2025
Figure 32: Brazil Bromine Market Value Share Analysis, by Application, 2016 and 2025
Figure 33: Brazil Bromine Market Volume (Tons) and Size (US$ Mn) Forecast, 2016–2025
Figure 34: Mexico Bromine Market Value Share Analysis, by Application, 2016 and 2025
Figure 35: Mexico Bromine Market Volume (Tons) and Size (US$ Mn) Forecast, 2016–2025
Figure 36: Rest of Latin America Bromine Market Value Share Analysis, by Application, 2016 and 2025
Figure 37: Rest of Latin America Bromine Market Volume (Tons) and Size (US$ Mn) Forecast, 2016–2025
Figure 38: Latin America Bromine Market Attractiveness Analysis, by Application
Figure 39: Europe Bromine Market Volume (Tons) and Size (US$ Mn) Forecast, 2016–2025
Figure 40: Europe Bromine Market Attractiveness Analysis, by Country/Sub-region
Figure 41: Europe Bromine Market Value Share Analysis, by Application, 2016 and 2025
Figure 42: Europe Bromine Market Value Share Analysis, by Country/Sub-region, 2016 and 2025
Figure 43: Germany Bromine Market Value Share Analysis, by Application, 2016 and 2025
Figure 44: Germany Bromine Market Volume (Tons) and Size (US$ Mn) Forecast, 2016–2025
Figure 45: France Bromine Market Value Share Analysis, by Application, 2016 and 2025
Figure 46: France Bromine Market Volume (Tons) and Size (US$ Mn) Forecast, 2016–2025
Figure 47: U.K. Bromine Market Value Share Analysis, by Application, 2016 and 2025
Figure 48: U.K. Bromine Market Volume (Tons) and Size (US$ Mn) Forecast, 2016–2025
Figure 49: Russia Bromine Market Value Share Analysis, by Application, 2016 and 2025
Figure 50: Russia Bromine Market Volume (Tons) and Size (US$ Mn) Forecast, 2016–2025
Figure 51: Italy Bromine Market Value Share Analysis, by Application, 2016 and 2025
Figure 52: Italy Bromine Market Volume (Tons) and Size (US$ Mn) Forecast, 2016–2025
Figure 53: Rest of Europe Bromine Market Value Share Analysis, by Application, 2016 and 2025
Figure 54: Rest of Europe Bromine Market Volume (Tons) and Size (US$ Mn) Forecast, 2016–2025
Figure 55: Europe Bromine Market Attractiveness Analysis, by Application
Figure 56: Asia Pacific Bromine Market Volume (Tons) and Size (US$ Mn) Forecast, 2016–2025
Figure 57: Asia Pacific Bromine Market Attractiveness Analysis, by Country/Sub-region
Figure 58: Asia Pacific Bromine Market Value Share Analysis, by Application, 2016 and 2025
Figure 59: Asia Pacific Bromine Market Value Share Analysis, by Country/Sub-region, 2016 and 2025
Figure 60: China Bromine Market Value Share Analysis, by Application, 2016 and 2025
Figure 61: China Bromine Market Volume (Tons) and Size (US$ Mn) Forecast, 2016–2025
Figure 62: Japan Bromine Market Value Share Analysis, by Application, 2016 and 2025
Figure 63: Japan Bromine Market Volume (Tons) and Size (US$ Mn) Forecast, 2016–2025
Figure 64: India Bromine Market Value Share Analysis, by Application, 2016 and 2025
Figure 65: India Bromine Market Volume (Tons) and Size (US$ Mn) Forecast, 2016–2025
Figure 66: ASEAN Bromine Market Value Share Analysis, by Application, 2016 and 2025
Figure 67: ASEAN Bromine Market Volume (Tons) and Size (US$ Mn) Forecast, 2016–2025
Figure 68: Rest of Asia Pacific Bromine Market Value Share Analysis, by Application, 2016 and 2025
Figure 69: Rest of Asia Pacific Bromine Market Volume (Tons) and Size (US$ Mn) Forecast, 2016–2025
Figure 70: Asia Pacific Bromine Market Attractiveness Analysis, by Application
Figure 71: MEA Bromine Market Volume (Tons) and Size (US$ Mn) Forecast, 2016–2025
Figure 72: MEA Bromine Market Attractiveness Analysis, by Country/Sub-region
Figure 73: MEA Bromine Market Value Share Analysis, by Application, 2016 and 2025
Figure 74: MEA Bromine Market Value Share Analysis, by Country/Sub-region, 2016 and 2025
Figure 75: GCC Bromine Market Value Share Analysis, by Application, 2016 and 2025
Figure 76: GCC Bromine Market Volume (Tons) and Size (US$ Mn) Forecast, 2016–2025
Figure 77: South Africa Bromine Market Value Share Analysis, by Application, 2016 and 2025
Figure 78: South Africa Bromine Market Volume (Tons) and Size (US$ Mn) Forecast, 2016–2025
Figure 79: Rest of Middle East & Africa Bromine Market Value Share Analysis, by Application, 2016 and 2025
Figure 80: Rest of Middle East & Africa Bromine Market Volume (Tons) and Size (US$ Mn) Forecast, 2016–2025
Figure 81: Middle East & Africa Bromine Market Attractiveness Analysis, by Application
Figure 82: Estimated Bromine Market Share Analysis, by Company Production (2016)
Copyright © Transparency Market Research, Inc. All Rights reserved
Trust Online


Bromine Market