
An incubator is an equipment utilized for maintaining biological samples such as cell lines or microbial cultures in optimum environment and temperatures. Carbon dioxide incubators fall under major types of incubators, used for offering a stable environment for growth of cell cultures by controlling humidity, temperature, and O2 & CO2 concentrations at an ideal level inside the chamber. Major application areas of carbon dioxide incubators include laboratory research and clinical applications, and in vitro fertilization.
Demand for Carbon Dioxide Incubators to be fuelled by Surging Adoption of Genetically Engineered Products
Surging adoption of genetically engineered products that are effective in therapeutic diagnosis is fuelling demand for tissue and cell culture equipment & supplies, such as carbon dioxide incubators. In addition, several technological advancements and emergence of highly automated instrumentation are supporting researchers in conducting experiments more efficiently. Carbon dioxide incubators are finding extensive applications in cancer research, stem cell research, tissue engineering, embryonic cell research, cultivation of mammalian cells, and neuroscience.
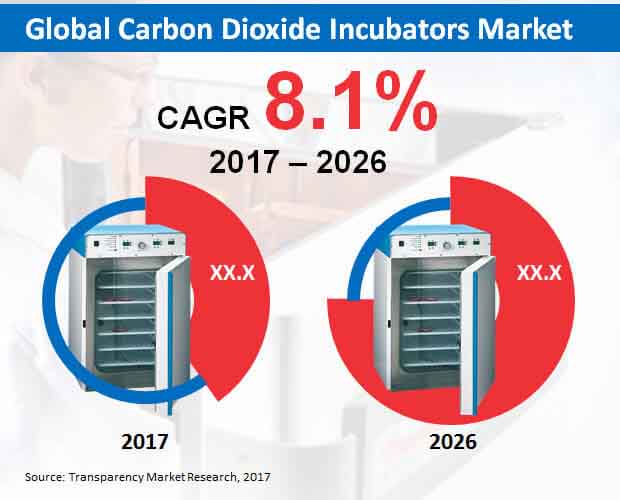
A recently compiled report by Transparency Market Research (TMR) estimates the global carbon dioxide incubators market to ride on a spectacular CAGR throughout the forecast period, 2017 to 2026. The global market for carbon dioxide incubators is estimated to surpass revenues worth US$ 250 Mn by 2026-end.
APEJ will Remain Fastest Expanding Market for Carbon Dioxide Incubators
Asia-Pacific excluding Japan (APEJ) will continue to be the fastest expanding market for carbon dioxide incubators. This robust expansion of the market in APEJ is primarily attributed to increasing number of research and development facilities in pharmaceutical and biomedical sectors. Several research facilities have been migrated to APEJ countries such as Singapore, India, and South Korea, thereby accelerating demand for incubators. In addition, growing prevalence of crop research in many APEJ countries is further expected to impact demand for carbon dioxide incubators in this region.
Increasing research & development activities in biotechnology and life science sectors has driven the demand for carbon dioxide incubators in North America. Manufacturers in North America are increasingly shifting their focus toward the provision of carbon dioxide incubators based on unique & specific requirements. North America is anticipated to remain the largest market for carbon dioxide incubators, in terms of revenues.
Water Jacketed Carbon Dioxide Incubators to Remain Dominant among Products in the Market
Demand for water jacketed carbon dioxide incubators has witnessed a tremendous surge in biomedical and pharmaceutical industries, on the back of their design improvements and temperature stability. In terms of revenues as well as sales expansion, water jacketed carbon dioxide incubators will remain dominant among products in the market. Revenues from sales of air jacketed carbon dioxide incubators and direct heat carbon dioxide incubators are expected to remain sluggish throughout the forecast period.
As various laboratories and clinics are witnessing a paradigm shift toward automation, demand for carbon dioxide incubators is expected to rise significantly in laboratory research & clinical applications. This application segment is expected to be the major contributor to growth of the market, in terms of revenues. However, revenues from in vitro fertilization application of carbon dioxide incubators are projected to increase at a comparatively higher CAGR than those from laboratory research & clinical application through 2026.
Sales of above 100L & below 200L capacity carbon dioxide incubators will register a relatively higher CAGR than below 100L, and above 200L capacities of carbon dioxide incubators. In addition, sales of above 200L capacity is also expected to register a splendid expansion, and this capacity segment of carbon dioxide incubators will remain the most lucrative over the forecast period.
Competition Tracking
Key market participants identified in the report include Thermo Fisher Scientific Inc., Panasonic Healthcare Co., Ltd., Eppendorf AG, Sheldon Manufacturing, Inc., BINDER GmbH, Memmert GmbH + Co. KG, Bellco Glass, Inc., LEEC Limited, and Shanghai Boxun Medical Biological Instrument Corp.
|
Region |
|
|
Product Type |
|
|
Capacity |
|
|
Application |
|
1. Global Economic Outlook
2. Global Carbon Dioxide Incubators Market - Executive Summary
3. Global Carbon Dioxide Incubators Market Overview
3.1. Introduction
3.1.1. Global Carbon Dioxide Incubators Market Taxonomy
3.1.2. Global Carbon Dioxide Incubators Market Definition
3.2. Global Carbon Dioxide Incubators Market Size (US$ Mn) and Forecast, 2012-2026
3.2.1. Global Carbon Dioxide Incubators Market Y-o-Y Growth
3.3. Global Carbon Dioxide Incubators Market Dynamics
3.4. Supply Chain
3.5. Cost Structure
3.6. Pricing Analysis
3.7. PEST Analysis
3.8. Product Life Cycle Analysis
3.9. Key Regulations - US
3.10. List of Distributors
3.11. Key Participants Market Presence (Intensity Map) By Region
4. Global Carbon Dioxide Incubators Market Analysis and Forecast 2012-2026
4.1. Global Carbon Dioxide Incubators Market Size and Forecast By Product Type, 2012-2026
4.1.1. Water Jacketed CO2 Incubators Market Size and Forecast, 2012-2026
4.1.1.1. Revenue (US$ Mn) Comparison, By Region
4.1.1.2. Market Share Comparison, By Region
4.1.1.3. Y-o-Y growth Comparison, By Region
4.1.2. Air Jacketed CO2 Incubators Market Size and Forecast, 2012-2026
4.1.2.1. Revenue (US$ Mn) Comparison, By Region
4.1.2.2. Market Share Comparison, By Region
4.1.2.3. Y-o-Y growth Comparison, By Region
4.1.3. Direct Heat CO2 Incubators Market Size and Forecast, 2012-2026
4.1.3.1. Revenue (US$ Mn) Comparison, By Region
4.1.3.2. Market Share Comparison, By Region
4.1.3.3. Y-o-Y growth Comparison, By Region
4.2. Global Carbon Dioxide Incubators Market Size and Forecast By Capacity, 2012-2026
4.2.1. Below 100L Market Size and Forecast, 2012-2026
4.2.1.1. Revenue (US$ Mn) Comparison, By Region
4.2.1.2. Market Share Comparison, By Region
4.2.1.3. Y-o-Y growth Comparison, By Region
4.2.2. Above 100L and Below 200L Market Size and Forecast, 2012-2026
4.2.2.1. Revenue (US$ Mn) Comparison, By Region
4.2.2.2. Market Share Comparison, By Region
4.2.2.3. Y-o-Y growth Comparison, By Region
4.2.3. Above 200L Market Size and Forecast, 2012-2026
4.2.3.1. Revenue (US$ Mn) Comparison, By Region
4.2.3.2. Market Share Comparison, By Region
4.2.3.3. Y-o-Y growth Comparison, By Region
4.3. Global Carbon Dioxide Incubators Market Size and Forecast By Application, 2012-2026
4.3.1. Laboratory Research and Clinical Applications Market Size and Forecast, 2012-2026
4.3.1.1. Revenue (US$ Mn) Comparison, By Region
4.3.1.2. Market Share Comparison, By Region
4.3.1.3. Y-o-Y growth Comparison, By Region
4.3.2. In Vitro Fertilisation Market Size and Forecast, 2012-2026
4.3.2.1. Revenue (US$ Mn) Comparison, By Region
4.3.2.2. Market Share Comparison, By Region
4.3.2.3. Y-o-Y growth Comparison, By Region
4.3.3. Other Applications Market Size and Forecast, 2012-2026
4.3.3.1. Revenue (US$ Mn) Comparison, By Region
4.3.3.2. Market Share Comparison, By Region
4.3.3.3. Y-o-Y growth Comparison, By Region
5. North America Carbon Dioxide Incubators Market Size and Forecast, 2012-2026
5.1. North America Outlook
5.2. North America Parent Market Outlook
5.3. North America Target Market Outlook
5.4. Revenue (US$ Mn) Comparison, By Country
5.4.1. US Market Size and Forecast (US$ Mn), 2012-2026
5.4.2. Canada Market Size and Forecast (US$ Mn), 2012-2026
5.5. Revenue (US$ Mn) Comparison, By Product Type
5.6. Revenue (US$ Mn) Comparison, By Capacity
5.7. Revenue (US$ Mn) Comparison, By Application
6. Latin America Carbon Dioxide Incubators Market Size and Forecast, 2012-2026
6.1. Latin America Outlook
6.2. Latin America Parent Market Outlook
6.3. Latin America Target Market Outlook
6.4. Revenue (US$ Mn) Comparison, By Country
6.4.1. Brazil Market Size and Forecast (US$ Mn), 2012-2026
6.4.2. Mexico Market Size and Forecast (US$ Mn), 2012-2026
6.4.3. Rest of Latin America Market Size and Forecast (US$ Mn), 2012-2026
6.5. Revenue (US$ Mn) Comparison, By Product Type
6.6. Revenue (US$ Mn) Comparison, By Capacity
6.7. Revenue (US$ Mn) Comparison, By Application
7. Europe Carbon Dioxide Incubators Market Size and Forecast, 2012-2026
7.1. Europe Outlook
7.2. Europe Parent Market Outlook
7.3. Europe Target Market Outlook
7.4. Revenue (US$ Mn) Comparison, By Country
7.4.1. Germany Market Size and Forecast (US$ Mn), 2012-2026
7.4.2. UK Market Size and Forecast (US$ Mn), 2012-2026
7.4.3. France Market Size and Forecast (US$ Mn), 2012-2026
7.4.4. Spain Market Size and Forecast (US$ Mn), 2012-2026
7.4.5. Italy Market Size and Forecast (US$ Mn), 2012-2026
7.4.6. Rest of Europe Market Size and Forecast (US$ Mn), 2012-2026
7.5. Revenue (US$ Mn) Comparison, By Product Type
7.6. Revenue (US$ Mn) Comparison, By Capacity
7.7. Revenue (US$ Mn) Comparison, By Application
8. Japan Carbon Dioxide Incubators Market Size and Forecast, 2012-2026
8.1. Japan Outlook
8.2. Japan Parent Market Outlook
8.3. Japan Target Market Outlook
8.4. Revenue (US$ Mn) Comparison, By Country
8.4.1. Japan Market Size and Forecast (US$ Mn), 2012-2026
8.5. Revenue (US$ Mn) Comparison, By Product Type
8.6. Revenue (US$ Mn) Comparison, By Capacity
8.7. Revenue (US$ Mn) Comparison, By Application
9. APEJ Carbon Dioxide Incubators Market Size and Forecast, 2012-2026
9.1. APEJ Outlook
9.2. APEJ Parent Market Outlook
9.3. APEJ Target Market Outlook
9.4. Revenue (US$ Mn) Comparison, By Country
9.4.1. China Market Size and Forecast (US$ Mn), 2012-2026
9.4.2. India Market Size and Forecast (US$ Mn), 2012-2026
9.4.3. Thailand Market Size and Forecast (US$ Mn), 2012-2026
9.4.4. Singapore Market Size and Forecast (US$ Mn), 2012-2026
9.4.5. Australia Market Size and Forecast (US$ Mn), 2012-2026
9.4.6. Rest of APEJ Market Size and Forecast (US$ Mn), 2012-2026
9.5. Revenue (US$ Mn) Comparison, By Product Type
9.6. Revenue (US$ Mn) Comparison, By Capacity
9.7. Revenue (US$ Mn) Comparison, By Application
10. MEA Carbon Dioxide Incubators Market Size and Forecast, 2012-2026
10.1. MEA Outlook
10.2. MEA Parent Market Outlook
10.3. MEA Target Market Outlook
10.4. Revenue (US$ Mn) Comparison, By Country
10.4.1. GCC Countries Market Size and Forecast (US$ Mn), 2012-2026
10.4.2. South Africa Market Size and Forecast (US$ Mn), 2012-2026
10.4.3. Israel Market Size and Forecast (US$ Mn), 2012-2026
10.4.4. Rest of MEA Market Size and Forecast (US$ Mn), 2012-2026
10.5. Revenue (US$ Mn) Comparison, By Product Type
10.6. Revenue (US$ Mn) Comparison, By Capacity
10.7. Revenue (US$ Mn) Comparison, By Application
11. Global Carbon Dioxide Incubators Market Company Share, Competition Landscape and Company Profiles
11.1. Company Share Analysis
11.2. Competition Landscape
11.3. Company Profiles
11.3.1. Thermo Fisher Scientific Inc.
11.3.2. Panasonic Healthcare Co., Ltd.
11.3.3. Eppendorf AG
11.3.4. Sheldon Manufacturing, Inc.
11.3.5. BINDER GmbH
11.3.6. Memmert GmbH + Co. KG
11.3.7. Bellco Glass, Inc.
11.3.8. LEEC Limited
11.3.9. Shanghai Boxun Medical Biological Instrument Corp.
11.4. Key Takeaways
12. Research Methodology
13. Disclaimer
List of Tables
TABLE 1 Global Carbon Dioxide Incubators Market Value (US$ Mn), 2012-2017
TABLE 2 Global Carbon Dioxide Incubators Market Value (US$ Mn), 2018-2026
TABLE 3 Global Carbon Dioxide Incubators Market Value (US$ Mn) and Y-o-Y, 2017-2026
TABLE 4 Global Water Jacketed CO2 Incubators Segment Value (US$ Mn), By Region 2012-2017
TABLE 5 Global Water Jacketed CO2 Incubators Segment Value (US$ Mn), By Region 2018-2026
TABLE 6 Global Water Jacketed CO2 Incubators Segment Market Share, By Region 2012-2017
TABLE 7 Global Water Jacketed CO2 Incubators Segment Market Share, By Region 2018-2026
TABLE 8 Global Water Jacketed CO2 Incubators Segment Y-o-Y, By Region 2017-2026
TABLE 9 Global Air Jacketed CO2 Incubators Segment Value (US$ Mn), By Region 2012-2017
TABLE 10 Global Air Jacketed CO2 Incubators Segment Value (US$ Mn), By Region 2018-2026
TABLE 11 Global Air Jacketed CO2 Incubators Segment Market Share, By Region 2012-2017
TABLE 12 Global Air Jacketed CO2 Incubators Segment Market Share, By Region 2018-2026
TABLE 13 Global Air Jacketed CO2 Incubators Segment Y-o-Y, By Region 2017-2026
TABLE 14 Global Direct Heat CO2 Incubators Segment Value (US$ Mn), By Region 2012-2017
TABLE 15 Global Direct Heat CO2 Incubators Segment Value (US$ Mn), By Region 2018-2026
TABLE 16 Global Direct Heat CO2 Incubators Segment Market Share, By Region 2012-2017
TABLE 17 Global Direct Heat CO2 Incubators Segment Market Share, By Region 2018-2026
TABLE 18 Global Direct Heat CO2 Incubators Segment Y-o-Y, By Region 2017-2026
TABLE 19 Global Below 100L Segment Value (US$ Mn), By Region 2012-2017
TABLE 20 Global Below 100L Segment Value (US$ Mn), By Region 2018-2026
TABLE 21 Global Below 100L Segment Market Share, By Region 2012-2017
TABLE 22 Global Below 100L Segment Market Share, By Region 2018-2026
TABLE 23 Global Below 100L Segment Y-o-Y, By Region 2017-2026
TABLE 24 Global Above 100L and Below 200L Segment Value (US$ Mn), By Region 2012-2017
TABLE 25 Global Above 100L and Below 200L Segment Value (US$ Mn), By Region 2018-2026
TABLE 26 Global Above 100L and Below 200L Segment Market Share, By Region 2012-2017
TABLE 27 Global Above 100L and Below 200L Segment Market Share, By Region 2018-2026
TABLE 28 Global Above 100L and Below 200L Segment Y-o-Y, By Region 2017-2026
TABLE 29 Global Above 200L Segment Value (US$ Mn), By Region 2012-2017
TABLE 30 Global Above 200L Segment Value (US$ Mn), By Region 2018-2026
TABLE 31 Global Above 200L Segment Market Share, By Region 2012-2017
TABLE 32 Global Above 200L Segment Market Share, By Region 2018-2026
TABLE 33 Global Above 200L Segment Y-o-Y, By Region 2017-2026
TABLE 34 Global Laboratory Research and Clinical Applications Segment Value (US$ Mn), By Region 2012-2017
TABLE 35 Global Laboratory Research and Clinical Applications Segment Value (US$ Mn), By Region 2018-2026
TABLE 36 Global Laboratory Research and Clinical Applications Segment Market Share, By Region 2012-2017
TABLE 37 Global Laboratory Research and Clinical Applications Segment Market Share, By Region 2018-2026
TABLE 38 Global Laboratory Research and Clinical Applications Segment Y-o-Y, By Region 2017-2026
TABLE 39 Global In Vitro Fertilisation Segment Value (US$ Mn), By Region 2012-2017
TABLE 40 Global In Vitro Fertilisation Segment Value (US$ Mn), By Region 2018-2026
TABLE 41 Global In Vitro Fertilisation Segment Market Share, By Region 2012-2017
TABLE 42 Global In Vitro Fertilisation Segment Market Share, By Region 2018-2026
TABLE 43 Global In Vitro Fertilisation Segment Y-o-Y, By Region 2017-2026
TABLE 44 Global Other Applications Segment Value (US$ Mn), By Region 2012-2017
TABLE 45 Global Other Applications Segment Value (US$ Mn), By Region 2018-2026
TABLE 46 Global Other Applications Segment Market Share, By Region 2012-2017
TABLE 47 Global Other Applications Segment Market Share, By Region 2018-2026
TABLE 48 Global Other Applications Segment Y-o-Y, By Region 2017-2026
TABLE 49 North America Current Expenditure on Health, (% of GDP), by Country, 2010 – 2016
TABLE 50 North America Per Capita Health Expenditure (US$ PPP), by Country, 2010 - 2016
TABLE 51 North America Per Capita Healthcare Expenditure Y-o-Y Growth (in Real terms %), by Country, 2010 - 2016
TABLE 52 North America Out-of-Pocket Healthcare Expenditure, % of Healthcare Expenditure, by Country, 2010 - 2016
TABLE 53 North America Per Capita Healthcare Expenditure (at Current Price, in US$), by Country, 2010 - 2016
TABLE 54 North America Carbon Dioxide Incubators Market Value (US$ Mn), By Country 2012-2017
TABLE 55 North America Carbon Dioxide Incubators Market Value (US$ Mn), By Country 2018-2026
TABLE 56 North America Carbon Dioxide Incubators Market Value (US$ Mn), By Product Type 2012-2017
TABLE 57 North America Carbon Dioxide Incubators Market Value (US$ Mn), By Product Type 2018-2026
TABLE 58 North America Carbon Dioxide Incubators Market Value (US$ Mn), By Capacity 2012-2017
TABLE 59 North America Carbon Dioxide Incubators Market Value (US$ Mn), By Capacity 2018-2026
TABLE 60 North America Carbon Dioxide Incubators Market Value (US$ Mn), By Application 2012-2017
TABLE 61 North America Carbon Dioxide Incubators Market Value (US$ Mn), By Application 2018-2026
TABLE 62 Latin America Current Expenditure on Health, (% of GDP), by Country, 2010 – 2016
TABLE 63 Latin America Per Capita Health Expenditure (US$ PPP), by Country, 2010 - 2016
TABLE 64 Latin America Per Capita Healthcare Expenditure Y-o-Y Growth (in Real terms %), by Country, 2010 - 2016
TABLE 65 Latin America Out-of-Pocket Healthcare Expenditure, % of Healthcare Expenditure, by Country, 2010 - 2016
TABLE 66 Latin America Per Capita Healthcare Expenditure (at Current Price, in US$), by Country, 2010 - 2016
TABLE 67 Latin America Carbon Dioxide Incubators Market Value (US$ Mn), By Country 2012-2017
TABLE 68 Latin America Carbon Dioxide Incubators Market Value (US$ Mn), By Country 2018-2026
TABLE 69 Latin America Carbon Dioxide Incubators Market Value (US$ Mn), By Product Type 2012-2017
TABLE 70 Latin America Carbon Dioxide Incubators Market Value (US$ Mn), By Product Type 2018-2026
TABLE 71 Latin America Carbon Dioxide Incubators Market Value (US$ Mn), By Capacity 2012-2017
TABLE 72 Latin America Carbon Dioxide Incubators Market Value (US$ Mn), By Capacity 2018-2026
TABLE 73 Latin America Carbon Dioxide Incubators Market Value (US$ Mn), By Application 2012-2017
TABLE 74 Latin America Carbon Dioxide Incubators Market Value (US$ Mn), By Application 2018-2026
TABLE 75 Europe Current Expenditure on Health, (% of GDP), by Country, 2010 – 2016
TABLE 76 Europe Per Capita Health Expenditure (US$ PPP), by Country, 2010 - 2016
TABLE 77 Europe Per Capita Healthcare Expenditure Y-o-Y Growth (in Real terms %), by Country, 2010 - 2016
TABLE 78 Europe Out-of-Pocket Healthcare Expenditure, % of Healthcare Expenditure, by Country, 2010 - 2016
TABLE 79 Europe Per Capita Healthcare Expenditure (at Current Price, in US$), by Country, 2010 - 2016
TABLE 80 Europe Carbon Dioxide Incubators Market Value (US$ Mn), By Country 2012-2017
TABLE 81 Europe Carbon Dioxide Incubators Market Value (US$ Mn), By Country 2018-2026
TABLE 82 Europe Carbon Dioxide Incubators Market Value (US$ Mn), By Product Type 2012-2017
TABLE 83 Europe Carbon Dioxide Incubators Market Value (US$ Mn), By Product Type 2018-2026
TABLE 84 Europe Carbon Dioxide Incubators Market Value (US$ Mn), By Capacity 2012-2017
TABLE 85 Europe Carbon Dioxide Incubators Market Value (US$ Mn), By Capacity 2018-2026
TABLE 86 Europe Carbon Dioxide Incubators Market Value (US$ Mn), By Application 2012-2017
TABLE 87 Europe Carbon Dioxide Incubators Market Value (US$ Mn), By Application 2018-2026
TABLE 88 Japan Current Expenditure on Health, (% of GDP), by Country, 2010 – 2016
TABLE 89 Japan Per Capita Health Expenditure (US$ PPP), by Country, 2010 - 2016
TABLE 90 Japan Per Capita Healthcare Expenditure Y-o-Y Growth (in Real terms %), by Country, 2010 - 2016
TABLE 91 Japan Out-of-Pocket Healthcare Expenditure, % of Healthcare Expenditure, by Country, 2010 - 2016
TABLE 92 Japan Per Capita Healthcare Expenditure (at Current Price, in US$), by Country, 2010 - 2016
TABLE 93 Japan Carbon Dioxide Incubators Market Value (US$ Mn), By Country 2012-2017
TABLE 94 Japan Carbon Dioxide Incubators Market Value (US$ Mn), By Country 2018-2026
TABLE 95 Japan Carbon Dioxide Incubators Market Value (US$ Mn), By Product Type 2012-2017
TABLE 96 Japan Carbon Dioxide Incubators Market Value (US$ Mn), By Product Type 2018-2026
TABLE 97 Japan Carbon Dioxide Incubators Market Value (US$ Mn), By Capacity 2012-2017
TABLE 98 Japan Carbon Dioxide Incubators Market Value (US$ Mn), By Capacity 2018-2026
TABLE 99 Japan Carbon Dioxide Incubators Market Value (US$ Mn), By Application 2012-2017
TABLE 100 Japan Carbon Dioxide Incubators Market Value (US$ Mn), By Application 2018-2026
TABLE 101 APEJ Current Expenditure on Health, (% of GDP), by Country, 2010 – 2016
TABLE 102 APEJ Per Capita Health Expenditure (US$ PPP), by Country, 2010 - 2016
TABLE 103 APEJ Per Capita Healthcare Expenditure Y-o-Y Growth (in Real terms %), by Country, 2010 - 2016
TABLE 104 APEJ Out-of-Pocket Healthcare Expenditure, % of Healthcare Expenditure, by Country, 2010 - 2016
TABLE 105 APEJ Per Capita Healthcare Expenditure (at Current Price, in US$), by Country, 2010 - 2016
TABLE 106 APEJ Carbon Dioxide Incubators Market Value (US$ Mn), By Country 2012-2017
TABLE 107 APEJ Carbon Dioxide Incubators Market Value (US$ Mn), By Country 2018-2026
TABLE 108 APEJ Carbon Dioxide Incubators Market Value (US$ Mn), By Product Type 2012-2017
TABLE 109 APEJ Carbon Dioxide Incubators Market Value (US$ Mn), By Product Type 2018-2026
TABLE 110 APEJ Carbon Dioxide Incubators Market Value (US$ Mn), By Capacity 2012-2017
TABLE 111 APEJ Carbon Dioxide Incubators Market Value (US$ Mn), By Capacity 2018-2026
TABLE 112 APEJ Carbon Dioxide Incubators Market Value (US$ Mn), By Application 2012-2017
TABLE 113 APEJ Carbon Dioxide Incubators Market Value (US$ Mn), By Application 2018-2026
TABLE 114 MEA Current Expenditure on Health, (% of GDP), by Country, 2010 – 2016
TABLE 115 MEA Per Capita Health Expenditure (US$ PPP), by Country, 2010 - 2016
TABLE 116 MEA Per Capita Healthcare Expenditure Y-o-Y Growth (in Real terms %), by Country, 2010 - 2016
TABLE 117 MEA Out-of-Pocket Healthcare Expenditure, % of Healthcare Expenditure, by Country, 2010 - 2016
TABLE 118 MEA Per Capita Healthcare Expenditure (at Current Price, in US$), by Country, 2010 - 2016
TABLE 119 MEA Carbon Dioxide Incubators Market Value (US$ Mn), By Country 2012-2017
TABLE 120 MEA Carbon Dioxide Incubators Market Value (US$ Mn), By Country 2018-2026
TABLE 121 MEA Carbon Dioxide Incubators Market Value (US$ Mn), By Product Type 2012-2017
TABLE 122 MEA Carbon Dioxide Incubators Market Value (US$ Mn), By Product Type 2018-2026
TABLE 123 MEA Carbon Dioxide Incubators Market Value (US$ Mn), By Capacity 2012-2017
TABLE 124 MEA Carbon Dioxide Incubators Market Value (US$ Mn), By Capacity 2018-2026
TABLE 125 MEA Carbon Dioxide Incubators Market Value (US$ Mn), By Application 2012-2017
TABLE 126 MEA Carbon Dioxide Incubators Market Value (US$ Mn), By Application 2018-2026
List of Figures
FIG. 1 Global Carbon Dioxide Incubators Market Value (US$ Mn), 2012-2017
FIG. 2 Global Carbon Dioxide Incubators Market Value (US$ Mn) Forecast, 2018-2026
FIG. 3 Global Carbon Dioxide Incubators Market Value (US$ Mn) and Y-o-Y, 2017-2026
FIG. 4 Global Water Jacketed CO2 Incubators Segment Market Value (US$ Mn) By Region, 2012-2017
FIG. 5 Global Water Jacketed CO2 Incubators Segment Market Value (US$ Mn) By Region, 2018-2026
FIG. 6 Global Water Jacketed CO2 Incubators Segment Y-o-Y Growth Rate, By Region, 2017-2026
FIG. 7 Global Air Jacketed CO2 Incubators Segment Market Value (US$ Mn) By Region, 2012-2017
FIG. 8 Global Air Jacketed CO2 Incubators Segment Market Value (US$ Mn) By Region, 2018-2026
FIG. 9 Global Air Jacketed CO2 Incubators Segment Y-o-Y Growth Rate, By Region, 2017-2026
FIG. 10 Global Direct Heat CO2 Incubators Segment Market Value (US$ Mn) By Region, 2012-2017
FIG. 11 Global Direct Heat CO2 Incubators Segment Market Value (US$ Mn) By Region, 2018-2026
FIG. 12 Global Direct Heat CO2 Incubators Segment Y-o-Y Growth Rate, By Region, 2017-2026
FIG. 13 Global Below 100L Segment Market Value (US$ Mn) By Region, 2012-2017
FIG. 14 Global Below 100L Segment Market Value (US$ Mn) By Region, 2018-2026
FIG. 15 Global Below 100L Segment Y-o-Y Growth Rate, By Region, 2017-2026
FIG. 16 Global Above 100L and Below 200L Segment Market Value (US$ Mn) By Region, 2012-2017
FIG. 17 Global Above 100L and Below 200L Segment Market Value (US$ Mn) By Region, 2018-2026
FIG. 18 Global Above 100L and Below 200L Segment Y-o-Y Growth Rate, By Region, 2017-2026
FIG. 19 Global Above 200L Segment Market Value (US$ Mn) By Region, 2012-2017
FIG. 20 Global Above 200L Segment Market Value (US$ Mn) By Region, 2018-2026
FIG. 21 Global Above 200L Segment Y-o-Y Growth Rate, By Region, 2017-2026
FIG. 22 Global Laboratory Research and Clinical Applications Segment Market Value (US$ Mn) By Region, 2012-2017
FIG. 23 Global Laboratory Research and Clinical Applications Segment Market Value (US$ Mn) By Region, 2018-2026
FIG. 24 Global Laboratory Research and Clinical Applications Segment Y-o-Y Growth Rate, By Region, 2017-2026
FIG. 25 Global In Vitro Fertilisation Segment Market Value (US$ Mn) By Region, 2012-2017
FIG. 26 Global In Vitro Fertilisation Segment Market Value (US$ Mn) By Region, 2018-2026
FIG. 27 Global In Vitro Fertilisation Segment Y-o-Y Growth Rate, By Region, 2017-2026
FIG. 28 Global Other Applications Segment Market Value (US$ Mn) By Region, 2012-2017
FIG. 29 Global Other Applications Segment Market Value (US$ Mn) By Region, 2018-2026
FIG. 30 Global Other Applications Segment Y-o-Y Growth Rate, By Region, 2017-2026
FIG. 31 North America Carbon Dioxide Incubators Market Value (US$ Mn), By Country 2012-2017
FIG. 32 North America Carbon Dioxide Incubators Market Value (US$ Mn), By Country 2018-2026
FIG. 33 North America Carbon Dioxide Incubators Market Value (US$ Mn), By Product Type 2012-2017
FIG. 34 North America Carbon Dioxide Incubators Market Value (US$ Mn), By Product Type 2018-2026
FIG. 35 North America Carbon Dioxide Incubators Market Value (US$ Mn), By Capacity 2012-2017
FIG. 36 North America Carbon Dioxide Incubators Market Value (US$ Mn), By Capacity 2018-2026
FIG. 37 North America Carbon Dioxide Incubators Market Value (US$ Mn), By Application 2012-2017
FIG. 38 North America Carbon Dioxide Incubators Market Value (US$ Mn), By Application 2018-2026
FIG. 39 Latin America Carbon Dioxide Incubators Market Value (US$ Mn), By Country 2012-2017
FIG. 40 Latin America Carbon Dioxide Incubators Market Value (US$ Mn), By Country 2018-2026
FIG. 41 Latin America Carbon Dioxide Incubators Market Value (US$ Mn), By Product Type 2012-2017
FIG. 42 Latin America Carbon Dioxide Incubators Market Value (US$ Mn), By Product Type 2018-2026
FIG. 43 Latin America Carbon Dioxide Incubators Market Value (US$ Mn), By Capacity 2012-2017
FIG. 44 Latin America Carbon Dioxide Incubators Market Value (US$ Mn), By Capacity 2018-2026
FIG. 45 Latin America Carbon Dioxide Incubators Market Value (US$ Mn), By Application 2012-2017
FIG. 46 Latin America Carbon Dioxide Incubators Market Value (US$ Mn), By Application 2018-2026
FIG. 47 Europe Carbon Dioxide Incubators Market Value (US$ Mn), By Country 2012-2017
FIG. 48 Europe Carbon Dioxide Incubators Market Value (US$ Mn), By Country 2018-2026
FIG. 49 Europe Carbon Dioxide Incubators Market Value (US$ Mn), By Product Type 2012-2017
FIG. 50 Europe Carbon Dioxide Incubators Market Value (US$ Mn), By Product Type 2018-2026
FIG. 51 Europe Carbon Dioxide Incubators Market Value (US$ Mn), By Capacity 2012-2017
FIG. 52 Europe Carbon Dioxide Incubators Market Value (US$ Mn), By Capacity 2018-2026
FIG. 53 Europe Carbon Dioxide Incubators Market Value (US$ Mn), By Application 2012-2017
FIG. 54 Europe Carbon Dioxide Incubators Market Value (US$ Mn), By Application 2018-2026
FIG. 55 Japan Carbon Dioxide Incubators Market Value (US$ Mn), By Country 2012-2017
FIG. 56 Japan Carbon Dioxide Incubators Market Value (US$ Mn), By Country 2018-2026
FIG. 57 Japan Carbon Dioxide Incubators Market Value (US$ Mn), By Product Type 2012-2017
FIG. 58 Japan Carbon Dioxide Incubators Market Value (US$ Mn), By Product Type 2018-2026
FIG. 59 Japan Carbon Dioxide Incubators Market Value (US$ Mn), By Application 2012-2017
FIG. 60 Japan Carbon Dioxide Incubators Market Value (US$ Mn), By Capacity 2018-2026
FIG. 61 Japan Carbon Dioxide Incubators Market Value (US$ Mn), By Application 2012-2017
FIG. 62 Japan Carbon Dioxide Incubators Market Value (US$ Mn), By Application 2018-2026
FIG. 63 APEJ Carbon Dioxide Incubators Market Value (US$ Mn), By Country 2012-2017
FIG. 64 APEJ Carbon Dioxide Incubators Market Value (US$ Mn), By Country 2018-2026
FIG. 65 APEJ Carbon Dioxide Incubators Market Value (US$ Mn), By Product Type 2012-2017
FIG. 66 APEJ Carbon Dioxide Incubators Market Value (US$ Mn), By Product Type 2018-2026
FIG. 67 APEJ Carbon Dioxide Incubators Market Value (US$ Mn), By Capacity 2012-2017
FIG. 68 APEJ Carbon Dioxide Incubators Market Value (US$ Mn), By Capacity 2018-2026
FIG. 69 APEJ Carbon Dioxide Incubators Market Value (US$ Mn), By Application 2012-2017
FIG. 70 APEJ Carbon Dioxide Incubators Market Value (US$ Mn), By Application 2018-2026
FIG. 71 MEA Carbon Dioxide Incubators Market Value (US$ Mn), By Country 2012-2017
FIG. 72 MEA Carbon Dioxide Incubators Market Value (US$ Mn), By Country 2018-2026
FIG. 73 MEA Carbon Dioxide Incubators Market Value (US$ Mn), By Product Type 2012-2017
FIG. 74 MEA Carbon Dioxide Incubators Market Value (US$ Mn), By Product Type 2018-2026
FIG. 75 MEA Carbon Dioxide Incubators Market Value (US$ Mn), By Capacity 2012-2017
FIG. 76 MEA Carbon Dioxide Incubators Market Value (US$ Mn), By Capacity 2018-2026
FIG. 77 MEA Carbon Dioxide Incubators Market Value (US$ Mn), By Application 2012-2017
FIG. 78 MEA Carbon Dioxide Incubators Market Value (US$ Mn), By Application 2018-2026
Copyright © Transparency Market Research, Inc. All Rights reserved
Trust Online


Carbon Dioxide Incubators Market