
Analysts’ Viewpoint on Biodegradable Cups Market Scenario
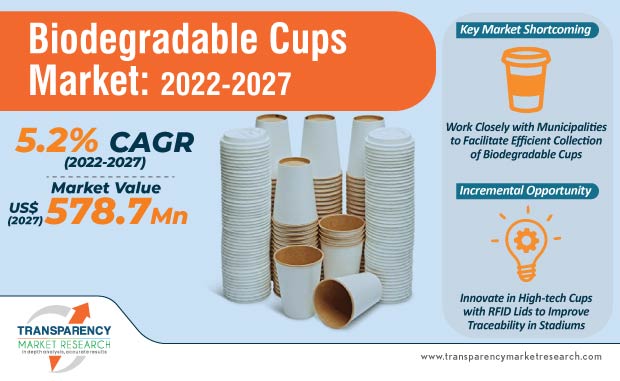
Manufacturers based in the Western Hemisphere have been making significant progress in securing themselves against the volatility in supply from Asia and China in particular due to the ongoing COVID-19 crisis by moving the bulk production to their respective countries. The biodegradable cups market is expected to gauge a modest market value expansion rate during the forecast period. Currently, the market is favorable for expansion in North America and Europe. As such, there is a high potential for incremental opportunities in Asia Pacific in the upcoming years. Moreover, manufacturers are developing biodegradable cups without barrier, which serves as a quick solution for easy recycling and ensures flexibility for stakeholders in the value chain. However, market players are challenged with the limitations of the recycling infrastructure. Hence, manufacturers are working closely with municipalities to introduce subscription/scout honor systems at food outlets and coffee houses to manage the inventory of single-use recyclable cups. Market players should focus on offering innovative packaging solutions for stakeholders in the food service packaging landscape and educational institutes that can increase awareness about the environmental benefits of biodegradable cups.
The growth of the food service and packaging industries is triggering the growth for biodegradable cups market, which currently is predicted to advance at a modest CAGR. Manufacturers generally use plastic barrier against moisture, oil, grease, and heat in cups. Since this practice is not environment-friendly, market players are introducing water-based compostable coating for biodegradable cups.
Biodegradable cups made from water-soluble coating helps in easy disposal and can be effectively recycled. This environmental food grade barrier coating solves the issue against water, grease, and heat for stakeholders in the food & beverages industry. In order to increase its applications in the food & beverages industry, manufacturers are improving biodegradable cups with value-added features such as heat resistance for oven application, heat sealing, and its water-based elements pose no risk for human health. As such, manufacturers in the biodegradable cups market are innovating in new paper composites that do not require a barrier in cups, allowing them to biodegrade and be recycled easily.
Request a sample to get extensive insights into the Biodegradable Cups Market
Overall, the response to the coronavirus pandemic is expected to substantially diminish organizational revenue and capital expenditure, as impacts start to solidify within more organizations. Nevertheless, stakeholders in the biodegradable cups market are maintaining optimum inventory levels to ensure continuity in production and sales. Reopening of the HoReCa (Hotel, Restaurant, Café) industry and increasing footfalls in malls hold promising potentials to boost sales of biodegradable cups. The growing awareness about the advantages of biodegradable cups is another driver for the global biodegradable cups market.
Domestic and global companies are in the midst of rapid shift in supply chain planning, operations, and inventory management to address the impact of the coronavirus.
To understand how our report can bring difference to your business strategy, Ask for a brochure
There is a strong demand for eco-friendly solutions in the food service packaging landscape. Consumers demand convenience but in a sustainable way. The global sales of food service packaging is estimated to reach several billion dollars throughout the assessment period. Thus, manufacturers in the biodegradable cups market are innovating in compostable and recyclable packaging solutions.
Market players are introducing renewable paperboard designs for paper cups that can be efficiently recycled. The novel material used for cups is suitable for hot & cold beverages as well as ice cream packaging. This paperboard is manufactured without a plastic coating layer. Thus, the full fiber recovery helps to reduce the environmental footprint almost by half, as compared to conventional plastic cups.
The introduction of recyclable paper cups helps to comply with strict environmental regulations, as governments in many countries are contemplating a ban on plastic usage. Paper and pulp companies are launching high-quality renewable paperboard for paper cups.
Stuck in a neck-to-neck competition with other brands? Request a custom report on Biodegradable Cups Market
The biodegradable cups market is highly fragmented, which is creating opportunities for emerging manufacturers to enter the market. However, established and emerging market players need to address the limitations of the existing recycling infrastructure. Although plastic and fiber materials in biodegradable cups can be recycled when separated, these materials cannot be easily recycled, since there are only few strong incentives for recyclers to recover the materials.
As such, market players are rolling out scout’s honor system to efficiently collect reusable cups for further treatment. American coffee companies are exploring next-gen recycling and composting technologies by working closely with municipalities to increase acceptance of biodegradable cups.
Other innovations in the biodegradable cups market is the development of high-tech cups with RFID (Radio Frequency Identification) lid to manage inventory of reusable cups and improve traceability in complicated venues such as stadiums.
|
Attribute |
Detail |
|
Market Size Value in 2022 (Base Year) |
US$ 449.7 Mn |
|
Market Forecast Value in 2027 |
US$ 578.7 Mn |
|
Growth Rate (CAGR) |
5.2% |
|
Forecast Period |
2022-2027 |
|
Quantitative Units |
US$ Mn for Value and Mn Units for Volume |
|
Market Analysis |
This report represents market dynamics of biodegradable cups and lucrative hotspots of the market. |
|
Competition Landscape |
Competition analysis section in the report represents 5 years performance of the key players and strategies implement by them, along with market share of respective companies in the global market. |
|
Format |
Electronic (PDF) + Excel |
|
Market Segmentation |
|
|
Regions Covered |
|
|
Countries Covered |
|
|
Companies Profiled |
|
|
Customization Scope |
Available upon Request |
|
Pricing |
Available upon Request |
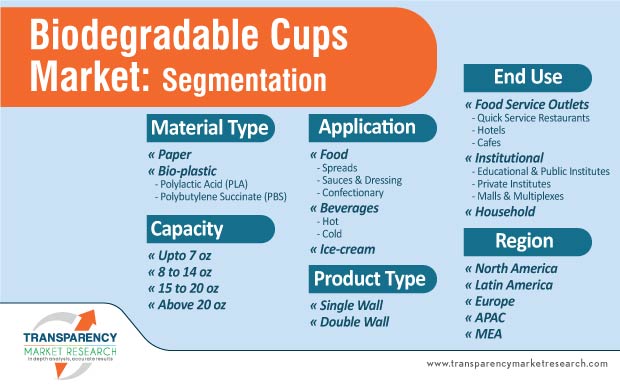
Biodegradable Cups Market – Segmentation
The biodegradable cups market has been classified on the basis of capacity, material type, product type, application, end use and region. Each of these segments are analyzed to provide readers with holistic view of the market.
| Capacity |
|
| Material Type |
|
| Product Type |
|
| Application |
|
| End Use |
|
| Region |
|
The forecast period of 2021 to 2031 would see the market achieving a CAGR of 5.2%.
The Market Valuation Would Grow Up to US$ 578.7 Mn by the end of 2027
Huhtamaki Oyj, Colpac Ltd., Benders Paper Cup Company, Fabri-Kal, World Centric® These are The Market Players.
Biodegradable Cups is further segmented as per material type, product type, sales channel, and end use.
North America Takes Lead in the Biodegradable Cups Market
1. Executive Summary
1.1. Market Overview
1.2. Market Analysis
1.3. TMR Analysis and Recommendations
2. Market Viewpoint
2.1. Market Definition
2.2. Market Taxonomy
3. Biodegradable Cups Market Overview
3.1. Introduction
3.2. Global Economic Outlook
3.3. Global Packaging Industry Outlook
3.4. Global Foodservice Packaging Market Outlook
3.5. Macro-economic Factors – Correlation Analysis
3.6. Forecast Factors – Relevance & Impact
3.7. Biodegradable Cups Market Value Chain Analysis
3.7.1. Exhaustive List of Active Participants
3.7.1.1. Raw Material Suppliers
3.7.1.2. Biodegradable Cups Manufacturers
3.7.1.3. Distributors/Retailers
3.7.1.4. End-users/Customers
3.7.2. Profitability Margins
4. Impact of COVID-19
4.1. Current Statistics and Probable Future Impact
4.2. Impact of COVID-19 on Packaging Industry
5. Biodegradable Cups Market Analysis
5.1. Pricing Analysis
5.1.1. Pricing Assumption
5.1.2. Price Projections By Region
5.2. Market Size (US$ Mn) and Forecast
5.2.1. Market Size and Y-o-Y Growth
5.2.2. Absolute $ Opportunity
6. Biodegradable Cups Market Dynamics
6.1. Drivers
6.2. Restraints
6.3. Opportunity Analysis
6.4. Trends
7. Global Biodegradable Cups Market Analysis and Forecast, By Capacity
7.1. Introduction
7.1.1. Market share and Basis Points (BPS) Analysis, By Capacity
7.1.2. Y-o-Y Growth Projections, By Capacity
7.2. Historical Market Value (US$ Mn) and Volume (Mn Units), 2014-2021, By Capacity
7.2.1. Upto 7 oz
7.2.2. 8 to 14 oz
7.2.3. 15 to 20 oz
7.2.4. Above 20 oz
7.3. Market Size (US$ Mn) and Volume (Mn Units) Forecast Analysis 2022-2027, By Capacity
7.3.1. Upto 7 oz
7.3.2. 8 to 14 oz
7.3.3. 15 to 20 oz
7.3.4. Above 20 oz
7.4. Market Attractiveness Analysis, By Capacity
8. Global Biodegradable Cups Market Analysis and Forecast, By Material Type
8.1. Introduction
8.1.1. Market share and Basis Points (BPS) Analysis, By Material Type
8.1.2. Y-o-Y Growth Projections, By Material Type
8.2. Historical Market Value (US$ Mn) and Volume (Mn Units), 2014-2021, By Material Type
8.2.1. Paper
8.2.2. Bio-plastic
8.2.2.1. Polylactic acid (PLA)
8.2.2.2. Polybutylene succinate (PBS)
8.3. Market Size (US$ Mn) and Volume (Mn Units) Forecast Analysis 2022-2027, By Material Type
8.3.1. Paper
8.3.2. Bio-plastic
8.3.2.1. Polylactic acid (PLA)
8.3.2.2. Polybutylene succinate (PBS)
8.4. Market Attractiveness Analysis, By Material Type
9. Global Biodegradable Cups Market Analysis and Forecast, By Product Type
9.1. Introduction
9.1.1. Market share and Basis Points (BPS) Analysis By Product Type
9.1.2. Y-o-Y Growth Projections By Product Type
9.2. Historical Market Value (US$ Mn) and Volume (Mn Units), 2014-2021, By Product Type
9.2.1. Single Wall
9.2.2. Double Wall
9.3. Market Size (US$ Mn) and Volume (Mn Units) Forecast Analysis 2022-2027, By Product Type
9.3.1. Single Wall
9.3.2. Double Wall
9.4. Market Attractiveness Analysis, By Product Type
10. Global Biodegradable Cups Market Analysis and Forecast, By Application
10.1. Introduction
10.1.1. Market share and Basis Points (BPS) Analysis By Application
10.1.2. Y-o-Y Growth Projections By Application
10.2. Historical Market Value (US$ Mn) and Volume (Mn Units), 2014-2021, By Application
10.2.1. Food
10.2.1.1. Spreads
10.2.1.2. Sauces & Dressing
10.2.1.3. Confectionary
10.2.2. Beverages
10.2.2.1. Hot
10.2.2.2. Cold
10.2.3. Ice-cream
10.3. Market Size (US$ Mn) and Volume (Mn Units) Forecast Analysis 2022-2027, By Application
10.3.1. Food
10.3.1.1. Spreads
10.3.1.2. Sauces & Dressing
10.3.1.3. Confectionary
10.3.2. Beverages
10.3.2.1. Hot
10.3.2.2. Cold
10.3.3. Ice-cream
10.4. Market Attractiveness Analysis, By Application
11. Global Biodegradable Cups Market Analysis and Forecast, By End Use
11.1. Introduction
11.1.1. Market share and Basis Points (BPS) Analysis By End Use
11.1.2. Y-o-Y Growth Projections By End Use
11.2. Historical Market Value (US$ Mn) and Volume (Mn Units), 2014-2021, By End Use
11.2.1. Food Service Outlets
11.2.1.1. Quick Service Restaurants
11.2.1.2. Hotels
11.2.1.3. Cafes
11.2.2. Institutional
11.2.2.1. Educational & Public Institutes
11.2.2.2. Private Institutes
11.2.2.3. Malls & Multiplexes
11.2.3. Household
11.3. Market Size (US$ Mn) and Volume (Mn Units) Forecast Analysis 2022-2027, By End Use
11.3.1. Food Service Outlets
11.3.1.1. Quick Service Restaurants
11.3.1.2. Hotels
11.3.1.3. Cafes
11.3.2. Institutional
11.3.2.1. Educational & Public Institutes
11.3.2.2. Private Institutes
11.3.2.3. Malls & Multiplexes
11.3.3. Household
11.4. Market Attractiveness Analysis, By End Use
12. Global Biodegradable Cups Market Analysis and Forecast, By Region
12.1. Introduction
12.1.1. Market share and Basis Points (BPS) Analysis By Region
12.1.2. Y-o-Y Growth Projections By Region
12.2. Historical Market Value (US$ Mn) and Volume (Mn Units), 2014-2021, By Region
12.2.1. North America
12.2.2. Latin America
12.2.3. Europe
12.2.4. Asia Pacific (APAC)
12.2.5. Middle East and Africa (MEA)
12.3. Market Size (US$ Mn) and Volume (Mn Units) Forecast Analysis 2022-2027 By Region
12.3.1. North America
12.3.2. Latin America
12.3.3. Europe
12.3.4. Asia Pacific (APAC)
12.3.5. Middle East and Africa (MEA)
12.4. Market Attractiveness Analysis By Region
13. North America Biodegradable Cups Market Analysis and Forecast
13.1. Introduction
13.1.1. Market share and Basis Points (BPS) Analysis, By Country
13.1.2. Y-o-Y Growth Projections, By Country
13.2. Historical Market Value (US$ Mn) and Volume (Mn Units), 2014-2021, By Country
13.3. Market Size (US$ Mn) and Volume (Mn Units) Forecast Analysis 2022-2027, By Country
13.3.1. U.S.
13.3.2. Canada
13.4. Historical Market Value (US$ Mn) and Volume (Mn Units), 2014-2021, By Capacity
13.5. Market Size (US$ Mn) and Volume (Mn Units) Forecast Analysis 2022-2027, By Capacity
13.5.1. Upto 7 oz
13.5.2. 8 to 14 oz
13.5.3. 15 to 20 oz
13.5.4. Above 20 oz
13.6. Historical Market Value (US$ Mn) and Volume (Mn Units), 2014-2021, By Material Type
13.7. Market Size (US$ Mn) and Volume (Mn Units) Forecast Analysis 2022-2027, By Material Type
13.7.1. Paper
13.7.2. Bio-plastic
13.7.2.1. Polylactic acid (PLA)
13.7.2.2. Polybutylene succinate (PBS)
13.8. Historical Market Value (US$ Mn) and Volume (Mn Units), 2014-2021, By Product Type
13.9. Market Size (US$ Mn) and Volume (Mn Units) Forecast Analysis 2022-2027, By Product Type
13.9.1. Single Wall
13.9.2. Double Wall
13.10. Historical Market Value (US$ Mn) and Volume (Mn Units), 2014-2021, By Application
13.11. Market Size (US$ Mn) and Volume (Mn Units) Forecast Analysis 2022-2027, By Application
13.11.1. Food
13.11.1.1. Spreads
13.11.1.2. Sauces & Dressing
13.11.1.3. Confectionary
13.11.2. Beverages
13.11.2.1. Hot
13.11.2.2. Cold
13.11.3. Ice-cream
13.12. Historical Market Value (US$ Mn) and Volume (Mn Units), 2014-2021, By End Use
13.13. Market Size (US$ Mn) and Volume (Mn Units) Forecast Analysis 2022-2027, By End Use
13.13.1. Food Service Outlets
13.13.1.1. Quick Service Restaurants
13.13.1.2. Hotels
13.13.1.3. Cafes
13.13.2. Institutional
13.13.2.1. Educational & Public Institutes
13.13.2.2. Private Institutes
13.13.2.3. Malls & Multiplexes
13.13.3. Household
13.14. Market Attractiveness Analysis
13.14.1. By Country
13.14.2. By Capacity
13.14.3. By Material Type
13.14.4. By Product Type
13.14.5. By Application
13.14.6. By End Use
14. Latin America Biodegradable Cups Market Analysis and Forecast
14.1. Introduction
14.1.1. Market share and Basis Points (BPS) Analysis, By Country
14.1.2. Y-o-Y Growth Projections, By Country
14.2. Historical Market Value (US$ Mn) and Volume (Mn Units), 2014-2021, By Country
14.3. Market Size (US$ Mn) and Volume (Mn Units) Forecast Analysis 2022-2027 By Country
14.3.1. Brazil
14.3.2. Mexico
14.3.3. Argentina
14.3.4. Rest of Latin America
14.4. Historical Market Value (US$ Mn) and Volume (Mn Units), 2014-2021, By Capacity
14.5. Market Size (US$ Mn) and Volume (Mn Units) Forecast Analysis 2022-2027, By Capacity
14.5.1. Upto 7 oz
14.5.2. 8 to 14 oz
14.5.3. 15 to 20 oz
14.5.4. Above 20 oz
14.6. Historical Market Value (US$ Mn) and Volume (Mn Units), 2014-2021, By Material Type
14.7. Market Size (US$ Mn) and Volume (Mn Units) Forecast Analysis 2022-2027, By Material Type
14.7.1. Paper
14.7.2. Bio-plastic
14.7.2.1. Polylactic acid (PLA)
14.7.2.2. Polybutylene succinate (PBS)
14.8. Historical Market Value (US$ Mn) and Volume (Mn Units), 2014-2021, By Product Type
14.9. Market Size (US$ Mn) and Volume (Mn Units) Forecast Analysis 2022-2027, By Product Type
14.9.1. Single Wall
14.9.2. Double Wall
14.10. Historical Market Value (US$ Mn) and Volume (Mn Units), 2014-2021, By Application
14.11. Market Size (US$ Mn) and Volume (Mn Units) Forecast Analysis 2022-2027, By Application
14.11.1. Food
14.11.1.1. Spreads
14.11.1.2. Sauces & Dressing
14.11.1.3. Confectionary
14.11.2. Beverages
14.11.2.1. Hot
14.11.2.2. Cold
14.11.3. Ice-cream
14.12. Historical Market Value (US$ Mn) and Volume (Mn Units), 2014-2021, By End Use
14.13. Market Size (US$ Mn) and Volume (Mn Units) Forecast Analysis 2022-2027, By End Use
14.13.1. Food Service Outlets
14.13.1.1. Quick Service Restaurants
14.13.1.2. Hotels
14.13.1.3. Cafes
14.13.2. Institutional
14.13.2.1. Educational & Public Institutes
14.13.2.2. Private Institutes
14.13.2.3. Malls & Multiplexes
14.13.3. Household
14.14. Market Attractiveness Analysis
14.14.1. By Country
14.14.2. By Capacity
14.14.3. By Material Type
14.14.4. By Product Type
14.14.5. By Application
14.14.6. By End Use
15. Europe Biodegradable Cups Market Analysis and Forecast
15.1. Introduction
15.1.1. Market share and Basis Points (BPS) Analysis, By Country
15.1.2. Y-o-Y Growth Projections, By Country
15.2. Historical Market Value (US$ Mn) and Volume (Mn Units), 2014-2021, By Country
15.3. Market Size (US$ Mn) and Volume (Mn Units) Forecast Analysis 2022-2027 By Country
15.3.1. Germany
15.3.2. France
15.3.3. Italy
15.3.4. U.K.
15.3.5. Spain
15.3.6. BENELUX
15.3.7. Nordic
15.3.8. Russia
15.3.9. Poland
15.3.10. Rest of Europe
15.4. Historical Market Value (US$ Mn) and Volume (Mn Units), 2014-2021, By Capacity
15.5. Market Size (US$ Mn) and Volume (Mn Units) Forecast Analysis 2022-2027, By Capacity
15.5.1. Upto 7 oz
15.5.2. 8 to 14 oz
15.5.3. 15 to 20 oz
15.5.4. Above 20 oz
15.6. Historical Market Value (US$ Mn) and Volume (Mn Units), 2014-2021, By Material Type
15.7. Market Size (US$ Mn) and Volume (Mn Units) Forecast Analysis 2022-2027, By Material Type
15.7.1. Paper
15.7.2. Bio-plastic
15.7.2.1. Polylactic acid (PLA)
15.7.2.2. Polybutylene succinate (PBS)
15.8. Historical Market Value (US$ Mn) and Volume (Mn Units), 2014-2021, By Product Type
15.9. Market Size (US$ Mn) and Volume (Mn Units) Forecast Analysis 2022-2027, By Product Type
15.9.1. Single Wall
15.9.2. Double Wall
15.10. Historical Market Value (US$ Mn) and Volume (Mn Units), 2014-2021, By Application
15.11. Market Size (US$ Mn) and Volume (Mn Units) Forecast Analysis 2022-2027, By Application
15.11.1. Food
15.11.1.1. Spreads
15.11.1.2. Sauces & Dressing
15.11.1.3. Confectionary
15.11.2. Beverages
15.11.2.1. Hot
15.11.2.2. Cold
15.11.3. Ice-cream
15.12. Historical Market Value (US$ Mn) and Volume (Mn Units), 2014-2021, By End Use
15.13. Market Size (US$ Mn) and Volume (Mn Units) Forecast Analysis 2022-2027, By End Use
15.13.1. Food Service Outlets
15.13.1.1. Quick Service Restaurants
15.13.1.2. Hotels
15.13.1.3. Cafes
15.13.2. Institutional
15.13.2.1. Educational & Public Institutes
15.13.2.2. Private Institutes
15.13.2.3. Malls & Multiplexes
15.13.3. Household
15.14. Market Attractiveness Analysis
15.14.1. By Country
15.14.2. By Capacity
15.14.3. By Material Type
15.14.4. By Product Type
15.14.5. By Application
15.14.6. By End Use
16. Asia Pacific Biodegradable Cups Market Analysis and Forecast
16.1. Introduction
16.1.1. Market share and Basis Points (BPS) Analysis, By Country
16.1.2. Y-o-Y Growth Projections, By Country
16.2. Historical Market Value (US$ Mn) and Volume (Mn Units), 2014-2021, By Country
16.3. Market Size (US$ Mn) and Volume (Mn Units) Forecast Analysis 2022-2027 By Country
16.3.1. China
16.3.2. India
16.3.3. Japan
16.3.4. ASEAN
16.3.5. Australia and New Zealand
16.3.6. Rest of APAC
16.4. Historical Market Value (US$ Mn) and Volume (Mn Units), 2014-2021, By Capacity
16.5. Market Size (US$ Mn) and Volume (Mn Units) Forecast Analysis 2022-2027, By Capacity
16.5.1. Upto 7 oz
16.5.2. 8 to 14 oz
16.5.3. 15 to 20 oz
16.5.4. Above 20 oz
16.6. Historical Market Value (US$ Mn) and Volume (Mn Units), 2014-2021, By Material Type
16.7. Market Size (US$ Mn) and Volume (Mn Units) Forecast Analysis 2022-2027, By Material Type
16.7.1. Paper
16.7.2. Bio-plastic
16.7.2.1. Polylactic acid (PLA)
16.7.2.2. Polybutylene succinate (PBS)
16.8. Historical Market Value (US$ Mn) and Volume (Mn Units), 2014-2021, By Product Type
16.9. Market Size (US$ Mn) and Volume (Mn Units) Forecast Analysis 2022-2027, By Product Type
16.9.1. Single Wall
16.9.2. Double Wall
16.10. Historical Market Value (US$ Mn) and Volume (Mn Units), 2014-2021, By Application
16.11. Market Size (US$ Mn) and Volume (Mn Units) Forecast Analysis 2022-2027, By Application
16.11.1. Food
16.11.1.1. Spreads
16.11.1.2. Sauces & Dressing
16.11.1.3. Confectionary
16.11.2. Beverages
16.11.2.1. Hot
16.11.2.2. Cold
16.11.3. Ice-cream
16.12. Historical Market Value (US$ Mn) and Volume (Mn Units), 2014-2021, By End Use
16.13. Market Size (US$ Mn) and Volume (Mn Units) Forecast Analysis 2022-2027, By End Use
16.13.1. Food Service Outlets
16.13.1.1. Quick Service Restaurants
16.13.1.2. Hotels
16.13.1.3. Cafes
16.13.2. Institutional
16.13.2.1. Educational & Public Institutes
16.13.2.2. Private Institutes
16.13.2.3. Malls & Multiplexes
16.13.3. Household
16.14. Market Attractiveness Analysis
16.14.1. By Country
16.14.2. By Capacity
16.14.3. By Material Type
16.14.4. By Product Type
16.14.5. By Application
16.14.6. By End Use
17. Middle East and Africa Biodegradable Cups Market Analysis and Forecast
17.1. Introduction
17.1.1. Market share and Basis Points (BPS) Analysis, By Country
17.1.2. Y-o-Y Growth Projections, By Country
17.2. Historical Market Value (US$ Mn) and Volume (Mn Units), 2014-2021, By Country
17.3. Market Size (US$ Mn) and Volume (Mn Units) Forecast Analysis 2022-2027, By Country
17.3.1. GCC countries
17.3.2. Northern Africa
17.3.3. South Africa
17.3.4. Rest of MEA
17.4. Historical Market Value (US$ Mn) and Volume (Mn Units), 2014-2021, By Capacity
17.5. Market Size (US$ Mn) and Volume (Mn Units) Forecast Analysis 2022-2027, By Capacity
17.5.1. Upto 7 oz
17.5.2. 8 to 14 oz
17.5.3. 15 to 20 oz
17.5.4. Above 20 oz
17.6. Historical Market Value (US$ Mn) and Volume (Mn Units), 2014-2021, By Material Type
17.7. Market Size (US$ Mn) and Volume (Mn Units) Forecast Analysis 2022-2027, By Material Type
17.7.1. Paper
17.7.2. Bio-plastic
17.7.2.1. Polylactic acid (PLA)
17.7.2.2. Polybutylene succinate (PBS)
17.8. Historical Market Value (US$ Mn) and Volume (Mn Units), 2014-2021, By Product Type
17.9. Market Size (US$ Mn) and Volume (Mn Units) Forecast Analysis 2022-2027, By Product Type
17.9.1. Single Wall
17.9.2. Double Wall
17.10. Historical Market Value (US$ Mn) and Volume (Mn Units), 2014-2021, By Application
17.11. Market Size (US$ Mn) and Volume (Mn Units) Forecast Analysis 2022-2027, By Application
17.11.1. Food
17.11.1.1. Spreads
17.11.1.2. Sauces & Dressing
17.11.1.3. Confectionary
17.11.2. Beverages
17.11.2.1. Hot
17.11.2.2. Cold
17.11.3. Ice-cream
17.12. Historical Market Value (US$ Mn) and Volume (Mn Units), 2014-2021, By End Use
17.13. Market Size (US$ Mn) and Volume (Mn Units) Forecast Analysis 2022-2027, By End Use
17.13.1. Food Service Outlets
17.13.1.1. Quick Service Restaurants
17.13.1.2. Hotels
17.13.1.3. Cafes
17.13.2. Institutional
17.13.2.1. Educational & Public Institutes
17.13.2.2. Private Institutes
17.13.2.3. Malls & Multiplexes
17.13.3. Household
17.14. Market Attractiveness Analysis
17.14.1. By Country
17.14.2. By Capacity
17.14.3. By Material Type
17.14.4. By Product Type
17.14.5. By Application
17.14.6. By End Use
18. Country-wise Analysis and Forecast for Biodegradable Cups Market
18.1. United States (U.S.) Biodegradable Cups Market Analysis 2022 & 2027
18.1.1. Market Value (US$ Mn) & Volume (Mn Units) Analysis and Forecast by Market Taxonomy
18.1.1.1. By Capacity
18.1.1.2. By Material Type
18.1.1.3. By Product Type
18.1.1.4. By Application
18.1.1.5. By End Use
18.2. Brazil Biodegradable Cups Market Analysis 2022 & 2027
18.2.1. Market Value (US$ Mn) & Volume (Mn Units) Analysis and Forecast by Market Taxonomy
18.2.1.1. By Capacity
18.2.1.2. By Material Type
18.2.1.3. By Product Type
18.2.1.4. By Application
18.2.1.5. By End Use
18.3. Mexico Biodegradable Cups Market Analysis 2022 & 2027
18.3.1. Market Value (US$ Mn) & Volume (Mn Units) Analysis and Forecast by Market Taxonomy
18.3.1.1. By Capacity
18.3.1.2. By Material Type
18.3.1.3. By Product Type
18.3.1.4. By Application
18.3.1.5. By End Use
18.4. Germany Biodegradable Cups Market Analysis 2022 & 2027
18.4.1. Market Value (US$ Mn) & Volume (Mn Units) Analysis and Forecast by Market Taxonomy
18.4.1.1. By Capacity
18.4.1.2. By Material Type
18.4.1.3. By Product Type
18.4.1.4. By Application
18.4.1.5. By End Use
18.5. France Biodegradable Cups Market Analysis 2022 & 2027
18.5.1. Market Value (US$ Mn) & Volume (Mn Units) Analysis and Forecast by Market Taxonomy
18.5.1.1. By Capacity
18.5.1.2. By Material Type
18.5.1.3. By Product Type
18.5.1.4. By Application
18.5.1.5. By End Use
18.6. United Kingdom (U.K.) Biodegradable Cups Market Analysis 2022 & 2027
18.6.1. Market Value (US$ Mn) & Volume (Mn Units) Analysis and Forecast by Market Taxonomy
18.6.1.1. By Capacity
18.6.1.2. By Material Type
18.6.1.3. By Product Type
18.6.1.4. By Application
18.6.1.5. By End Use
18.7. Russia Biodegradable Cups Market Analysis 2022 & 2027
18.7.1. Market Value (US$ Mn) & Volume (Mn Units) Analysis and Forecast by Market Taxonomy
18.7.1.1. By Capacity
18.7.1.2. By Material Type
18.7.1.3. By Product Type
18.7.1.4. By Application
18.7.1.5. By End Use
18.8. China Biodegradable Cups Market Analysis 2022 & 2027
18.8.1. Market Value (US$ Mn) & Volume (Mn Units) Analysis and Forecast by Market Taxonomy
18.8.1.1. By Capacity
18.8.1.2. By Material Type
18.8.1.3. By Product Type
18.8.1.4. By Application
18.8.1.5. By End Use
18.9. India Biodegradable Cups Market Analysis 2022 & 2027
18.9.1. Market Value (US$ Mn) & Volume (Mn Units) Analysis and Forecast by Market Taxonomy
18.9.1.1. By Capacity
18.9.1.2. By Material Type
18.9.1.3. By Product Type
18.9.1.4. By Application
18.9.1.5. By End Use
18.10. Japan Biodegradable Cups Market Analysis 2022 & 2027
18.10.1. Market Value (US$ Mn) & Volume (Mn Units) Analysis and Forecast by Market Taxonomy
18.10.1.1. By Capacity
18.10.1.2. By Material Type
18.10.1.3. By Product Type
18.10.1.4. By Application
18.10.1.5. By End Use
18.11. GCC Countries Biodegradable Cups Market Analysis 2022 & 2027
18.11.1. Market Value (US$ Mn) & Volume (Mn Units) Analysis and Forecast by Market Taxonomy
18.11.1.1. By Capacity
18.11.1.2. By Material Type
18.11.1.3. By Product Type
18.11.1.4. By Application
18.11.1.5. By End Use
18.12. Northern Africa Biodegradable Cups Market Analysis 2022 & 2027
18.12.1. Market Value (US$ Mn) & Volume (Mn Units) Analysis and Forecast by Market Taxonomy
18.12.1.1. By Capacity
18.12.1.2. By Material Type
18.12.1.3. By Product Type
18.12.1.4. By Application
18.12.1.5. By End Use
19. Competitive Landscape
19.1. Market Structure
19.2. Competition Dashboard
19.3. Company Market Share Analysis
19.4. Company Profiles (Details – Overview, Financials, Strategy, Recent Developments, SWOT analysis)
19.5. Competition Deep Dive
19.5.1. Huhtamaki Oyj
19.5.1.1. Overview
19.5.1.2. Financials
19.5.1.3. Strategy
19.5.1.4. Recent Developments
19.5.1.5. SWOT Analysis
19.5.2. Colpac Ltd.
19.5.2.1. Overview
19.5.2.2. Financials
19.5.2.3. Strategy
19.5.2.4. Recent Developments
19.5.2.5. SWOT Analysis
19.5.3. Benders Paper Cup Company
19.5.3.1. Overview
19.5.3.2. Financials
19.5.3.3. Strategy
19.5.3.4. Recent Developments
19.5.3.5. SWOT Analysis
19.5.4. Fabri-Kal
19.5.4.1. Overview
19.5.4.2. Financials
19.5.4.3. Strategy
19.5.4.4. Recent Developments
19.5.4.5. SWOT Analysis
19.5.5. World Centric®
19.5.5.1. Overview
19.5.5.2. Financials
19.5.5.3. Strategy
19.5.5.4. Recent Developments
19.5.5.5. SWOT Analysis
19.5.6. Bio Futura B.V.
19.5.6.1. Overview
19.5.6.2. Financials
19.5.6.3. Strategy
19.5.6.4. Recent Developments
19.5.6.5. SWOT Analysis
19.5.7. Genpak LLC
19.5.7.1. Overview
19.5.7.2. Financials
19.5.7.3. Strategy
19.5.7.4. Recent Developments
19.5.7.5. SWOT Analysis
19.5.8. Dart Container Corporation
19.5.8.1. Overview
19.5.8.2. Financials
19.5.8.3. Strategy
19.5.8.4. Recent Developments
19.5.8.5. SWOT Analysis
19.5.9. Pactiv LLC
19.5.9.1. Overview
19.5.9.2. Financials
19.5.9.3. Strategy
19.5.9.4. Recent Developments
19.5.9.5. SWOT Analysis
19.5.10. Lollicup USA, Inc.
19.5.10.1. Overview
19.5.10.2. Financials
19.5.10.3. Strategy
19.5.10.4. Recent Developments
19.5.10.5. SWOT Analysis
19.5.11. Eco-Products, Inc.
19.5.11.1. Overview
19.5.11.2. Financials
19.5.11.3. Strategy
19.5.11.4. Recent Developments
19.5.11.5. SWOT Analysis
19.5.12. Go-Pak UK LTD.
19.5.12.1. Overview
19.5.12.2. Financials
19.5.12.3. Strategy
19.5.12.4. Recent Developments
19.5.12.5. SWOT Analysis
19.5.13. Vegware
19.5.13.1. Overview
19.5.13.2. Financials
19.5.13.3. Strategy
19.5.13.4. Recent Developments
19.5.13.5. SWOT Analysis
19.5.14. Scyphus Limited
19.5.14.1. Overview
19.5.14.2. Financials
19.5.14.3. Strategy
19.5.14.4. Recent Developments
19.5.14.5. SWOT Analysis
19.5.15. Nupik-flo UK Ltd
19.5.15.1. Overview
19.5.15.2. Financials
19.5.15.3. Strategy
19.5.15.4. Recent Developments
19.5.15.5. SWOT Analysis
19.5.16. Biopak Pty Ltd.
19.5.16.1. Overview
19.5.16.2. Financials
19.5.16.3. Strategy
19.5.16.4. Recent Developments
19.5.16.5. SWOT Analysis
19.5.17. Detpak
19.5.17.1. Overview
19.5.17.2. Financials
19.5.17.3. Strategy
19.5.17.4. Recent Developments
19.5.17.5. SWOT Analysis
19.5.18. BVO International GmbH
19.5.18.1. Overview
19.5.18.2. Financials
19.5.18.3. Strategy
19.5.18.4. Recent Developments
19.5.18.5. SWOT Analysis
19.5.19. Good Start Packaging
19.5.19.1. Overview
19.5.19.2. Financials
19.5.19.3. Strategy
19.5.19.4. Recent Developments
19.5.19.5. SWOT Analysis
19.5.20. The Cup Folk.
19.5.20.1. Overview
19.5.20.2. Financials
19.5.20.3. Strategy
19.5.20.4. Recent Developments
19.5.20.5. SWOT Analysis
20. Assumptions and Acronyms Used
21. Research Methodology
List of Tables
Table 01: Global Biodegradable Cups Market Value (US$ Mn) and Volume (Mn Units) 2014-2027, by Capacity
Table 02: Global Biodegradable Cups Market Value (US$ Mn) and Volume (Mn Units) 2014-2027, by Capacity
Table 03: Global Biodegradable Cups Market Value (US$ Mn) and Volume (Mn Units) 2014-2027, by Material Type
Table 04: Global Biodegradable Cups Market Value (US$ Mn) and Volume (Mn Units) 2014-2027, by Material Type
Table 05: Global Biodegradable Cups Market Value (US$ Mn) and Volume (Mn Units) 2014-2027, by Product Type
Table 06: Global Biodegradable Cups Market Value (US$ Mn) and Volume (Mn Units) 2014-2027, by Product Type
Table 07: Global Biodegradable Cups Market Value (US$ Mn) and Volume (Mn Units) 2014-2027, by Application
Table 08: Global Biodegradable Cups Market Value (US$ Mn) and Volume (Mn Units) 2014-2027, by Application
Table 09: Global Biodegradable Cups Market Value (US$ Mn) and Volume (Mn Units) 2014-2027, by End Use
Table 10: Global Biodegradable Cups Market Value (US$ Mn) and Volume (Mn Units) 2014-2027, by End Use
Table 11: Global Biodegradable Cups Market Value (US$ Mn) and Volume (Mn Units) 2014-2027, by Region
Table 12: North America Biodegradable Cups Market Value (US$ Mn) and Volume (Mn Units) 2014-2027, by Country
Table 13: North America Biodegradable Cups Market Value (US$ Mn) and Volume (Mn Units) 2014-2027, by Capacity
Table 14: North America Biodegradable Cups Market Value (US$ Mn) and Volume (Mn Units) 2014-2027, by Material Type
Table 15: North America Biodegradable Cups Market Value (US$ Mn) and Volume (Mn Units) 2014-2027, by Product Type
Table 16: North America Biodegradable Cups Market Value (US$ Mn) and Volume (Mn Units) 2014-2027, by Application
Table 17: North America Biodegradable Cups Market Value (US$ Mn) and Volume (Mn Units) 2014-2027, by End Use
Table 18: Latin America Biodegradable Cups Market Value (US$ Mn) and Volume (Mn Units) 2014-2027, by Country
Table 19: Latin America Biodegradable Cups Market Value (US$ Mn) and Volume (Mn Units) 2014-2027, by Capacity
Table 20: Latin America Biodegradable Cups Market Value (US$ Mn) and Volume (Mn Units) 2014-2027, by Material Type
Table 21: Latin America Biodegradable Cups Market Value (US$ Mn) and Volume (Mn Units) 2014-2027, by Product Type
Table 22: Latin America Biodegradable Cups Market Value (US$ Mn) and Volume (Mn Units) 2014-2027, by Application
Table 23: Latin America Biodegradable Cups Market Value (US$ Mn) and Volume (Mn Units) 2014-2027, by End Use
Table 24: Europe Biodegradable Cups Market Value (US$ Mn) and Volume (Mn Units) 2014-2027, by Country
Table 25: Europe Biodegradable Cups Market Value (US$ Mn) and Volume (Mn Units) 2014-2027, by Capacity
Table 26: Europe Biodegradable Cups Market Value (US$ Mn) and Volume (Mn Units) 2014-2027, by Material Type
Table 27: Europe Biodegradable Cups Market Value (US$ Mn) and Volume (Mn Units) 2014-2027, by Product Type
Table 28: Europe Biodegradable Cups Market Value (US$ Mn) and Volume (Mn Units) 2014-2027, by Application
Table 29: Europe Biodegradable Cups Market Value (US$ Mn) and Volume (Mn Units) 2014-2027, by End Use
Table 30: APAC Biodegradable Cups Market Value (US$ Mn) and Volume (Mn Units) 2014-2027, by Country
Table 31: APAC Biodegradable Cups Market Value (US$ Mn) and Volume (Mn Units) 2014-2027, by Capacity
Table 32: APAC Biodegradable Cups Market Value (US$ Mn) and Volume (Mn Units) 2014-2027, by Material Type
Table 33: APAC Biodegradable Cups Market Value (US$ Mn) and Volume (Mn Units) 2014-2027, by Product Type
Table 34: APAC Biodegradable Cups Market Value (US$ Mn) and Volume (Mn Units) 2014-2027, by Application
Table 35: APAC Biodegradable Cups Market Value (US$ Mn) and Volume (Mn Units) 2014-2027, by End Use
Table 36: MEA Biodegradable Cups Market Value (US$ Mn) and Volume (Mn Units) 2014-2027, by Country
Table 37: MEA Biodegradable Cups Market Value (US$ Mn) and Volume (Mn Units) 2014-2027, by Capacity
Table 38: MEA Biodegradable Cups Market Value (US$ Mn) and Volume (Mn Units) 2014-2027, by Material Type
Table 39: MEA Biodegradable Cups Market Value (US$ Mn) and Volume (Mn Units) 2014-2027, by Product Type
Table 40: MEA Biodegradable Cups Market Value (US$ Mn) and Volume (Mn Units) 2014-2027, by Application
Table 41: MEA Biodegradable Cups Market Value (US$ Mn) and Volume (Mn Units) 2014-2027, by End Use
List of Figures
Figure 01: Global Biodegradable Cups Market Volume (Mn Units) Projection (2014-2027) and Y-o-Y growth (2020-2027)
Figure 02: Global Biodegradable Cups Market Value (US$ Mn) Projection (2014-2027) and Y-o-Y growth (2020-2027)
Figure 03: Global Biodegradable Cups Market BPS analysis (2022 & 2027), by Capacity
Figure 04: Global Biodegradable Cups Market Y-o-Y growth, by Capacity 2020-2027
Figure 05: Global Biodegradable Cups Market Attractiveness Analysis, by Capacity, 2022-2027
Figure 06: Global Biodegradable Cups Market Value Share (2022 & 2027), by Material Type
Figure 07: Global Biodegradable Cups Market Y-o-Y growth, by Material Type 2020-2027
Figure 08: Global Biodegradable Cups Market Attractiveness Analysis, by Material Type, 2022-2027
Figure 09: Global Biodegradable Cups Market Value Share (2022 & 2027), by Product Type
Figure 10: Global Biodegradable Cups Market Y-o-Y growth, by Product Type 2020-2027
Figure 11: Global Biodegradable Cups Market Attractiveness Analysis, by Product Type, 2022-2027
Figure 12: Global Biodegradable Cups Market Value Share (2022 & 2027), by Application
Figure 13: Global Biodegradable Cups Market Y-o-Y growth, by Application 2020-2027
Figure 14: Global Biodegradable Cups Market Attractiveness Analysis, by Application, 2022-2027
Figure 15: Global Biodegradable Cups Market Value Share (2022 & 2027), by End Use
Figure 16: Global Biodegradable Cups Market Y-o-Y growth, by End Use 2020-2027
Figure 17: Global Biodegradable Cups Market Attractiveness Analysis, by End Use, 2022-2027
Figure 18: Global Biodegradable Cups Market Value Share and BPS Analysis, by Region, 2022 & 2027
Figure 19: Global Biodegradable Cups Market Y-o-Y growth, by Region 2020-2027
Figure 20: Global Biodegradable Cups Market Attractiveness Analysis, by Region, 2022-2027
Figure 21: North America Biodegradable Cups Market Value Share, by Country (2022)
Figure 22: North America Biodegradable Cups Market Value Share, by Capacity (2022)
Figure 23: North America Biodegradable Cups Market Value Share, by Material Type (2022)
Figure 24: North America Biodegradable Cups Market Value Share, by Product Type (2022)
Figure 25: North America Biodegradable Cups Market Value Share, by Application (2022)
Figure 26: North America Biodegradable Cups Market Value Share, by End Use (2022)
Figure 27: North America Biodegradable Cups Market Attractiveness Analysis, by Country, 2022-2027
Figure 28: North America Biodegradable Cups Market Y-o-Y growth, by Capacity, (2020-2027)
Figure 29: North America Biodegradable Cups Market Y-o-Y growth, by Material Type, (2020-2027)
Figure 30: North America Biodegradable Cups Market Attractiveness Analysis, by Product Type, (2022-2027)
Figure 31: North America Biodegradable Cups Market Attractiveness Analysis, by Application, (2022-2027)
Figure 32: North America Biodegradable Cups Market Attractiveness Analysis, by End Use, (2022-2027)
Figure 33: Latin America Biodegradable Cups Market Value Share, by Country (2022)
Figure 34: Latin America Biodegradable Cups Market Value Share, by Capacity (2022)
Figure 35: Latin America Biodegradable Cups Market Value Share, by Material Type (2022)
Figure 36: Latin America Biodegradable Cups Market Value Share, by Product Type (2022)
Figure 37: Latin America Biodegradable Cups Market Value Share, by Application (2022)
Figure 38: Latin America Biodegradable Cups Market Value Share, by End Use (2022)
Figure 39: Latin America Biodegradable Cups Market Attractiveness Analysis, by Country, 2022-2027
Figure 40: Latin America Biodegradable Cups Market Y-o-Y growth, by Capacity, (2020-2027)
Figure 41: Latin America Biodegradable Cups Market Y-o-Y growth, by Material Type, (2020-2027)
Figure 42: Latin America Biodegradable Cups Market Attractiveness Analysis, by Product Type, (2022-2027)
Figure 43: Latin America Biodegradable Cups Market Attractiveness Analysis, by Application, (2022-2027)
Figure 44: Latin America Biodegradable Cups Market Attractiveness Analysis, by End Use, (2022-2027)
Figure 45: Europe Biodegradable Cups Market Value Share, by Country (2022)
Figure 46: Europe Biodegradable Cups Market Value Share, by Capacity (2022)
Figure 47: Europe Biodegradable Cups Market Value Share, by Material Type (2022)
Figure 48: Europe Biodegradable Cups Market Value Share, by Product Type (2022)
Figure 49: Europe Biodegradable Cups Market Value Share, by Application (2022)
Figure 50: Europe Biodegradable Cups Market Value Share, by End Use (2022)
Figure 51: Europe Biodegradable Cups Market Attractiveness Analysis, by Country, 2022-2027
Figure 52: Europe Biodegradable Cups Market Y-o-Y growth, by Capacity, (2020-2027)
Figure 53: Europe Biodegradable Cups Market Y-o-Y growth, by Material Type, (2020-2027)
Figure 54: Europe Biodegradable Cups Market Attractiveness Analysis, by Product Type, (2022-2027)
Figure 55: Europe Biodegradable Cups Market Attractiveness Analysis, by Application, (2022-2027)
Figure 56: Europe Biodegradable Cups Market Attractiveness Analysis, by End Use, (2022-2027)
Figure 57: APAC Biodegradable Cups Market Value Share, by Country (2022)
Figure 58: APAC Biodegradable Cups Market Value Share, by Capacity (2022)
Figure 59: APAC Biodegradable Cups Market Value Share, by Material Type (2022)
Figure 60: APAC Biodegradable Cups Market Value Share, by Product Type (2022)
Figure 61: APAC Biodegradable Cups Market Value Share, by Application (2022)
Figure 62: APAC Biodegradable Cups Market Value Share, by End Use (2022)
Figure 63: APAC Biodegradable Cups Market Attractiveness Analysis, by Country, 2022-2027
Figure 64: APAC Biodegradable Cups Market Y-o-Y growth, by Capacity, (2020-2027)
Figure 65: APAC Biodegradable Cups Market Y-o-Y growth, by Material Type, (2020-2027)
Figure 66: APAC Biodegradable Cups Market Attractiveness Analysis, by Product Type, (2022-2027)
Figure 67: APAC Biodegradable Cups Market Attractiveness Analysis, by Application, (2022-2027)
Figure 68: APAC Biodegradable Cups Market Attractiveness Analysis, by End Use, (2022-2027)
Figure 69: MEA Biodegradable Cups Market Value Share, by Country (2022)
Figure 70: MEA Biodegradable Cups Market Value Share, by Capacity (2022)
Figure 71: MEA Biodegradable Cups Market Value Share, by Material Type (2022)
Figure 72: MEA Biodegradable Cups Market Value Share, by Product Type (2022)
Figure 73: MEA Biodegradable Cups Market Value Share, by Application (2022)
Figure 74: MEA Biodegradable Cups Market Value Share, by End Use (2022)
Figure 75: MEA Biodegradable Cups Market Attractiveness Analysis, by Country, 2022-2027
Figure 76: MEA Biodegradable Cups Market Y-o-Y growth, by Capacity, (2020-2027)
Figure 77: MEA Biodegradable Cups Market Y-o-Y growth, by Material Type, (2020-2027)
Figure 78: MEA Biodegradable Cups Market Attractiveness Analysis, by Product Type, (2022-2027)
Figure 79: MEA Biodegradable Cups Market Attractiveness Analysis, by Application, (2022-2027)
Figure 80: MEA Biodegradable Cups Market Attractiveness Analysis, by End Use, (2022-2027)
Copyright © Transparency Market Research, Inc. All Rights reserved
Trust Online


Biodegradable Cups Market