
3D Radar Market – Snapshot
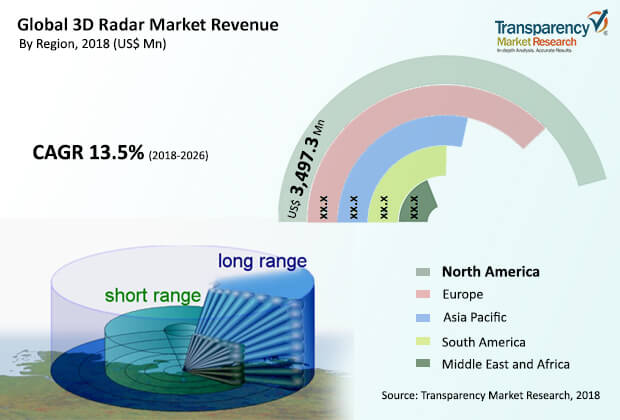
3D Radar provides radar coverage in three dimensions. 3D Radars can be used for multiple applications based on characteristics such as antenna’s height and target detection range. Deployment of 3D Radar in the industry sector is growing significantly because 3D Radars provide more accurate and precise data. Increasing government investments in military and defense in order to enhance detection capabilities, and surveillance resolution and duration is expected to drive the market growth during the forecast period. Furthermore, companies are emphasizing on the manufacturing of lightweight and innovative radars. Governments and automotive companies will continue to invest huge amounts in the advancement of 3D Radar. The 3D Radar market is estimated to reach value of US$ 27,919.8 Mn by 2026, recording a CAGR of 13.5%.
Several developed economies are progressively increasing their defense budgets for national safety and security. In addition, emerging countries are replacing legacy radar systems with 3D Radar systems in order to provide better border surveillance. Thus, growing economic and security concerns among different countries is anticipated to contribute significantly to market growth. Furthermore, increasing demand for lightweight radars which can be easily integrated in almost any type of mobile platform, fixed structure, or C² systems is contributing to the growth of the market.
However, high implementation cost of certain radars (as some radars have shorter lifecycle) is expected to hamper the market growth during the forecast period.
Furthermore, companies are finding integration of artificial intelligence into radar systems a huge opportunity to develop advanced products. Companies are investing massive amounts to meet the growing needs of commercial enterprises and governments to deploy technologically advance radars.
The 3D Radar market is segmented on the basis of component, frequency band, industry, and platform. Based on component, the market is segmented into software, hardware, and services. Services component can be further segmented into consulting, installation & integration, and maintenance. Based on frequency band, the market is segmented into HF- and VHF- Radar, C- Band (UHF- Radar), D- Band (L-Band Radar), E/F-Band (S-Band Radar), and others. Based on platform, the market can be segmented into airborne, ground, and naval. On the basis of industry vertical, the market is segmented into automotive and public infrastructure, energy & utilities, government and others (agriculture, hospitals etc). From a geographical perspective, North America is expected to hold major share in the 3D Radar market. Growth in this region is attributed to strong adoption and penetration of 3D Radar in the military segment, as well as presence of large number of manufacturers in the region. Asia Pacific is expected to witness lucrative growth due to the rising adoption of technologically advanced 3D Radar systems.
3D Radar is prominently expanding with crucial technological advancements in different industry sectors; therefore existing players are focusing on maintaining their market presence by investing huge amounts in research and development. The market is extremely saturated and consists of many local and regional players. Companies present in the market are focusing on consolidating their foothold in the 3D Radar market by strategic partnerships, product innovation, and investments in research & development. For instance, in January 2017, under a US$ 122.04 Mn contract, BAE Systems developed, manufactured, and provided support for 19 of the radars of the Royal Navy until 2022. All 19 Artisan 3D systems were delivered to the Ministry of Defence (MoD) by the middle of 2017.
Some of the active players profiled in the 3D Radar market report include Airbus Defense and Space, BAE Systems plc, Harris Corporation, Honeywell International Inc., Leonardo S.p.A., Lockheed Martin, Northrop Grumman Corporation, Rockwell Collins, SAAB Group, and Thales Group.
3D Radar Market to Rise Notably Owing to Increasing Applications in Target Identification Range
3D Radar is an essential piece of any safeguard stock and this innovation is utilized for recognizing and following the bits of knowledge and data. The 3D Radar gives a total subsurface discovery framework which is using a blend of COTS (business off the rack) GPR parts and custom programming to achieve strong metallic and non-metallic item identification execution. The 3D Radar decides the height, territory and speed of the article. These radars have a few highlights like programmed location of airborne targets and work every minute of every day under every single climate condition, among others. These radars are used in certain applications, for example, hole filler to fundamental air guard radar framework, for insurance of touchy destinations and for neighborhood air protection C3 framework, among others.
3D Radar gives radar inclusion in three measurements. 3D Radars can be utilized for various applications dependent on attributes, for example, receiving wire's tallness and target identification range. Sending of 3D Radar in the business area is developing essentially on the grounds that 3D Radars give more exact and exact information. Expanding government interests in military and guard to upgrade recognition capacities, and observation goal and term is required to drive the market development during the gauge time frame. Moreover, organizations are accentuating on the assembling of lightweight and imaginative radars. Governments and auto organizations will keep on putting enormous sums in the headway of 3D Radar.
A few created economies are dynamically expanding their guard financial plans for public wellbeing and security. Moreover, arising nations are supplanting inheritance radar frameworks with 3D Radar frameworks to give better boundary reconnaissance. In this way, becoming monetary and security worries among various nations is expected to contribute altogether to showcase development. Moreover, expanding interest for lightweight radars which can be handily coordinated in practically any sort of versatile stage, fixed design, or C² frameworks is adding to the development of the market. On the flipside, the fact that some radars have a shorter lifecycle, and the high cost of implementation may create a challenging atmosphere for the market in the coming years.
The global 3D Radar market is segmented as below:
|
Component |
|
|
Frequency Band |
|
|
Industry |
|
|
Platform |
|
|
Geography |
|
1. Preface
1.1. Market Scope
1.2. Market Segmentation
1.3. Key Research Objectives
2. Assumptions and Research Methodology
2.1. Market Taxonomy - Segment Definitions
2.2. Research Methodology
2.2.1. List of Primary and Secondary Sources
2.3. Key Assumptions for Data Modelling
3. Executive Summary: Global 3D Radar Market
4. Market Overview
4.1. Introduction
4.1.1. Comparison of 2D Radarand 3D Radar
4.1.2. 3D Radar Architecture
4.2. Global Market – Macro Economic Factors Overview
4.2.1. World GDP Indicator – For Top 20 Economies
4.2.2. Global ICT Spending (US$ Mn), 2012, 2018, 2026
4.2.3. Key Regional Socio-Political-Technological Developments and their Impact Considerations
4.3. Technology/Product Roadmap
4.4. Market Factor Analysis
4.4.1. Porter’s Five Forces Analysis
4.4.2. PESTEL Analysis
4.4.3. Value Chain Analysis
4.4.4. Market Dynamics (Growth Influencers)
4.4.4.1. Drivers
4.4.4.2. Restraints
4.4.4.3. Opportunities
4.4.4.4. Impact Analysis of Drivers & Restraints
4.5. Case study 3D Radar Application Analysis
4.5.1. Weather forecasting
4.5.2. Surveillance
4.5.3. Air defense
4.6. 3D Radars and Government Contracts
4.7. Regulations and Policies – By Region
4.8. Global 3D Radar Market Analysis and Forecast, 2016 - 2026
4.8.1. Market Revenue Analysis (US$ Mn)
4.8.1.1. Historic growth trends, 2012-2017
4.8.1.2. Forecast trends, 2017-2026
4.9. Global Market Attractiveness Analysis –
4.9.1. By Region/Country
4.9.2. By Platform
4.9.3. By Type
4.9.4. By Industry
4.9.5. By Component
4.10. Market Outlook
4.11. Competitive Scenario and Trends
4.11.1. 3D Radar Market Concentration Rate
4.11.1.1. List of New Entrants
4.11.2. Mergers & Acquisitions, Expansions
5. Global 3D Radar Market Analysis and Forecast, By Component
5.1. Overview and Definition
5.2. Key Segment Analysis
5.3. 3D Radar Market Size (US$ Mn) Forecast, By Component, 2016 - 2026
5.3.1. Hardware
5.3.2. Software
5.3.3. Services
5.3.3.1. Consulting
5.3.3.2. Installation & Integration
5.3.3.3. Maintenance
6. Global 3D Radar Market Analysis and Forecast, By Frequency Band
6.1. Overview and Definition
6.2. Key Segment Analysis
6.3. 3D Radar Market Size (US$ Mn) Forecast, By Frequency Band, 2016 - 2026
6.3.1. HF- and VHF- Radar
6.3.2. C- Band (UHF- Radar)
6.3.3. D- Band (L-Band Radar)
6.3.4. E/F-Band (S-Band Radar)
6.3.5. Others
7. Global 3D Radar Market Analysis and Forecast, By Platform
7.1. Overview and Definition
7.2. Key Segment Analysis
7.3. 3D Radar Market Size (US$ Mn) Forecast, By Platform, 2016 - 2026
7.3.1. Airborne
7.3.2. Ground
7.3.3. Naval
8. Global 3D Radar Market Analysis and Forecast, By Industry
8.1. Overview & Definition
8.2. Industry GDP Share (%) for Top 12 countries (on GDP basis)
8.3. Key Segment Analysis
8.4. 3D Radar Market Size (US$ Mn) Forecast, By Industry, 2016 - 2026
8.4.1. Automotive and Public Infrastructure
8.4.2. Energy & Utilities
8.4.3. Government
8.4.4. Others
8.5. Market Attractiveness By Industry
9. Global 3D Radar Market Analysis and Forecast, by Region
9.1. Overview
9.2. Key Segment Analysis
9.3. 3D Radar Market Size (US$ Mn) Forecast, by Region, 2016 - 2026
9.3.1. North America
9.3.2. Europe
9.3.3. Asia Pacific
9.3.4. Middle East and Africa
9.3.5. South America
9.4. Market Attractiveness by Region
10. North America 3D Radar Market Analysis and Forecast
10.1. Key Findings
10.2. Impact Analysis of Drivers & Restraints
10.3. 3D Radar Market Size (US$ Mn) Forecast, By Component, 2016 - 2026
10.3.1. Hardware
10.3.2. Software
10.3.3. Services
10.3.3.1. Consulting
10.3.3.2. Installation & Integration
10.3.3.3. Maintenance
10.4. 3D Radar Market Size (US$ Mn) Forecast, By Frequency Band, 2016 - 2026
10.4.1. HF- and VHF- Radar
10.4.2. C- Band (UHF- Radar)
10.4.3. D- Band (L-Band Radar)
10.4.4. E/F-Band (S-Band Radar)
10.4.5. Others
10.5. 3D Radar Market Size (US$ Mn) Forecast, By Platform, 2016 - 2026
10.5.1. Airborne
10.5.2. Ground
10.5.3. Naval
10.6. 3D Radar Market Size (US$ Mn) Forecast, By Industry, 2016 - 2026
10.6.1. Automotive and Public Infrastructure
10.6.2. Energy & Utilities
10.6.3. Government
10.6.4. Others
10.7. 3D Radar Market Size (US$ Mn) Forecast, By Country, 2016 - 2026
10.7.1. The U.S.
10.7.2. Canada
10.7.3. Rest of North America
10.8. Market Attractiveness Analysis
10.8.1. By Component
10.8.2. By Frequency Band
10.8.3. By Platform
10.8.4. By Industry
10.8.5. By Country
11. Europe 3D Radar Market Analysis and Forecast
11.1. Key Findings
11.2. Impact Analysis of Drivers & Restraints
11.3. 3D Radar Market Size (US$ Mn) Forecast, By Component, 2016 - 2026
11.3.1. Hardware
11.3.2. Software
11.3.3. Services
11.3.3.1. Consulting
11.3.3.2. Installation & Integration
11.3.3.3. Maintenance
11.4. 3D Radar Market Size (US$ Mn) Forecast, By Frequency Band, 2016 - 2026
11.4.1. HF- and VHF- Radar
11.4.2. C- Band (UHF- Radar)
11.4.3. D- Band (L-Band Radar)
11.4.4. E/F-Band (S-Band Radar)
11.4.5. Others
11.5. 3D Radar Market Size (US$ Mn) Forecast, By Platform, 2016 - 2026
11.5.1. Airborne
11.5.2. Ground
11.5.3. Naval
11.6. 3D Radar Market Size (US$ Mn) Forecast, By Industry, 2016 - 2026
11.6.1. Automotive and Public Infrastructure
11.6.2. Energy & Utilities
11.6.3. Government
11.6.4. Others
11.7. 3D Radar Market Size (US$ Mn) Forecast, By Country, 2016 - 2026
11.7.1. Germany
11.7.2. France
11.7.3. UK
11.7.4. Italy
11.7.5. Rest of Europe
11.8. Market Attractiveness Analysis
11.8.1. By Component
11.8.2. By Frequency Band
11.8.3. By Platform
11.8.4. By Industry
11.8.5. By Country
12. Asia Pacific 3D Radar Market Analysis and Forecast
12.1. Key Findings
12.2. Impact Analysis of Drivers & Restraints
12.3. 3D Radar Market Size (US$ Mn) Forecast, By Component, 2016 - 2026
12.3.1. Hardware
12.3.2. Software
12.3.3. Services
12.3.3.1. Consulting
12.3.3.2. Installation & Integration
12.3.3.3. Maintenance
12.4. 3D Radar Market Size (US$ Mn) Forecast, By Frequency Band, 2016 - 2026
12.4.1. HF- and VHF- Radar
12.4.2. C- Band (UHF- Radar)
12.4.3. D- Band (L-Band Radar)
12.4.4. E/F-Band (S-Band Radar)
12.4.5. Others
12.5. 3D Radar Market Size (US$ Mn) Forecast, By Platform, 2016 - 2026
12.5.1. Airborne
12.5.2. Ground
12.5.3. Naval
12.6. 3D Radar Market Size (US$ Mn) Forecast, By Industry, 2016 - 2026
12.6.1. Automotive and Public Infrastructure
12.6.2. Energy & Utilities
12.6.3. Government
12.6.4. Others
12.7. 3D Radar Market Size (US$ Mn) Forecast, By Country, 2016 - 2026
12.7.1. China
12.7.2. Japan
12.7.3. India
12.7.4. Australia
12.7.5. Rest of Asia Pacific
12.8. Market Attractiveness Analysis
12.8.1. By Component
12.8.2. By Frequency Band
12.8.3. By Platform
12.8.4. By Industry
12.8.5. By Country
13. Middle East &Africa (MEA) 3D Radar Market Analysis and Forecast
13.1. Key Findings
13.2. Impact Analysis of Drivers & Restraints
13.3. 3D Radar Market Size (US$ Mn) Forecast, By Component, 2016 - 2026
13.3.1. Hardware
13.3.2. Software
13.3.3. Services
13.3.3.1. Consulting
13.3.3.2. Installation & Integration
13.3.3.3. Maintenance
13.4. 3D Radar Market Size (US$ Mn) Forecast, By Frequency Band, 2016 - 2026
13.4.1. HF- and VHF- Radar
13.4.2. C- Band (UHF- Radar)
13.4.3. D- Band (L-Band Radar)
13.4.4. E/F-Band (S-Band Radar)
13.4.5. Others
13.5. 3D Radar Market Size (US$ Mn) Forecast, By Platform, 2016 - 2026
13.5.1. Airborne
13.5.2. Ground
13.5.3. Naval
13.6. 3D Radar Market Size (US$ Mn) Forecast, By Industry, 2016 - 2026
13.6.1. Automotive and Public Infrastructure
13.6.2. Energy & Utilities
13.6.3. Government
13.6.4. Others
13.7. 3D Radar Market Size (US$ Mn) Forecast, By Country, 2016 - 2026
13.7.1. GCC
13.7.2. South Africa
13.7.3. Rest of MEA
13.8. Market Attractiveness Analysis
13.8.1. By Component
13.8.2. By Frequency Band
13.8.3. By Platform
13.8.4. By Industry
13.8.5. By Country
14. South America Global 3D Radar Market Analysis and Forecast
14.1. Key Findings
14.2. Impact Analysis of Drivers & Restraints
14.3. 3D Radar Market Size (US$ Mn) Forecast, By Component, 2016 - 2026
14.3.1. Hardware
14.3.2. Software
14.3.3. Services
14.3.3.1. Consulting
14.3.3.2. Installation & Integration
14.3.3.3. Maintenance
14.4. 3D Radar Market Size (US$ Mn) Forecast, By Frequency Band, 2016 - 2026
14.4.1. HF- and VHF- Radar
14.4.2. C- Band (UHF- Radar)
14.4.3. D- Band (L-Band Radar)
14.4.4. E/F-Band (S-Band Radar)
14.4.5. Others
14.5. 3D Radar Market Size (US$ Mn) Forecast, By Platform, 2016 - 2026
14.5.1. Airborne
14.5.2. Ground
14.5.3. Naval
14.6. 3D Radar Market Size (US$ Mn) Forecast, By Industry, 2016 - 2026
14.6.1. Automotive and Public Infrastructure
14.6.2. Energy & Utilities
14.6.3. Government
14.6.4. Others
14.7. 3D Radar Market Size (US$ Mn) Forecast, By Country, 2016 - 2026
14.7.1. Brazil
14.7.2. Rest of South America
14.8. Market Attractiveness Analysis
14.8.1. By Component
14.8.2. By Frequency Band
14.8.3. By Platform
14.8.4. By Industry
14.8.5. By Country
15. Competition Landscape
15.1. Market Player – Competition Matrix
15.2. Market Revenue Share Analysis (%), By Company (2017)
15.3. Regional Presence (Intensity Map)
16. Company Profiles(Details – Basic Overview, Sales Area/Geographical Presence, Key Competitors, Revenue, Recent Developments,Strategy)
16.1. Airbus Defense and Space
16.1.1. Basic Overview
16.1.2. Sales Area/Geographical Presence
16.1.3. Key Competitors
16.1.4. Revenue
16.1.5. Strategy
16.2. BAE Systems plc
16.2.1. Basic Overview
16.2.2. Sales Area/Geographical Presence
16.2.3. Key Competitors
16.2.4. Revenue
16.2.5. Strategy
16.3. Harris Corporation
16.3.1. Basic Overview
16.3.2. Sales Area/Geographical Presence
16.3.3. Key Competitors
16.3.4. Revenue
16.3.5. Strategy
16.4. Honeywell International Inc.
16.4.1. Basic Overview
16.4.2. Sales Area/Geographical Presence
16.4.3. Key Competitors
16.4.4. Revenue
16.4.5. Strategy
16.5. Leonardo S.p.A
16.5.1. Basic Overview
16.5.2. Sales Area/Geographical Presence
16.5.3. Key Competitors
16.5.4. Revenue
16.5.5. Strategy
16.6. Lockheed Martin
16.6.1. Basic Overview
16.6.2. Sales Area/Geographical Presence
16.6.3. Key Competitors
16.6.4. Revenue
16.6.5. Strategy
16.7. Northrop Grumman Corporation
16.7.1. Basic Overview
16.7.2. Sales Area/Geographical Presence
16.7.3. Key Competitors
16.7.4. Revenue
16.7.5. Strategy
16.8. Rockwell Collins
16.8.1. Basic Overview
16.8.2. Sales Area/Geographical Presence
16.8.3. Key Competitors
16.8.4. Revenue
16.8.5. Strategy
16.9. SAAB Group
16.9.1. Basic Overview
16.9.2. Sales Area/Geographical Presence
16.9.3. Key Competitors
16.9.4. Revenue
16.9.5. Strategy
16.10. Thales Group
16.10.1. Basic Overview
16.10.2. Sales Area/Geographical Presence
16.10.3. Key Competitors
16.10.4. Revenue
16.10.5. Strategy
17. Key Takeaways
List of Tables
Table 1: Military Expenditure by Country
Table 2: 3D Radar and major deals
Table 3: Global 3D Radar Market Revenue (US$ Mn) Forecast, by Component, 2016 - 2026
Table 4: Global 3D Radar Market Revenue (US$ Mn) Forecast, by Frequency Band, 2016 - 2026
Table 5: Global 3D Radar Market Revenue (US$ Mn) Forecast, by End-use Industry, 2016 - 2026
Table 6: Global 3D Radar Market Revenue (US$ Mn) Forecast, by Platform, 2016 - 2026
Table 7: Global 3D Radar Market Revenue (US$ Mn) Forecast, by Region, 2016 - 2026
Table 8: North America 3D Radar Market Revenue (US$ Mn) Forecast, by Component, 2016 - 2026
Table 9: North America 3D Radar Market Revenue (US$ Mn) Forecast, by Frequency Band, 2016 - 2026
Table 10: North America 3D Radar Market Revenue (US$ Mn) Forecast, by End-use Industry, 2016 - 2026
Table 11: North America 3D Radar Market Revenue (US$ Mn) Forecast, by Platform, 2016 - 2026
Table 12: North America 3D Radar Market Revenue (US$ Mn) Forecast, by Country, 2016 - 2026
Table 13: Europe 3D Radar Market Revenue (US$ Mn) Forecast, by Component, 2016 - 2026
Table 14: Europe 3D Radar Market Revenue (US$ Mn) Forecast, by Frequency Band, 2016 - 2026
Table 15: Europe 3D Radar Market Revenue (US$ Mn) Forecast, by End-use Industry, 2016 - 2026
Table 16: Europe 3D Radar Market Revenue (US$ Mn) Forecast, by Platform, 2016 - 2026
Table 17: Europe 3D Radar Market Revenue (US$ Mn) Forecast, by Country, 2016 - 2026
Table 18: Asia Pacific 3D Radar Market Revenue (US$ Mn) Forecast, by Component, 2016 - 2026
Table 19: Asia Pacific 3D Radar Market Revenue (US$ Mn) Forecast, by Frequency Band , 2016 - 2026
Table 20: Asia Pacific 3D Radar Market Revenue (US$ Mn) Forecast, by End-use Industry, 2016 - 2026
Table 21: Asia Pacific 3D Radar Market Revenue (US$ Mn) Forecast, by Platform, 2016 - 2026
Table 22: Asia Pacific 3D Radar Market Revenue (US$ Mn) Forecast, by Country, 2016 - 2026
Table 23: Middle East & Africa 3D Radar Market Revenue (US$ Mn) Forecast, by Component, 2016 - 2026
Table 24: Middle East & Africa 3D Radar Market Revenue (US$ Mn) Forecast, by Frequency Band, 2016 - 2026
Table 25: Middle East & Africa 3D Radar Market Revenue (US$ Mn) Forecast, by End-use Industry, 2016 - 2026
Table 26: Middle East & Africa 3D Radar Market Revenue (US$ Mn) Forecast, by Platform, 2016 - 2026
Table 27: Middle East & Africa 3D Radar Market Revenue (US$ Mn) Forecast, by Country, 2016 - 2026
Table 28: South America 3D Radar Market Revenue (US$ Mn) Forecast, by Component, 2016 - 2026
Table 29: South America 3D Radar Market Revenue (US$ Mn) Forecast, by Frequency Band, 2016 - 2026
Table 30: South America 3D Radar Market Revenue (US$ Mn) Forecast, by End-use Industry, 2016 - 2026
Table 31: South America 3D Radar Market Revenue (US$ Mn) Forecast, by Platform, 2016 - 2026
Table 32: South America 3D Radar Market Revenue (US$ Mn) Forecast, by Country, 2016 - 2026
List of Figures
Figure 1: Global 3D Radar Market
Figure 2: 3D Radar Market Size (US$ Mn) Forecast, 2016 – 2026
Figure 3: Global 3D Radar Market Y-o-Y Growth (Value %) Forecast, 2017 – 2026
Figure 4: Historic growth trends and Y – o – Y Growth, 2012-2017
Figure 5: Forecast trends and Y – o – Y Growth, 2018-2026
Figure 6: Global 3D Radar Market Attractiveness Analysis, by Component (2018)
Figure 7: Global 3D Radar Market Attractiveness Analysis, by Frequency Band (2018)
Figure 8: Global 3D Radar Market Attractiveness Analysis, by Industry (2018)
Figure 9: Global 3D Radar Market Attractiveness Analysis, by Platform (2018)
Figure 10: Global 3D Radar Market Attractiveness Analysis, by Country (2018)
Figure 11: Global 3D Radar Market Share Analysis, by Component (2018)
Figure 12: Global 3D Radar Market Share Analysis, by Component (2026)
Figure 13 Global 3D Radar Market Share Analysis, by Frequency Band (2018)
Figure 14: Global 3D Radar Market Share Analysis, by Frequency Band (2026)
Figure 15: Global 3D Radar Market Share Analysis, by End-use Industry (2018)
Figure 16: Global 3D Radar Market Share Analysis, by End-use Industry (2026)
Figure 17: Global 3D Radar Market Share Analysis, by Platform (2018)
Figure 18: Global 3D Radar Market Share Analysis, by Platform (2026)
Figure 19: Global 3D Radar Market Share Analysis, by Region (2018)
Figure 20: Global 3D Radar Market Share Analysis, by Region (2026)
Figure 21: North America 3D Radar Market Size (US$ Mn) Forecast, 2016 – 2026
Figure 22 : North America 3D Radar Market Y-o-Y Growth (%) Forecast, 2018 – 2026
Figure 23: North America 3D Radar Market Share Analysis, by Component (2018)
Figure 24: North America 3D Radar Market Share Analysis, by Component (2026)
Figure 25: North America 3D Radar Market Share Analysis, by Frequency Band (2018)
Figure 26: North America 3D Radar Market Share Analysis, by Frequency Band (2026)
Figure 27: North America 3D Radar Market Share Analysis, by End-use Industry (2018)
Figure 28: North America 3D Radar Market Share Analysis, by End-use Industry (2026)
Figure 29: North America 3D Radar Market Share Analysis, by Platform (2018)
Figure 30: North America 3D Radar Market Share Analysis, by Platform (2026)
Figure 31: North America 3D Radar Market Share Analysis, by Country (2018)
Figure 32: North America 3D Radar Market Share Analysis, by Country (2026)
Figure 33: North America 3D Radar Market Attractiveness Analysis, by Component (2018)
Figure 34: North America 3D Radar Market Attractiveness Analysis, by Frequency Band (2018)
Figure 35: North America 3D Radar Market Attractiveness Analysis, by Industry (2018)
Figure 36: North America 3D Radar Market Attractiveness Analysis, by Platform (2018)
Figure 37: North America 3D Radar Market Attractiveness Analysis, by Country (2018)
Figure 38: Europe 3D Radar Market Size (US$ Mn) Forecast, 2016 – 2026
Figure 39: Europe 3D Radar Market Y-o-Y Growth (%) Forecast, 2018 – 2026
Figure 40: Europe 3D Radar Market Share Analysis, by Component (2018)
Figure 41: Europe 3D Radar Market Share Analysis, by Component (2026)
Figure 42: Europe 3D Radar Market Share Analysis, by Frequency Band (2018)
Figure 43: Europe 3D Radar Market Share Analysis, by Frequency Band (2026)
Figure 44: Europe 3D Radar Market Share Analysis, by End-use Industry (2018)
Figure 45: Europe 3D Radar Market Share Analysis, by End-use Industry (2026)
Figure 46: Europe 3D Radar Market Share Analysis, by Platform (2018)
Figure 47: Europe 3D Radar Market Share Analysis, by Platform (2026)
Figure 48: Europe 3D Radar Market Share Analysis, by Country (2018)
Figure 49: Europe 3D Radar Market Share Analysis, by Country (2026)
Figure 50: Europe 3D Radar Market Attractiveness Analysis, by Component (2018)
Figure 51: Europe 3D Radar Market Attractiveness Analysis, by Frequency Band (2018)
Figure 52: Europe 3D Radar Market Attractiveness Analysis, by Industry (2018)
Figure 53: Europe 3D Radar Market Attractiveness Analysis, by Platform (2018)
Figure 54: Europe 3D Radar Market Attractiveness Analysis, by Country (2018)
Figure 55: Asia Pacific 3D Radar Market Size (US$ Mn) Forecast, 2016 – 2026
Figure 56: Asia Pacific 3D Radar Market Y-o-Y Growth (%) Forecast, 2018 – 2026
Figure 57: Asia Pacific 3D Radar Market Share Analysis, by Frequency Band (2018)
Figure 58: Asia Pacific 3D Radar Market Share Analysis, by Frequency Band (2026)
Figure 59: Asia Pacific 3D Radar Market Share Analysis, by End-use Industry (2018)
Figure 60: Asia Pacific 3D Radar Market Share Analysis, by End-use Industry (2026)
Figure 61: Asia Pacific 3D Radar Market Share Analysis, by Platform (2018)
Figure 62: Asia Pacific 3D Radar Market Share Analysis, by Platform (2026)
Figure 63: Asia Pacific 3D Radar Market Share Analysis, by Country (2018)
Figure 64: Asia Pacific 3D Radar Market Share Analysis, by Country (2026)
Figure 65: Asia Pacific 3D Radar Market Attractiveness Analysis, by Component (2018)
Figure 66: Asia Pacific 3D Radar Market Attractiveness Analysis, by Frequency Band (2018)
Figure 67: Asia Pacific 3D Radar Market Attractiveness Analysis, by Industry (2018)
Figure 68: Asia Pacific 3D Radar Market Attractiveness Analysis, by Platform (2018)
Figure 69: Asia Pacific 3D Radar Market Attractiveness Analysis, by Country (2018)
Figure 70: Middle East & Africa 3D Radar Market Size (US$ Mn) Forecast, 2016 – 2026
Figure 71: Middle East & Africa 3D Radar Market Y-o-Y Growth (%) Forecast, 2018 – 2026
Figure 72: Middle East & Africa 3D Radar Market Share Analysis, by Component (2018)
Figure 73: Middle East & Africa 3D Radar Market Share Analysis, by Component (2026)
Figure 74: Middle East & Africa 3D Radar Market Share Analysis, by Frequency Band (2018)
Figure 75: Middle East & Africa 3D Radar Market Share Analysis, by Frequency Band (2026)
Figure 76: Middle East & Africa 3D Radar Market Share Analysis, by End-use Industry (2018)
Figure 77: Middle East & Africa 3D Radar Market Share Analysis, by End-use Industry (2026)
Figure 78: Middle East & Africa 3D Radar Market Share Analysis, by Platform (2018)
Figure 79: Middle East & Africa 3D Radar Market Share Analysis, by Platform (2026)
Figure 80: Middle East & Africa 3D Radar Market Share Analysis, by Country (2018)
Figure 81: Middle East & Africa 3D Radar Market Share Analysis, by Country (2026)
Figure 82: Middle East & Africa 3D Radar Market Attractiveness Analysis, by Component (2018)
Figure 83: Middle East & Africa 3D Radar Market Attractiveness Analysis, by Frequency Band (2018)
Figure 84: Middle East & Africa 3D Radar Market Attractiveness Analysis, by Industry (2018)
Figure 85: Middle East & Africa 3D Radar Market Attractiveness Analysis, by Platform (2018)
Figure 86: Middle East & Africa 3D Radar Market Attractiveness Analysis, by Country (2018)
Figure 87: South America 3D Radar Market Size (US$ Mn) Forecast, 2016 – 2026
Figure 88: South America 3D Radar Market Y-o-Y Growth (%) Forecast, 2018 – 2026
Figure 89: South America 3D Radar Market Share Analysis, by Component (2018)
Figure 90: South America 3D Radar Market Share Analysis, by Component (2026)
Figure 91: South America 3D Radar Market Share Analysis, by Frequency Band (2018)
Figure 92: South America 3D Radar Market Share Analysis, by Frequency Band (2026)
Figure 93: South America 3D Radar Market Share Analysis, by End-use Industry (2018)
Figure 94: South America 3D Radar Market Share Analysis, by End-use Industry (2026)
Figure 95: South America 3D Radar Market Share Analysis, by Platform (2018)
Figure 96: South America 3D Radar Market Share Analysis, by Platform (2026)
Figure 97: South America 3D Radar Market Share Analysis, by Country (2018)
Figure 98: South America 3D Radar Market Share Analysis, by Country (2026)
Figure 99: South America 3D Radar Market Attractiveness Analysis, by Component (2018)
Figure 100: South America 3D Radar Market Attractiveness Analysis, by Frequency Band (2018)
Figure 101: South America 3D Radar Market Attractiveness Analysis, by Industry (2018)
Figure 102: South America 3D Radar Market Attractiveness Analysis, by Platform (2018)
Figure 103: South America 3D Radar Market Attractiveness Analysis, by Country (2018)
Figure 104: Market Share Analysis, 2017 (Value %)
Figure 105: Airbus Defence and Space - Revenue (US$ Mn) & Y-o-Y Growth (%), 2015–2017
Figure 106: Airbus Defence and Space - Breakdown of Net Sales, by Geography, 2017
Figure 107: SAAB Group - Revenue (US$ Mn) & Y-o-Y Growth (%), 2015–2017
Figure 108: SAAB Group - Breakdown of Net Sales, by Geography, 2017
Figure 109: Lockheed Martin Corporation - Revenue (US$ Mn) & Y-o-Y Growth (%), 2015–2017
Figure 110: Lockheed Martin Corporation - Breakdown of Net Sales, by Geography, 2017
Figure 111: Leonardo S.p.A. - Revenue (US$ Mn) & Y-o-Y Growth (%), 2015–2017
Figure 112: Leonardo S.p.A. - Breakdown of Net Sales, by Geography 2017
Figure 113: Rockwell Collins - Revenue (US$ Mn) & Y-o-Y Growth (%), 2015–2017
Figure 114: Thales Group - Revenue (US$ Mn) & Y-o-Y Growth (%), 2015–2017
Figure 115: Thales Group -Breakdown of Net Sales, by Business Segment, 2017
Figure 116: Honeywell International Inc. - Revenue (US$ Mn) & Y-o-Y Growth (%), 2015–2017
Figure 117: Honeywell International Inc. - Breakdown of Net Sales, by Geography, 2017
Figure 118: Northrop Grumman Corporation - Revenue (US$ Mn) & Y-o-Y Growth (%), 2014–2016
Figure 119: Northrop Grumman Corporation - Breakdown of Net Sales, by Geography, 2016
Figure 120: BAE Systems - Revenue (US$ Mn) & Y-o-Y Growth (%), 2015–2017
Figure 121: BAE Systems - Breakdown of Net Sales, by Geography, 2017
Figure 122: Harris Corporation - Revenue (US$ Mn) & Y-o-Y Growth (%), 2014–2016
Figure 123: Harris Corporation - Breakdown of Net Sales, by Geography, 2017
Copyright © Transparency Market Research, Inc. All Rights reserved
Trust Online


3D Radar Market