
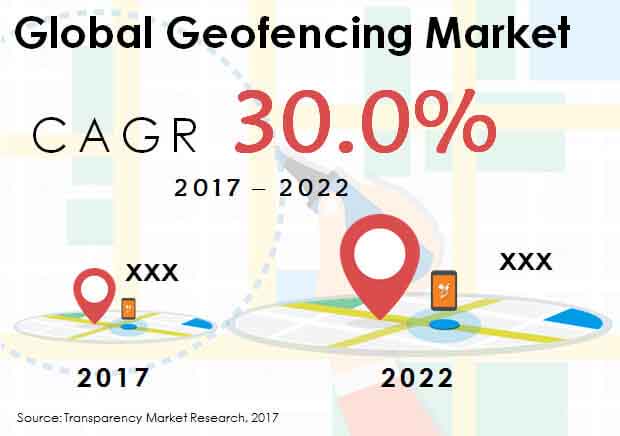
Multiple advanced satellites deployed around the globe have bolstered the global network for global positioning system (GPS). Through the use of robust GPS network, penetration of GPS-enabled devices, and by employing RFID technology, a new exercise of creating virtual geographic boundaries has emerged to be identified as geofencing. Geofencing software are enabling advertisers and marketing professionals target a specific customer base by triggering a response when the user’s mobile device arrives into or departs from a particular geographic area. According to Transparency Market Research’s latest study, the global market for geofencing is poised to expand at a stellar CAGR of 30.0% and generate revenues worth over US$ 2 billion by the end of 2022. The study has analyzed a range of entities encompassing theexpansion of global geofencing market for the forecast period, 2017-2022.
Moderate Penetration in Unlicensed Low Power Technology Networks
Considering the importance of strong networks in enabling the proper function of geofencing solutions, majority of end-users and software developer are focusing on cellular networks for deployment. Cellular networks has established framework, and are supported by regional governments. In the view that these networks are licensed, geofencing operations can be carried out effectively through the robust infrastructure provided by cellular networks. In 2017, over four-fifth of the revenues procured in the global geofencing market are anticipated to be accounted by the cellular networks. Meanwhile, unlicensed low power technology networks are failing to gain robust traction in the global geofencing market. By the end of 2022, revenues procured from geofencing operations executed through unlicensed low power technology networks are expected to surpass US$ 310 million, globally. During the forecast period, North America is anticipated to remain lucrative for use of unlicensed low power technology networks in execution of geofencing operations.
Transportation & Logistics to Register High End-Use
The report further projects that transportation & logistics will be observed as the largest end-user industry in the global geofencing market. Live tracking of fleet and other freight management operations are being improved by the use of geofencing software. Geofencing of destination zones are enabling logistics companies in getting real-time responses from truckers, which is further bolstering the product delivery mechanism. Nearly half of the global geofencing market is anticipated to incur revenues from the end-use in transportation & logistics industry by the end of 2017. The end-use of geofencing in healthcare and aerospace & defense industry is likely to remain steady and close-matched. Over the forecast period, the retail end-use of geofencing is also expected to gain traction in terms of revenue share.
Key Focus on Geofencing Software
Developers as well as end-users are primarily expending to buy effective geofencing software apps. By the end of 2022, the global sales of geofencing software applications are expected to bring in over US$ 1.1 billion in revenues. On the other hand, sales of smart sensors are anticipated to procure the lowest share on global revenues. RFID tags will also emerge as a key component being sold in the global geofencing market throughout the forecast period.
Geofencing Market: Companies to Watch
The study has profiled leading developers of geofencing software, products and solutions in the competition analysis on global geofencing market. GeoMoby, Mobinius Technologies Pvt. Ltd., Localytics, Bluedot Innovation, Apple Inc., Swirl Networks, Inc., Simpli.Fi, Thumbvista, and Mapcite are key companies anticipated to remain active in expansion of global geofencing market through 2022. Several market players are expected to also focus on development of applications on geoconquesting – an emerging advertising & marketing practice where customers are pulled away from the competitors by sending real-time messages to their locations.
Market Segmentation
Key sections in the report reveal the analysis and forecast of the global geofencing market across several segments. Primary segmentation of the global geofencing market includes the component, the type of network, end-use industry, and region.
|
On the basis of components |
|
|
Network-based |
|
|
Key end-use industries |
|
|
By Regions |
|
Additional information on cross-segmental analysis and country-specific forecast have also been delivered in the report.
Chapter 1 Global Geofencing Market - Executive Summary 22
Chapter 2 Global Geofencing Market Overview 24
2.1 Introduction 24
2.1.1 Global Geofencing Market Taxonomy 24
2.1.2 Global Geofencing Market Definition 24
2.2 Global Geofencing Market Size (US$ Mn) and Forecast, 2012-2022 24
2.2.1 Global Geofencing Market Y-o-Y Growth 24
2.3 Global Geofencing Market Dynamics 25
2.4 Smartphones Penetration 25
2.5 Internet Users Penetration 25
2.6 IoT Spendings 25
2.7 List of key Vendors 25
2.8 Key market Insights 25
2.9 Key Participants Market Presence (Intensity Map) By Region 26
Chapter 3 Global Geofencing Market Analysis and Forecast By Network Type 27
3.1 Global Geofencing Market Size and Forecast By Network Type , 2012-2022 27
3.1.1 Cellular Market Size and Forecast, 2012-2022 27
3.1.1.1 Revenue (US$ Mn) Comparison, By Region 27
3.1.1.2 Market Share Comparison, By Region 28
3.1.1.3 Y-o-Y growth Comparison, By Region 29
3.1.2 Unlicensed Low Power Market Size and Forecast, 2012-2022 30
3.1.2.1 Revenue (US$ Mn) Comparison, By Region 30
3.1.2.2 Market Share Comparison, By Region 31
3.1.2.3 Y-o-Y growth Comparison, By Region 32
Chapter 4 Global Geofencing Market Analysis and Forecast By End-Use Industry 33
4.1 Global Geofencing Market Size and Forecast By End-Use Industry, 2012-2022 33
4.1.1 Transportation and logistics Market Size and Forecast, 2012-2022 33
4.1.1.1 Revenue (US$ Mn) Comparison, By Region 33
4.1.1.2 Market Share Comparison, By Region 34
4.1.1.3 Y-o-Y growth Comparison, By Region 35
4.1.2 Retail Market Size and Forecast, 2012-2022 36
4.1.2.1 Revenue (US$ Mn) Comparison, By Region 36
4.1.2.2 Market Share Comparison, By Region 37
4.1.2.3 Y-o-Y growth Comparison, By Region 38
4.1.3 Healthcare & Lifesciences Market Size and Forecast, 2012-2022 39
4.1.3.1 Revenue (US$ Mn) Comparison, By Region 39
4.1.3.2 Market Share Comparison, By Region 40
4.1.3.3 Y-o-Y growth Comparison, By Region 41
4.1.4 Aerospace & Defense Market Size and Forecast, 2012-2022 42
4.1.4.1 Revenue (US$ Mn) Comparison, By Region 42
4.1.4.2 Market Share Comparison, By Region 43
4.1.4.3 Y-o-Y growth Comparison, By Region 44
4.1.5 Others Market Size and Forecast, 2012-2022 45
4.1.5.1 Revenue (US$ Mn) Comparison, By Region 45
4.1.5.2 Market Share Comparison, By Region 46
4.1.5.3 Y-o-Y growth Comparison, By Region 47
Chapter 5 Global Geofencing Market Analysis and Forecast By Component Type 48
5.1 Global Geofencing Market Size and Forecast By Component Type, 2012-2022 48
5.1.1 Software Application Market Size and Forecast, 2012-2022 48
5.1.1.1 Revenue (US$ Mn) Comparison, By Region 48
5.1.1.2 Market Share Comparison, By Region 49
5.1.1.3 Y-o-Y growth Comparison, By Region 50
5.1.2 RFID Tag Market Size and Forecast, 2012-2022 51
5.1.2.1 Revenue (US$ Mn) Comparison, By Region 51
5.1.2.2 Market Share Comparison, By Region 52
5.1.2.3 Y-o-Y growth Comparison, By Region 53
5.1.3 Smart Sensors Market Size and Forecast, 2012-2022 54
5.1.3.1 Revenue (US$ Mn) Comparison, By Region 54
5.1.3.2 Market Share Comparison, By Region 55
5.1.3.3 Y-o-Y growth Comparison, By Region 56
Chapter 6 Global Geofencing Market Analysis and Forecast By Region 57
6.1 Global Geofencing Market Size and Forecast, 2012-2022 57
6.1.1 North America Geofencing Market Size and Forecast, 2012-2022 57
6.1.1.1 Revenue (US$ Mn) Comparison, By Network Type 57
6.1.1.2 Revenue (US$ Mn) Comparison, By End-Use Industry 58
6.1.1.3 Revenue (US$ Mn) Comparison, By Component Type 60
6.1.2 Latin America Geofencing Market Size and Forecast, 2012-2022 61
6.1.2.1 Revenue (US$ Mn) Comparison, By Network Type 61
6.1.2.2 Revenue (US$ Mn) Comparison, By End-Use Industry 63
6.1.2.3 Revenue (US$ Mn) Comparison, By Component Type 64
6.1.3 Europe Geofencing Market Size and Forecast, 2012-2022 66
6.1.3.1 Revenue (US$ Mn) Comparison, By Network Type 66
6.1.3.2 Revenue (US$ Mn) Comparison, By End-Use Industry 67
6.1.3.3 Revenue (US$ Mn) Comparison, By Component Type 69
6.1.4 Japan Geofencing Market Size and Forecast, 2012-2022 70
6.1.4.1 Revenue (US$ Mn) Comparison, By Network Type 70
6.1.4.2 Revenue (US$ Mn) Comparison, By End-Use Industry 72
6.1.4.3 Revenue (US$ Mn) Comparison, By Component Type 73
6.1.5 APEJ Geofencing Market Size and Forecast, 2012-2022 75
6.1.5.1 Revenue (US$ Mn) Comparison, By Network Type 75
6.1.5.2 Revenue (US$ Mn) Comparison, By End-Use Industry 76
6.1.5.3 Revenue (US$ Mn) Comparison, By Component Type 78
6.1.6 MEA Geofencing Market Size and Forecast, 2012-2022 79
6.1.6.1 Revenue (US$ Mn) Comparison, By Network Type 79
6.1.6.2 Revenue (US$ Mn) Comparison, By End-Use Industry 81
6.1.6.3 Revenue (US$ Mn) Comparison, By Component Type 82
Chapter 7 North America Geofencing Market Analysis and Forecast, By Country, 2012-2022 85
7.1 US Geofencing Market Size and Forecast, 2012-2022 85
7.1.1 Revenue (US$ Mn) Comparison, By Network Type 85
7.1.2 Revenue (US$ Mn) Comparison, By End-Use Industry 85
7.1.3 Revenue (US$ Mn) Comparison, By Component Type 86
7.2 Canada Geofencing Market Size and Forecast, 2012-2022 87
7.2.1 Revenue (US$ Mn) Comparison, By Network Type 87
7.2.2 Revenue (US$ Mn) Comparison, By End-Use Industry 88
7.2.3 Revenue (US$ Mn) Comparison, By Component Type 88
Chapter 8 Latin America Geofencing Market Analysis and Forecast, By Country, 2012-2022 90
8.1 Brazil Geofencing Market Size and Forecast, 2012-2022 90
8.1.1 Revenue (US$ Mn) Comparison, By Network Type 90
8.1.2 Revenue (US$ Mn) Comparison, By End-Use Industry 90
8.1.3 Revenue (US$ Mn) Comparison, By Component Type 91
8.2 Mexico Geofencing Market Size and Forecast, 2012-2022 92
8.2.1 Revenue (US$ Mn) Comparison, By Network Type 92
8.2.2 Revenue (US$ Mn) Comparison, By End-Use Industry 93
8.2.3 Revenue (US$ Mn) Comparison, By Component Type 93
8.3 Argentina Geofencing Market Size and Forecast, 2012-2022 94
8.3.1 Revenue (US$ Mn) Comparison, By Network Type 94
8.3.2 Revenue (US$ Mn) Comparison, By End-Use Industry 95
8.3.3 Revenue (US$ Mn) Comparison, By Component Type 96
Chapter 9 Europe Geofencing Market Analysis and Forecast, By Country, 2012-2022 97
9.1 Germany Geofencing Market Size and Forecast, 2012-2022 97
9.1.1 Revenue (US$ Mn) Comparison, By Network Type 97
9.1.2 Revenue (US$ Mn) Comparison, By End-Use Industry 97
9.1.3 Revenue (US$ Mn) Comparison, By Component Type 98
9.2 UK Geofencing Market Size and Forecast, 2012-2022 99
9.2.1 Revenue (US$ Mn) Comparison, By Network Type 99
9.2.2 Revenue (US$ Mn) Comparison, By End-Use Industry 100
9.2.3 Revenue (US$ Mn) Comparison, By Component Type 100
9.3 France Geofencing Market Size and Forecast, 2012-2022 101
9.3.1 Revenue (US$ Mn) Comparison, By Network Type 101
9.3.2 Revenue (US$ Mn) Comparison, By End-Use Industry 102
9.3.3 Revenue (US$ Mn) Comparison, By Component Type 103
9.4 Spain Geofencing Market Size and Forecast, 2012-2022 103
9.4.1 Revenue (US$ Mn) Comparison, By Network Type 103
9.4.2 Revenue (US$ Mn) Comparison, By End-Use Industry 104
9.4.3 Revenue (US$ Mn) Comparison, By Component Type 105
9.5 Italy Geofencing Market Size and Forecast, 2012-2022 106
9.5.1 Revenue (US$ Mn) Comparison, By Network Type 106
9.5.2 Revenue (US$ Mn) Comparison, By End-Use Industry 106
9.5.3 Revenue (US$ Mn) Comparison, By Component Type 107
9.6 Nordic Geofencing Market Size and Forecast, 2012-2022 108
9.6.1 Revenue (US$ Mn) Comparison, By Network Type 108
9.6.2 Revenue (US$ Mn) Comparison, By End-Use Industry 109
9.6.3 Revenue (US$ Mn) Comparison, By Component Type 109
Chapter 10 Japan Geofencing Market Analysis and Forecast, By Country, 2012-2022 111
10.1 Japan Geofencing Market Size and Forecast, 2012-2022 111
10.1.1 Revenue (US$ Mn) Comparison, By Network Type 111
10.1.2 Revenue (US$ Mn) Comparison, By End-Use Industry 111
10.1.3 Revenue (US$ Mn) Comparison, By Component Type 112
Chapter 11 APEJ Geofencing Market Analysis and Forecast, By Country, 2012-2022 114
11.1 China Geofencing Market Size and Forecast, 2012-2022 114
11.1.1 Revenue (US$ Mn) Comparison, By Network Type 114
11.1.2 Revenue (US$ Mn) Comparison, By End-Use Industry 114
11.1.3 Revenue (US$ Mn) Comparison, By Component Type 115
11.2 India Geofencing Market Size and Forecast, 2012-2022 116
11.2.1 Revenue (US$ Mn) Comparison, By Network Type 116
11.2.2 Revenue (US$ Mn) Comparison, By End-Use Industry 117
11.2.3 Revenue (US$ Mn) Comparison, By Component Type 117
11.3 Malaysia Geofencing Market Size and Forecast, 2012-2022 118
11.3.1 Revenue (US$ Mn) Comparison, By Network Type 118
11.3.2 Revenue (US$ Mn) Comparison, By End-Use Industry 119
11.3.3 Revenue (US$ Mn) Comparison, By Component Type 120
11.4 Thailand Geofencing Market Size and Forecast, 2012-2022 120
11.4.1 Revenue (US$ Mn) Comparison, By Network Type 120
11.4.2 Revenue (US$ Mn) Comparison, By End-Use Industry 121
11.4.3 Revenue (US$ Mn) Comparison, By Component Type 122
11.5 Singapore Geofencing Market Size and Forecast, 2012-2022 123
11.5.1 Revenue (US$ Mn) Comparison, By Network Type 123
11.5.2 Revenue (US$ Mn) Comparison, By End-Use Industry 123
11.5.3 Revenue (US$ Mn) Comparison, By Component Type 124
11.6 Australia Geofencing Market Size and Forecast, 2012-2022 125
11.6.1 Revenue (US$ Mn) Comparison, By Network Type 125
11.6.2 Revenue (US$ Mn) Comparison, By End-Use Industry 126
11.6.3 Revenue (US$ Mn) Comparison, By Component Type 126
Chapter 12 MEA Geofencing Market Analysis and Forecast, By Country, 2012-2022 128
12.1 GCC Countries Geofencing Market Size and Forecast, 2012-2022 128
12.1.1 Revenue (US$ Mn) Comparison, By Network Type 128
12.1.2 Revenue (US$ Mn) Comparison, By End-Use Industry 128
12.1.3 Revenue (US$ Mn) Comparison, By Component Type 129
12.2 South Africa Geofencing Market Size and Forecast, 2012-2022 130
12.2.1 Revenue (US$ Mn) Comparison, By Network Type 130
12.2.2 Revenue (US$ Mn) Comparison, By End-Use Industry 131
12.2.3 Revenue (US$ Mn) Comparison, By Component Type 131
12.3 Nigeria Geofencing Market Size and Forecast, 2012-2022 132
12.3.1 Revenue (US$ Mn) Comparison, By Network Type 132
12.3.2 Revenue (US$ Mn) Comparison, By End-Use Industry 133
12.3.3 Revenue (US$ Mn) Comparison, By Component Type 134
12.4 Israel Geofencing Market Size and Forecast, 2012-2022 134
12.4.1 Revenue (US$ Mn) Comparison, By Network Type 134
12.4.2 Revenue (US$ Mn) Comparison, By End-Use Industry 135
12.4.3 Revenue (US$ Mn) Comparison, By Component Type 136
Chapter 13 Global Geofencing Market : Competition Landscape and Company Profiles 137
13.1 Global Geofencing Market: Company Share Analysis 137
13.2 Global Geofencing Market: Compeitive Landscape 138
13.3 Global Geofencing Market: Company Profiles 141
13.3.1 GeoMoby 141
13.3.1.1 Company Overview 141
13.3.1.2 Product Overview 141
13.3.2 Mobinius Technologies Pvt.Ltd 142
13.3.2.1 Company Overview 142
13.3.2.2 Product Overview 142
13.3.3 Localytics 143
13.3.3.1 Company Overview 143
13.3.3.2 Product Overview 143
13.3.4 Bluedot Innovation 144
13.3.4.1 Company Overview 144
13.3.4.2 Product Overview 144
13.3.5 Apple Inc. 145
13.3.5.1 Company Overview 145
13.3.5.2 Product Overview 145
13.3.5.3 Key Financials 145
13.3.5.4 Key Developments 145
13.3.5.5 SWOT Analysis 146
13.3.6 Swirl Networks, Inc. 153
13.3.6.1 Company Overview 153
13.3.6.2 Product Overview 153
13.3.7 Simpli.Fi 154
13.3.7.1 Company Overview 154
13.3.7.2 Product Overview 154
13.3.8 Thumbvista 155
13.3.8.1 Company Overview 155
13.3.8.2 Product Overview 155
13.3.9 Mapcite 156
13.3.9.1 Company Overview 156
13.3.9.2 Product Overview 156
Chapter 14 TMR Research Methodology 157
14.1 To Begin With 157
14.2 How we Develop Base Year Data 157
14.3 Overall Approach Explained Visually 158
14.4 To be Noted 158
14.5 Average Pricing Methodology 159
14.6 Forecasting Methodology 160
14.7 For Profiling Competitors in the Market: 161
Chapter 15 Disclaimer and Contact information 162
List of Tables
TABLE 1 Global Geofencing Market Value (US$ Mn), 2012-2016 21
TABLE 2 Global Geofencing Market Value (US$ Mn), 2017-2022 22
TABLE 3 Global Geofencing Market Value (US$ Mn) and Y-o-Y, 2015-2022 23
TABLE 4 Global Cellular Segment Value (US$ Mn), By Region 2012-2016 26
TABLE 5 Global Cellular Segment Value (US$ Mn), By Region 2017-2022 26
TABLE 6 Global Cellular Segment Market Share, By Region 2012-2016 27
TABLE 7 Global Cellular Segment Market Share, By Region 2017-2022 28
TABLE 8 Global Cellular Segment Y-o-Y, By Region 2015-2022 28
TABLE 9 Global Unlicensed Low Power Technology Segment Value (US$ Mn), By Region 2012-2016 29
TABLE 10 Global Unlicensed Low Power Technology Segment Value (US$ Mn), By Region 2017-2022 29
TABLE 11 Global Unlicensed Low Power Technology Segment Market Share, By Region 2012-2016 30
TABLE 12 Global Unlicensed Low Power Technology Segment Market Share, By Region 2017-2022 31
TABLE 13 Global Unlicensed Low Power Technology Segment Y-o-Y, By Region 2015-2022 31
TABLE 14 Global Transportation and logistics Segment Value (US$ Mn), By Region 2012-2016 32
TABLE 15 Global Transportation and logistics Segment Value (US$ Mn), By Region 2017-2022 32
TABLE 16 Global Transportation and logistics Segment Market Share, By Region 2012-2016 33
TABLE 17 Global Transportation and logistics Segment Market Share, By Region 2017-2022 34
TABLE 18 Global Transportation and logistics Segment Y-o-Y, By Region 2015-2022 34
TABLE 19 Global Retail Segment Value (US$ Mn), By Region 2012-2016 35
TABLE 20 Global Retail Segment Value (US$ Mn), By Region 2017-2022 35
TABLE 21 Global Retail Segment Market Share, By Region 2012-2016 36
TABLE 22 Global Retail Segment Market Share, By Region 2017-2022 37
TABLE 23 Global Retail Segment Y-o-Y, By Region 2015-2022 37
TABLE 24 Global Healthcare & Lifesciences Segment Value (US$ Mn), By Region 2012-2016 38
TABLE 25 Global Healthcare & Lifesciences Segment Value (US$ Mn), By Region 2017-2022 38
TABLE 26 Global Healthcare & Lifesciences Segment Market Share, By Region 2012-2016 39
TABLE 27 Global Healthcare & Lifesciences Segment Market Share, By Region 2017-2022 40
TABLE 28 Global Healthcare & Lifesciences Segment Y-o-Y, By Region 2015-2022 40
TABLE 29 Global Aerospace & Defense Segment Value (US$ Mn), By Region 2012-2016 41
TABLE 30 Global Aerospace & Defense Segment Value (US$ Mn), By Region 2017-2022 41
TABLE 31 Global Aerospace & Defense Segment Market Share, By Region 2012-2016 42
TABLE 32 Global Aerospace & Defense Segment Market Share, By Region 2017-2022 43
TABLE 33 Global Aerospace & Defense Segment Y-o-Y, By Region 2015-2022 43
TABLE 34 Global Others Segment Value (US$ Mn), By Region 2012-2016 44
TABLE 35 Global Others Segment Value (US$ Mn), By Region 2017-2022 44
TABLE 36 Global Others Segment Market Share, By Region 2012-2016 45
TABLE 37 Global Others Segment Market Share, By Region 2017-2022 46
TABLE 38 Global Others Segment Y-o-Y, By Region 2015-2022 46
TABLE 39 Global Software Application Segment Value (US$ Mn), By Region 2012-2016 47
TABLE 40 Global Software Application Segment Value (US$ Mn), By Region 2017-2022 47
TABLE 41 Global Software Application Segment Market Share, By Region 2012-2016 48
TABLE 42 Global Software Application Segment Market Share, By Region 2017-2022 49
TABLE 43 Global Software Application Segment Y-o-Y, By Region 2015-2022 49
TABLE 44 Global RFID Tag Segment Value (US$ Mn), By Region 2012-2016 50
TABLE 45 Global RFID Tag Segment Value (US$ Mn), By Region 2017-2022 50
TABLE 46 Global RFID Tag Segment Market Share, By Region 2012-2016 51
TABLE 47 Global RFID Tag Segment Market Share, By Region 2017-2022 52
TABLE 48 Global RFID Tag Segment Y-o-Y, By Region 2015-2022 52
TABLE 49 Global Smart Sensors Segment Value (US$ Mn), By Region 2012-2016 53
TABLE 50 Global Smart Sensors Segment Value (US$ Mn), By Region 2017-2022 53
TABLE 51 Global Smart Sensors Segment Market Share, By Region 2012-2016 54
TABLE 52 Global Smart Sensors Segment Market Share, By Region 2017-2022 55
TABLE 53 Global Smart Sensors Segment Y-o-Y, By Region 2015-2022 55
TABLE 54 North America Geofencing Market Value (US$ Mn), By Network Type 2012-2016 56
TABLE 55 North America Geofencing Market Value (US$ Mn), By Network Type 2017-2022 56
TABLE 56 North America Geofencing Market Value (US$ Mn), By End-Use Industry 2012-2016 57
TABLE 57 North America Geofencing Market Value (US$ Mn), By End-Use Industry 2017-2022 58
TABLE 58 North America Geofencing Market Value (US$ Mn), By Component Type 2012-2016 59
TABLE 59 North America Geofencing Market Value (US$ Mn), By Component Type 2017-2022 59
TABLE 60 Latin America Geofencing Market Value (US$ Mn), By Network Type 2012-2016 60
TABLE 61 Latin America Geofencing Market Value (US$ Mn), By Network Type 2017-2022 61
TABLE 62 Latin America Geofencing Market Value (US$ Mn), By End-Use Industry 2012-2016 62
TABLE 63 Latin America Geofencing Market Value (US$ Mn), By End-Use Industry 2017-2022 62
TABLE 64 Latin America Geofencing Market Value (US$ Mn), By Component Type 2012-2016 63
TABLE 65 Latin America Geofencing Market Value (US$ Mn), By Component Type 2017-2022 64
TABLE 66 Europe Geofencing Market Value (US$ Mn), By Network Type 2012-2016 65
TABLE 67 Europe Geofencing Market Value (US$ Mn), By Network Type 2017-2022 65
TABLE 68 Europe Geofencing Market Value (US$ Mn), By End-Use Industry 2012-2016 66
TABLE 69 Europe Geofencing Market Value (US$ Mn), By End-Use Industry 2017-2022 67
TABLE 70 Europe Geofencing Market Value (US$ Mn), By Component Type 2012-2016 68
TABLE 71 Europe Geofencing Market Value (US$ Mn), By Component Type 2017-2022 68
TABLE 72 Japan Geofencing Market Value (US$ Mn), By Network Type 2012-2016 69
TABLE 73 Japan Geofencing Market Value (US$ Mn), By Network Type 2017-2022 70
TABLE 74 Japan Geofencing Market Value (US$ Mn), By End-Use Industry 2012-2016 71
TABLE 75 Japan Geofencing Market Value (US$ Mn), By End-Use Industry 2017-2022 71
TABLE 76 Japan Geofencing Market Value (US$ Mn), By Component Type 2012-2016 72
TABLE 77 Japan Geofencing Market Value (US$ Mn), By Component Type 2017-2022 73
TABLE 78 APEJ Geofencing Market Value (US$ Mn), By Network Type 2012-2016 74
TABLE 79 APEJ Geofencing Market Value (US$ Mn), By Network Type 2017-2022 74
TABLE 80 APEJ Geofencing Market Value (US$ Mn), By End-Use Industry 2012-2016 75
TABLE 81 APEJ Geofencing Market Value (US$ Mn), By End-Use Industry 2017-2022 76
TABLE 82 APEJ Geofencing Market Value (US$ Mn), By Component Type 2012-2016 77
TABLE 83 APEJ Geofencing Market Value (US$ Mn), By Component Type 2017-2022 77
TABLE 84 MEA Geofencing Market Value (US$ Mn), By Network Type 2012-2016 78
TABLE 85 MEA Geofencing Market Value (US$ Mn), By Network Type 2017-2022 79
TABLE 86 MEA Geofencing Market Value (US$ Mn), By End-Use Industry 2012-2016 80
TABLE 87 MEA Geofencing Market Value (US$ Mn), By End-Use Industry 2017-2022 80
TABLE 88 MEA Geofencing Market Value (US$ Mn), By Component Type 2012-2016 81
TABLE 89 MEA Geofencing Market Value (US$ Mn), By Component Type 2017-2022 82
TABLE 90 US Geofencing Market Value (US$ Mn), By Network Type 2012-2016 84
TABLE 91 US Geofencing Market Value (US$ Mn), By Network Type 2017-2022 84
TABLE 92 US Geofencing Market Value (US$ Mn), By End-Use Industry 2012-2016 84
TABLE 93 US Geofencing Market Value (US$ Mn), By End-Use Industry 2017-2022 85
TABLE 94 US Geofencing Market Value (US$ Mn), By Component Type 2012-2016 85
TABLE 95 US Geofencing Market Value (US$ Mn), By Component Type 2017-2022 85
TABLE 96 Canada Geofencing Market Value (US$ Mn), By Network Type 2012-2016 86
TABLE 97 Canada Geofencing Market Value (US$ Mn), By Network Type 2017-2022 86
TABLE 98 Canada Geofencing Market Value (US$ Mn), By End-Use Industry 2012-2016 87
TABLE 99 Canada Geofencing Market Value (US$ Mn), By End-Use Industry 2017-2022 87
TABLE 100 Canada Geofencing Market Value (US$ Mn), By Component Type 2012-2016 87
TABLE 101 Canada Geofencing Market Value (US$ Mn), By Component Type 2017-2022 88
TABLE 102 Brazil Geofencing Market Value (US$ Mn), By Network Type 2012-2016 89
TABLE 103 Brazil Geofencing Market Value (US$ Mn), By Network Type 2017-2022 89
TABLE 104 Brazil Geofencing Market Value (US$ Mn), By End-Use Industry 2012-2016 89
TABLE 105 Brazil Geofencing Market Value (US$ Mn), By End-Use Industry 2017-2022 90
TABLE 106 Brazil Geofencing Market Value (US$ Mn), By Component Type 2012-2016 90
TABLE 107 Brazil Geofencing Market Value (US$ Mn), By Component Type 2017-2022 90
TABLE 108 Mexico Geofencing Market Value (US$ Mn), By Network Type 2012-2016 91
TABLE 109 Mexico Geofencing Market Value (US$ Mn), By Network Type 2017-2022 91
TABLE 110 Mexico Geofencing Market Value (US$ Mn), By End-Use Industry 2012-2016 92
TABLE 111 Mexico Geofencing Market Value (US$ Mn), By End-Use Industry 2017-2022 92
TABLE 112 Mexico Geofencing Market Value (US$ Mn), By Component Type 2012-2016 92
TABLE 113 Mexico Geofencing Market Value (US$ Mn), By Component Type 2017-2022 93
TABLE 114 Argentina Geofencing Market Value (US$ Mn), By Network Type 2012-2016 93
TABLE 115 Argentina Geofencing Market Value (US$ Mn), By Network Type 2017-2022 93
TABLE 116 Argentina Geofencing Market Value (US$ Mn), By End-Use Industry 2012-2016 94
TABLE 117 Argentina Geofencing Market Value (US$ Mn), By End-Use Industry 2017-2022 94
TABLE 118 Argentina Geofencing Market Value (US$ Mn), By Component Type 2012-2016 95
TABLE 119 Argentina Geofencing Market Value (US$ Mn), By Component Type 2017-2022 95
TABLE 120 Germany Geofencing Market Value (US$ Mn), By Network Type 2012-2016 96
TABLE 121 Germany Geofencing Market Value (US$ Mn), By Network Type 2017-2022 96
TABLE 122 Germany Geofencing Market Value (US$ Mn), By End-Use Industry 2012-2016 96
TABLE 123 Germany Geofencing Market Value (US$ Mn), By End-Use Industry 2017-2022 97
TABLE 124 Germany Geofencing Market Value (US$ Mn), By Component Type 2012-2016 97
TABLE 125 Germany Geofencing Market Value (US$ Mn), By Component Type 2017-2022 97
TABLE 126 UK Geofencing Market Value (US$ Mn), By Network Type 2012-2016 98
TABLE 127 UK Geofencing Market Value (US$ Mn), By Network Type 2017-2022 98
TABLE 128 UK Geofencing Market Value (US$ Mn), By End-Use Industry 2012-2016 99
TABLE 129 UK Geofencing Market Value (US$ Mn), By End-Use Industry 2017-2022 99
TABLE 130 UK Geofencing Market Value (US$ Mn), By Component Type 2012-2016 99
TABLE 131 UK Geofencing Market Value (US$ Mn), By Component Type 2017-2022 100
TABLE 132 France Geofencing Market Value (US$ Mn), By Network Type 2012-2016 100
TABLE 133 France Geofencing Market Value (US$ Mn), By Network Type 2017-2022 100
TABLE 134 France Geofencing Market Value (US$ Mn), By End-Use Industry 2012-2016 101
TABLE 135 France Geofencing Market Value (US$ Mn), By End-Use Industry 2017-2022 101
TABLE 136 France Geofencing Market Value (US$ Mn), By Component Type 2012-2016 102
TABLE 137 France Geofencing Market Value (US$ Mn), By Component Type 2017-2022 102
TABLE 138 Spain Geofencing Market Value (US$ Mn), By Network Type 2012-2016 102
TABLE 139 Spain Geofencing Market Value (US$ Mn), By Network Type 2017-2022 103
TABLE 140 Spain Geofencing Market Value (US$ Mn), By End-Use Industry 2012-2016 103
TABLE 141 Spain Geofencing Market Value (US$ Mn), By End-Use Industry 2017-2022 103
TABLE 142 Spain Geofencing Market Value (US$ Mn), By Component Type 2012-2016 104
TABLE 143 Spain Geofencing Market Value (US$ Mn), By Component Type 2017-2022 104
TABLE 144 Italy Geofencing Market Value (US$ Mn), By Network Type 2012-2016 105
TABLE 145 Italy Geofencing Market Value (US$ Mn), By Network Type 2017-2022 105
TABLE 146 Italy Geofencing Market Value (US$ Mn), By End-Use Industry 2012-2016 105
TABLE 147 Italy Geofencing Market Value (US$ Mn), By End-Use Industry 2017-2022 106
TABLE 148 Italy Geofencing Market Value (US$ Mn), By Component Type 2012-2016 106
TABLE 149 Italy Geofencing Market Value (US$ Mn), By Component Type 2017-2022 106
TABLE 150 Nordic Geofencing Market Value (US$ Mn), By Network Type 2012-2016 107
TABLE 151 Nordic Geofencing Market Value (US$ Mn), By Network Type 2017-2022 107
TABLE 152 Nordic Geofencing Market Value (US$ Mn), By End-Use Industry 2012-2016 108
TABLE 153 Nordic Geofencing Market Value (US$ Mn), By End-Use Industry 2017-2022 108
TABLE 154 Nordic Geofencing Market Value (US$ Mn), By Component Type 2012-2016 108
TABLE 155 Nordic Geofencing Market Value (US$ Mn), By Component Type 2017-2022 109
TABLE 156 Japan Geofencing Market Value (US$ Mn), By Network Type 2012-2016 110
TABLE 157 Japan Geofencing Market Value (US$ Mn), By Network Type 2017-2022 110
TABLE 158 Japan Geofencing Market Value (US$ Mn), By End-Use Industry 2012-2016 110
TABLE 159 Japan Geofencing Market Value (US$ Mn), By End-Use Industry 2017-2022 111
TABLE 160 Japan Geofencing Market Value (US$ Mn), By Component Type 2012-2016 111
TABLE 161 Japan Geofencing Market Value (US$ Mn), By Component Type 2017-2022 111
TABLE 162 China Geofencing Market Value (US$ Mn), By Network Type 2012-2016 113
TABLE 163 China Geofencing Market Value (US$ Mn), By Network Type 2017-2022 113
TABLE 164 China Geofencing Market Value (US$ Mn), By End-Use Industry 2012-2016 113
TABLE 165 China Geofencing Market Value (US$ Mn), By End-Use Industry 2017-2022 114
TABLE 166 China Geofencing Market Value (US$ Mn), By Component Type 2012-2016 114
TABLE 167 China Geofencing Market Value (US$ Mn), By Component Type 2017-2022 114
TABLE 168 India Geofencing Market Value (US$ Mn), By Network Type 2012-2016 115
TABLE 169 India Geofencing Market Value (US$ Mn), By Network Type 2017-2022 115
TABLE 170 India Geofencing Market Value (US$ Mn), By End-Use Industry 2012-2016 116
TABLE 171 India Geofencing Market Value (US$ Mn), By End-Use Industry 2017-2022 116
TABLE 172 India Geofencing Market Value (US$ Mn), By Component Type 2012-2016 116
TABLE 173 India Geofencing Market Value (US$ Mn), By Component Type 2017-2022 117
TABLE 174 Malaysia Geofencing Market Value (US$ Mn), By Network Type 2012-2016 117
TABLE 175 Malaysia Geofencing Market Value (US$ Mn), By Network Type 2017-2022 117
TABLE 176 Malaysia Geofencing Market Value (US$ Mn), By End-Use Industry 2012-2016 118
TABLE 177 Malaysia Geofencing Market Value (US$ Mn), By End-Use Industry 2017-2022 118
TABLE 178 Malaysia Geofencing Market Value (US$ Mn), By Component Type 2012-2016 119
TABLE 179 Malaysia Geofencing Market Value (US$ Mn), By Component Type 2017-2022 119
TABLE 180 Thailand Geofencing Market Value (US$ Mn), By Network Type 2012-2016 119
TABLE 181 Thailand Geofencing Market Value (US$ Mn), By Network Type 2017-2022 120
TABLE 182 Thailand Geofencing Market Value (US$ Mn), By End-Use Industry 2012-2016 120
TABLE 183 Thailand Geofencing Market Value (US$ Mn), By End-Use Industry 2017-2022 120
TABLE 184 Thailand Geofencing Market Value (US$ Mn), By Component Type 2012-2016 121
TABLE 185 Thailand Geofencing Market Value (US$ Mn), By Component Type 2017-2022 121
TABLE 186 Singapore Geofencing Market Value (US$ Mn), By Network Type 2012-2016 122
TABLE 187 Singapore Geofencing Market Value (US$ Mn), By Network Type 2017-2022 122
TABLE 188 Singapore Geofencing Market Value (US$ Mn), By End-Use Industry 2012-2016 122
TABLE 189 Singapore Geofencing Market Value (US$ Mn), By End-Use Industry 2017-2022 123
TABLE 190 Singapore Geofencing Market Value (US$ Mn), By Component Type 2012-2016 123
TABLE 191 Singapore Geofencing Market Value (US$ Mn), By Component Type 2017-2022 123
TABLE 192 Australia Geofencing Market Value (US$ Mn), By Network Type 2012-2016 124
TABLE 193 Australia Geofencing Market Value (US$ Mn), By Network Type 2017-2022 124
TABLE 194 Australia Geofencing Market Value (US$ Mn), By End-Use Industry 2012-2016 125
TABLE 195 Australia Geofencing Market Value (US$ Mn), By End-Use Industry 2017-2022 125
TABLE 196 Australia Geofencing Market Value (US$ Mn), By Component Type 2012-2016 125
TABLE 197 Australia Geofencing Market Value (US$ Mn), By Component Type 2017-2022 126
TABLE 198 GCC Countries Geofencing Market Value (US$ Mn), By Network Type 2012-2016 127
TABLE 199 GCC Countries Geofencing Market Value (US$ Mn), By Network Type 2017-2022 127
TABLE 200 GCC Countries Geofencing Market Value (US$ Mn), By End-Use Industry 2012-2016 127
TABLE 201 GCC Countries Geofencing Market Value (US$ Mn), By End-Use Industry 2017-2022 128
TABLE 202 GCC Countries Geofencing Market Value (US$ Mn), By Component Type 2012-2016 128
TABLE 203 GCC Countries Geofencing Market Value (US$ Mn), By Component Type 2017-2022 128
TABLE 204 South Africa Geofencing Market Value (US$ Mn), By Network Type 2012-2016 129
TABLE 205 South Africa Geofencing Market Value (US$ Mn), By Network Type 2017-2022 129
TABLE 206 South Africa Geofencing Market Value (US$ Mn), By End-Use Industry 2012-2016 130
TABLE 207 South Africa Geofencing Market Value (US$ Mn), By End-Use Industry 2017-2022 130
TABLE 208 South Africa Geofencing Market Value (US$ Mn), By Component Type 2012-2016 130
TABLE 209 South Africa Geofencing Market Value (US$ Mn), By Component Type 2017-2022 131
TABLE 210 Nigeria Geofencing Market Value (US$ Mn), By Network Type 2012-2016 131
TABLE 211 Nigeria Geofencing Market Value (US$ Mn), By Network Type 2017-2022 131
TABLE 212 Nigeria Geofencing Market Value (US$ Mn), By End-Use Industry 2012-2016 132
TABLE 213 Nigeria Geofencing Market Value (US$ Mn), By End-Use Industry 2017-2022 132
TABLE 214 Nigeria Geofencing Market Value (US$ Mn), By Component Type 2012-2016 133
TABLE 215 Nigeria Geofencing Market Value (US$ Mn), By Component Type 2017-2022 133
TABLE 216 Israel Geofencing Market Value (US$ Mn), By Network Type 2012-2016 133
TABLE 217 Israel Geofencing Market Value (US$ Mn), By Network Type 2017-2022 134
TABLE 218 Israel Geofencing Market Value (US$ Mn), By End-Use Industry 2012-2016 134
TABLE 219 Israel Geofencing Market Value (US$ Mn), By End-Use Industry 2017-2022 134
TABLE 220 Israel Geofencing Market Value (US$ Mn), By Component Type 2012-2016 135
TABLE 221 Israel Geofencing Market Value (US$ Mn), By Component Type 2017-2022 135
List of Figures
FIG. 1 Global Geofencing Market Value (US$ Mn), 2012-2016 10
FIG. 2 Global Geofencing Market Value (US$ Mn) Forecast, 2017-2022 10
FIG. 3 Global Geofencing Market Value (US$ Mn) and Y-o-Y, 2015-2022 11
FIG. 4 Global Cellular Segment Market Value (US$ Mn) By Region, 2012-2016 14
FIG. 5 Global Cellular Segment Market Value (US$ Mn) By Region, 2017-2022 15
FIG. 6 Global Cellular Segment Y-o-Y Growth Rate, By Region, 2015-2022 16
FIG. 7 Global Unlicensed Low Power Technology Segment Market Value (US$ Mn) By Region, 2012-2016 17
FIG. 8 Global Unlicensed Low Power Technology Segment Market Value (US$ Mn) By Region, 2017-2022 18
FIG. 9 Global Unlicensed Low Power Technology Segment Y-o-Y Growth Rate, By Region, 2015-2022 19
FIG. 10 Global Transportation and logistics Segment Market Value (US$ Mn) By Region, 2012-2016 20
FIG. 11 Global Transportation and logistics Segment Market Value (US$ Mn) By Region, 2017-2022 21
FIG. 12 Global Transportation and logistics Segment Y-o-Y Growth Rate, By Region, 2015-2022 22
FIG. 13 Global Retail Segment Market Value (US$ Mn) By Region, 2012-2016 23
FIG. 14 Global Retail Segment Market Value (US$ Mn) By Region, 2017-2022 24
FIG. 15 Global Retail Segment Y-o-Y Growth Rate, By Region, 2015-2022 25
FIG. 16 Global Healthcare & Lifesciences Segment Market Value (US$ Mn) By Region, 2012-2016 26
FIG. 17 Global Healthcare & Lifesciences Segment Market Value (US$ Mn) By Region, 2017-2022 27
FIG. 18 Global Healthcare & Lifesciences Segment Y-o-Y Growth Rate, By Region, 2015-2022 28
FIG. 19 Global Aerospace & Defense Segment Market Value (US$ Mn) By Region, 2012-2016 29
FIG. 20 Global Aerospace & Defense Segment Market Value (US$ Mn) By Region, 2017-2022 30
FIG. 21 Global Aerospace & Defense Segment Y-o-Y Growth Rate, By Region, 2015-2022 31
FIG. 22 Global Others Segment Market Value (US$ Mn) By Region, 2012-2016 32
FIG. 23 Global Others Segment Market Value (US$ Mn) By Region, 2017-2022 33
FIG. 24 Global Others Segment Y-o-Y Growth Rate, By Region, 2015-2022 34
FIG. 25 Global Software Application Segment Market Value (US$ Mn) By Region, 2012-2016 35
FIG. 26 Global Software Application Segment Market Value (US$ Mn) By Region, 2017-2022 36
FIG. 27 Global Software Application Segment Y-o-Y Growth Rate, By Region, 2015-2022 37
FIG. 28 Global RFID Tag Segment Market Value (US$ Mn) By Region, 2012-2016 38
FIG. 29 Global RFID Tag Segment Market Value (US$ Mn) By Region, 2017-2022 39
FIG. 30 Global RFID Tag Segment Y-o-Y Growth Rate, By Region, 2015-2022 40
FIG. 31 Global Smart Sensors Segment Market Value (US$ Mn) By Region, 2012-2016 41
FIG. 32 Global Smart Sensors Segment Market Value (US$ Mn) By Region, 2017-2022 42
FIG. 33 Global Smart Sensors Segment Y-o-Y Growth Rate, By Region, 2015-2022 43
FIG. 34 North America Geofencing Market Value (US$ Mn), By Network Type 2012-2016 44
FIG. 35 North America Geofencing Market Value (US$ Mn), By Network Type 2017-2022 45
FIG. 36 North America Geofencing Market Value (US$ Mn), By End-Use Industry 2012-2016 46
FIG. 37 North America Geofencing Market Value (US$ Mn), By End-Use Industry 2017-2022 46
FIG. 38 North America Geofencing Market Value (US$ Mn), By Component Type 2012-2016 47
FIG. 39 North America Geofencing Market Value (US$ Mn), By Component Type 2017-2022 48
FIG. 40 Latin America Geofencing Market Value (US$ Mn), By Network Type 2012-2016 49
FIG. 41 Latin America Geofencing Market Value (US$ Mn), By Network Type 2017-2022 49
FIG. 42 Latin America Geofencing Market Value (US$ Mn), By End-Use Industry 2012-2016 50
FIG. 43 Latin America Geofencing Market Value (US$ Mn), By End-Use Industry 2017-2022 51
FIG. 44 Latin America Geofencing Market Value (US$ Mn), By Component Type 2012-2016 52
FIG. 45 Latin America Geofencing Market Value (US$ Mn), By Component Type 2017-2022 52
FIG. 46 Europe Geofencing Market Value (US$ Mn), By Network Type 2012-2016 53
FIG. 47 Europe Geofencing Market Value (US$ Mn), By Network Type 2017-2022 54
FIG. 48 Europe Geofencing Market Value (US$ Mn), By End-Use Industry 2012-2016 55
FIG. 49 Europe Geofencing Market Value (US$ Mn), By End-Use Industry 2017-2022 55
FIG. 50 Europe Geofencing Market Value (US$ Mn), By Component Type 2012-2016 56
FIG. 51 Europe Geofencing Market Value (US$ Mn), By Component Type 2017-2022 57
FIG. 52 Japan Geofencing Market Value (US$ Mn), By Network Type 2012-2016 58
FIG. 53 Japan Geofencing Market Value (US$ Mn), By Network Type 2017-2022 58
FIG. 54 Japan Geofencing Market Value (US$ Mn), By End-Use Industry 2012-2016 59
FIG. 55 Japan Geofencing Market Value (US$ Mn), By End-Use Industry 2017-2022 60
FIG. 56 Japan Geofencing Market Value (US$ Mn), By Component Type 2012-2016 61
FIG. 57 Japan Geofencing Market Value (US$ Mn), By Component Type 2017-2022 61
FIG. 58 APEJ Geofencing Market Value (US$ Mn), By Network Type 2012-2016 62
FIG. 59 APEJ Geofencing Market Value (US$ Mn), By Network Type 2017-2022 63
FIG. 60 APEJ Geofencing Market Value (US$ Mn), By End-Use Industry 2012-2016 64
FIG. 61 APEJ Geofencing Market Value (US$ Mn), By End-Use Industry 2017-2022 64
FIG. 62 APEJ Geofencing Market Value (US$ Mn), By Component Type 2012-2016 65
FIG. 63 APEJ Geofencing Market Value (US$ Mn), By Component Type 2017-2022 66
FIG. 64 MEA Geofencing Market Value (US$ Mn), By Network Type 2012-2016 67
FIG. 65 MEA Geofencing Market Value (US$ Mn), By Network Type 2017-2022 67
FIG. 66 MEA Geofencing Market Value (US$ Mn), By End-Use Industry 2012-2016 68
FIG. 67 MEA Geofencing Market Value (US$ Mn), By End-Use Industry 2017-2022 69
FIG. 68 MEA Geofencing Market Value (US$ Mn), By Component Type 2012-2016 70
FIG. 69 MEA Geofencing Market Value (US$ Mn), By Component Type 2017-2022 70
Copyright © Transparency Market Research, Inc. All Rights reserved
Trust Online


Geofencing Market Outlook, Trends, Analysis