Cloud Based Simulation Application Market

Cloud Based Simulation Application Market (Solution - Software as a Service (SaaS), Platform as a Service (PaaS), and Infrastructure as a Service (IaaS); Application - Training, Process Improvement, Predicting Outcomes, and Managing Risk; Industry - Manufacturing, Media & Entertainment, Construction, Automotive, Transportation & Logistics, Healthcare, Defense and Aerospace, and Energy & Power) - Global Industry Analysis, Size, Share, Growth, Trends and Forecast 2017 - 2025

Global Cloud Based Simulation Application Market: Snapshot

The global cloud based simulation application market is gaining on the back of increasing use of simulation software applications across a host of industry verticals. Simulation software applications are equipped with inbuilt capabilities to measure, simulate, restructure, and manage risks. This makes cloud based simulation application suitable to provide training, for efficient use of available resources, and to anticipate process outcomes by enhancing process efficiency.

Furthermore, demand for industrial automation and investments from companies in simulation technology and its application with the objective of sustainable development are also anticipated to fuel growth of cloud based simulation application market.

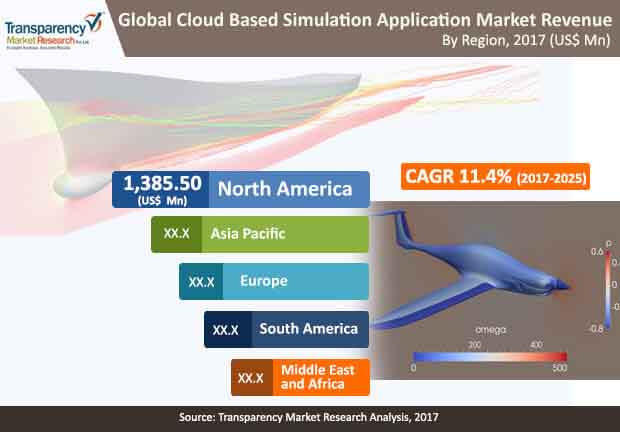
A report by Transparency Market Research (TMR) estimates the global cloud based simulation application market to clock a healthy 11.4% CAGR during the forecast period between 2017 and 2025, for the market to become worth US$8,451.5 mn by the end of 2025 increasing from US$3,259.8 mn in 2016. 

Global Cloud Based Simulation Application Market

Software as a Service Segment to Continue to Dominate

The report studies the global cloud based simulation application market on the basis of solution, application, industry, and geography. On the basis of solution, the market is classified into software as a service (SaaS), platform as a service (PaaS), and infrastructure as a service (LaaS). Of them, in 2016, software as a service held more than 50% revenue share of the overall market. In absolute terms, revenue contribution of SaaS segment was US$2,259.5 mn in 2016. Expanding at a CAGR of 11.8% during 2017 and 2025, SaaS segment is anticipated to hold the leading share by the end of 2025. The growth of this segment is mainly because of rising demand for technology-based solutions, and due to the demand for cloud based simulation applications from the manufacturing sector.

In terms of application, the key segments of the cloud based simulation application market include training, process improvement, predicting outcomes, and managing risk. Amongst all, in 2016, process improvement segment held more than 30% market share. The process improvement segment is anticipated to rise at a CAGR of 10.5% during the 2017-2025 forecast period. However, predicting outcomes application segment is anticipated to rise at the leading 12.7% CAGR during the forecast period. The growth of predicting outcomes segment is mainly because it helps to provide investment plan for new product development.

Healthcare to Emerge Attractive in Coming Years 

Based on industry, the key segments include manufacturing, media and entertainment, construction, automotive, transportation and logistics, healthcare, defense and aerospace, energy and power, and other. Of them, automotive industry held the leading share of more than 25% of the overall market in 2016. This was followed by defense and aerospace that held more than 18% market share in the same year. However, healthcare is anticipated to display the leading growth rate over the forecast period.

Geographically, the cloud based simulation application market has been bifurcated into North America, Europe, Asia Pacific, the Middle East and Africa, and South America. North America stood as the leading regional market for cloud based simulation application in 2016; the growth of this market is mainly because of the presence of well established companies that are striving to increase their market share globally. The growth in North America is mainly driven by the U.S. due to the presence of well-resourced cloud contributors that either operate independently or via joint collaborations with local players.

Globally, prominent players in the cloud based simulation application market include ANSYS Inc., Autodesk Inc., Dassault Systemes, Exa Corporation, Fieldscale, MSC Software, Rescale Inc., Siemens PLM Software, SimCore Technologies, SOASTA Inc., and SimScale.

Cloud Based Simulation Application Market

By Solution

  • Software as a Service (SaaS)
  • Platform as a Service (PaaS)
  • Infrastructure as a Service (IaaS)

By Application 

  • Training
  • Process Improvement
  • Predicting Outcomes
  • Managing Risk

By Industry

  • Manufacturing
  • Media & Entertainment
  • Construction
  • Automotive
  • Transportation & Logistics
  • Healthcare
  • Defense and Aerospace
  • Energy & Power
  • Others

By Geography

  • North America
    • U.S.
    • Canada
    • Rest of North America
  • Europe
    • The U.K.
    • Germany
    • France
    • Rest of Europe
  • Asia Pacific
    • China
    • Japan
    • India
    • South Korea
    • Rest of Asia Pacific
  • Middle East and Africa (MEA)
    • GCC Countries
    • South Africa
    • Rest of MEA
  • South America
    • Brazil
    • Argentina
    • Rest of South America
    1. Preface
         1.1. Market Definition and Scope
         1.2. Market Segmentation
         1.3. Key Research Objectives
         1.4. Research Highlights

    2. Assumptions and Research Methodology
     
    3. Executive Summary : Global Cloud-based/Web-based Simulation Application Market
     
    4. Market Overview
         4.1. Introduction
                4.1.1. Cloud-based Simulation Application Evolution / Developments
         4.2. Key Market Indicators
         4.3. Market Dynamics
                4.3.1. Drivers
                4.3.2. Restraints
                4.3.3. Opportunity
         4.4. Global Cloud-based Simulation Application Market Analysis and Forecasts, 2015 – 2025
                4.4.1. Market Revenue Projections (US$ Mn)
         4.5. Ecosystem Analysis
                4.5.1. List of Active Market Participants (suppliers/distributors/manufacturers/vendors)
         4.6. Market Outlook
     
    5. Global Cloud-based Simulation Application Market Analysis and Forecasts, By Application
         5.1. Introduction & Definition
         5.2. Market Size (US$ Mn) Forecast By Application
                5.2.1. Training
                5.2.2. Process Improvement
                5.2.3. Predicting Outcomes
                5.2.4. Managing Risk
         5.3. Application Comparison Matrix
         5.4. Market Attractiveness By Application
     
    6. Global Cloud-based Simulation Application Market Analysis and Forecasts, By Solution 
         6.1. Introduction & Definition
         6.2. Market Size (US$ Mn) Forecast By Solution
                6.2.1. Software as a Service (SaaS)
                6.2.2. Platform as a Service (PaaS)
    6.2.3. Infrastructure as a Service (IaaS)
         6.3. Solution Comparison Matrix
         6.4. Market Attractiveness By Solution
     
    7. Global Cloud-based Simulation Application Market Analysis and Forecasts, By Industry
         7.1. Introduction & Definition
         7.2. Market Size (US$ Mn) Forecast By Industry
                7.2.1. Manufacturing 
                7.2.2. Media & Entertainment 
                7.2.3. Construction
                7.2.4. Automotive
                7.2.5. Transportation & Logistics
                7.2.6. Healthcare
                7.2.7. Defense and Aerospace
                7.2.8. Energy & Power
                7.2.9. Others
         7.3. Industry Comparison Matrix
         7.4. Market Attractiveness By Industry
     
    8. Global Cloud-based Simulation Application Market Analysis and Forecasts, By Region
         8.1. Key Findings
         8.2. Key Trends
         8.3. Market Size (US$ Mn) Forecast By Region, 2015 – 2025 
                8.3.1. North America
                8.3.2. Europe
                8.3.3. Asia Pacific
                8.3.4. Middle East and Africa
    8.3.5. South America
         8.4. Market Attractiveness By Country/Region
     
    9. North America Cloud-based Simulation Application Market Analysis and Forecast
         9.1. Key Trends
         9.2. Market Size (US$ Mn) Forecast By Application
                9.2.1. Training
                9.2.2. Process Improvement
                9.2.3. Predicting Outcomes
                9.2.4. Managing Risk
         9.3. Market Size (US$ Mn) Forecast By Solution
                9.3.1. Software as a Service (SaaS)
                9.3.2. Platform as a Service (PaaS)
                9.3.3. Infrastructure as a Service (IaaS)
         9.4. Market Size (US$ Mn) Forecast By Industry
                9.4.1. Manufacturing 
                9.4.2. Media & Entertainment 
                9.4.3. Construction
                9.4.4. Automotive
                9.4.5. Transportation & Logistics
                9.4.6. Healthcare
                9.4.7. Defense and Aerospace
                9.4.8. Energy & Power
                9.4.9. Other            s
         9.5. Market Size (US$ Mn) Forecast By Country
                9.5.1. The U.S
                9.5.2. Canada
                9.5.3. Rest of North America
         9.6. Market Attractiveness Analysis 
                9.6.1. By Application
                9.6.2. By Solution
                9.6.3. By Industry
                9.6.4. By Country
     
    10.   Europe Cloud-based Simulation Application Market Analysis and Forecast
         10.1.Key Trends
         10.2. Market Size (US$ Mn) Forecast By Application
                10.2.1. Training
                10.2.2. Process Improvement
                10.2.3. Predicting Outcomes
                10.2.4. Managing Risk
         10.3. Market Size (US$ Mn) Forecast By Solution
                10.3.1. Software as a Service (SaaS)
                10.3.2. Platform as a Service (PaaS)
                10.3.3. Infrastructure as a Service (IaaS)
         10.4. Market Size (US$ Mn) Forecast By Industry
                10.4.1. Manufacturing 
                10.4.2. Media & Entertainment 
                10.4.3. Construction
                10.4.4. Automotive
                10.4.5. Transportation & Logistics
                10.4.6. Healthcare
                10.4.7. Defense and Aerospace
                10.4.8. Energy & Power
                10.4.9. Others
         10.5. Market Size (US$ Mn) Forecast By Country
                10.5.1. Germany
                10.5.2. France
                10.5.3. The U.K.
                10.5.4. Rest of Europe
         10.6. Market Attractiveness Analysis 
                10.6.1. By Application
                10.6.2. By Solution
                10.6.3. By Industry
    10.6.4. By Country
     
    11.   Asia Pacific Cloud-based Simulation Application Market Analysis and Forecast
         11.1.Key Trends
         11.2. Market Size (US$ Mn) Forecast By Application
                11.2.1. Training
                11.2.2. Process Improvement
                11.2.3. Predicting Outcomes
                11.2.4. Managing Risk
         11.3. Market Size (US$ Mn) Forecast By Solution
                11.3.1. Software as a Service (SaaS)
                11.3.2. Platform as a Service (PaaS)
                11.3.3. Infrastructure as a Service (IaaS)
         11.4. Market Size (US$ Mn) Forecast By Industry
                11.4.1. Manufacturing 
                11.4.2. Media & Entertainment 
                11.4.3. Construction
                11.4.4. Automotive
                11.4.5. Transportation & Logistics
                11.4.6. Healthcare
                11.4.7. Defense and Aerospace
                11.4.8. Energy & Power
                11.4.9. Others
         11.5. Market Size (US$ Mn) Forecast By Country
                11.5.1. China
                11.5.2. India
                11.5.3. Japan
                11.5.4. South Korea
                11.5.5. Rest of Asia Pacific
         11.6.Market Attractiveness Analysis 
                11.6.1. By Application
                11.6.2. By Solution
                11.6.3. By Industry
                11.6.4. By Country
     
    12.   Middle East and Africa (MEA) Cloud-based Simulation Application Market Analysis and Forecast
         12.1.Key Trends
         12.2. Market Size (US$ Mn) Forecast By Application
                12.2.1. Training
                12.2.2. Process Improvement
                12.2.3. Predicting Outcomes
                12.2.4. Managing Risk
                     12.3. Market Size (US$ Mn) Forecast By Type
                12.3.1. Software as a Service (SaaS)
                12.3.2. Platform as a Service (PaaS)
                12.3.3. Infrastructure as a Service (IaaS)
         12.4. Market Size (US$ Mn) Forecast By Industry
                12.4.1. Manufacturing 
                12.4.2. Media & Entertainment 
                12.4.3. Construction
                12.4.4. Automotive
                12.4.5. Transportation & Logistics
                12.4.6. Healthcare
                12.4.7. Defense and Aerospace
                12.4.8. Energy & Power
                12.4.9. Others
         12.5. Market Size (US$ Mn) Forecast By Country
                12.5.1. GCC Countries
                12.5.2. South Africa
                12.5.3. Rest of Middle East and Africa
         12.6. Market Attractiveness Analysis 
                12.6.1. By Application
                12.6.2. By Solution
                12.6.3. By Industry
                12.6.4. By Country
     
    13.   South America Cloud-based Simulation Application Market Analysis and Forecast
         13.1.Key Trends
         13.2. Market Size (US$ Mn) Forecast By Application
                13.2.1. Training
                13.2.2. Process Improvement
                13.2.3. Predicting Outcomes
                13.2.4. Managing Risk
         13.3. Market Size (US$ Mn) Forecast By Solution
                13.3.1. Software as a Service (SaaS),  2015 – 2025 (US$ Mn)
                13.3.2. Platform as a Service (PaaS)
                13.3.3. Infrastructure as a Service (IaaS)
         13.4. Market Size (US$ Mn) Forecast By Industry
                13.4.1. Manufacturing 
                13.4.2. Media & Entertainment 
                13.4.3. Construction
                13.4.4. Automotive
                13.4.5. Transportation & Logistics
                13.4.6. Healthcare
                13.4.7. Defense and Aerospace
                13.4.8. Energy & Power
                13.4.9. Others
         13.5. Market Size (US$ Mn) Forecast By Country
                13.5.1. Brazil
                13.5.2. Argentina
                13.5.3. Rest of South America
         13.6.Market Attractiveness Analysis 
                13.6.1. By Application
                13.6.2. By Solution 
                13.6.3. By Industry
    13.6.4. By Country
     
    14.   Competition Landscape
         14.1. Market Player – Competition Matrix 
         14.2. Market Share Analysis By Company (2016)
         14.3.Company Profiles (Details – Overview, Financials, Strategy & SWOT Analysis)
                14.3.1. ANSYS Inc.
                          14.3.1.1. Company Details (HQ, Foundation Year, Employee Strength)
                          14.3.1.2. Market Presence, By Segment
                          14.3.1.3. Strategy
                          14.3.1.4. Revenue and Operating Profits
                          14.3.1.5. SWOT Analysis
                14.3.2. Autodesk Inc.
                          14.3.2.1. Company Details (HQ, Foundation Year, Employee Strength)
                          14.3.2.2. Market Presence, By Segment
                          14.3.2.3. Strategy
                          14.3.2.4. Revenue and Operating Profits
                          14.3.2.5. SWOT Analysis
                14.3.3. Dassault Systemes
                          14.3.3.1. Company Details (HQ, Foundation Year, Employee Strength)
                          14.3.3.2. Market Presence, By Segment
                          14.3.3.3. Strategy
                          14.3.3.4. Revenue and Operating Profits
                          14.3.3.5. SWOT Analysis
                14.3.4. Exa Corporation
                          14.3.4.1. Company Details (HQ, Foundation Year, Employee Strength)
                          14.3.4.2. Market Presence, By Segment
                          14.3.4.3. Strategy
                          14.3.4.4. Revenue and Operating Profits
                          14.3.4.5. SWOT Analysis
                14.3.5. Fieldscale
                          14.3.5.1. Company Details (HQ, Foundation Year, Employee Strength)
                          14.3.5.2. Market Presence, By Segment
                          14.3.5.3. Strategy
                          14.3.5.4. Revenue and Operating Profits
                          14.3.5.5. SWOT Analysis
                14.3.6. MSC Software
                          14.3.6.1. Company Details (HQ, Foundation Year, Employee Strength)
                          14.3.6.2. Market Presence, By Segment
                          14.3.6.3. Strategy
                          14.3.6.4. Revenue and Operating Profits
                          14.3.6.5. SWOT Analysis
                14.3.7. Rescale Inc. 
                          14.3.7.1. Company Details (HQ, Foundation Year, Employee Strength)
                          14.3.7.2. Market Presence, By Segment
                          14.3.7.3. Strategy
                          14.3.7.4. Revenue and Operating Profits
                          14.3.7.5. SWOT Analysis
                14.3.8. Siemens PLM Software
                          14.3.8.1. Company Details (HQ, Foundation Year, Employee Strength)
                          14.3.8.2. Market Presence, By Segment
                          14.3.8.3. Strategy
                          14.3.8.4. Revenue and Operating Profits
                          14.3.8.5. SWOT Analysis
                14.3.9. SimCore Technologies
                          14.3.9.1. Company Details (HQ, Foundation Year, Employee Strength)
                          14.3.9.2. Market Presence, By Segment
                          14.3.9.3. Strategy
                          14.3.9.4. Revenue and Operating Profits
                          14.3.9.5. SWOT Analysis
                14.3.10. SimScale
                          14.3.10.1. Company Details (HQ, Foundation Year, Employee Strength)
                          14.3.10.2. Market Presence, By Segment
                          14.3.10.3. Strategy
                          14.3.10.4. Revenue and Operating Profits
                          14.3.10.5. SWOT Analysis
                14.3.11. SOASTA, Inc.
                          14.3.11.1. Company Details (HQ, Foundation Year, Employee Strength)
                          14.3.11.2. Market Presence, By Segment
                          14.3.11.3. Strategy
                          14.3.11.4. Revenue and Operating Profits
                          14.3.11.5. SWOT Analysis
     
    15. Key Takeaways

    List of Tables

    Table 1: Global Cloud Based Simulation Application Market Size (US$ Mn) Forecast, by Application, 2015 - 2025
    Table 2: Analysis, by Application
    Table 3: Global Cloud Based Simulation Application Market Size (US$ Mn) Forecast, by Solution, 2015 - 2025
    Table 4: Analysis, by Solution
    Table 5: Global Cloud Based Simulation Application Market Size (US$ Mn) Forecast, by Industry, 2015 - 2025
    Table 6: Analysis, by Industry
    Table 7: Global Cloud Based Simulation Application Market Size (US$ Mn) Forecast, by Region, 2015 - 2025
    Table 8: North America Cloud Based Simulation Application Market Size (US$ Mn) Forecast, by Application, 2015 - 2025
    Table 9: North America Cloud Based Simulation Application Market Size (US$ Mn) Forecast, by Solution, 2015 - 2025
    Table 10: North America Cloud Based Simulation Application Market Size (US$ Mn) Forecast, by Industry, 2015 - 2025
    Table 11: North America Cloud Based Simulation Application Market Size (US$ Mn) Forecast, by Country, 2015 - 2025
    Table 12: Europe Cloud Based Simulation Application Market Size (US$ Mn) Forecast, by Application, 2015 - 2025
    Table 13: Europe Cloud Based Simulation Application Market Size (US$ Mn) Forecast, by Solution, 2015 - 2025
    Table 14: Europe Cloud Based Simulation Application Market Size (US$ Mn) Forecast, by Industry, 2015 - 2025
    Table 15: Europe Cloud Based Simulation Application Market Size (US$ Mn) Forecast, by Country, 2015 - 2025
    Table 16: APAC Cloud Based Simulation Application Market Size (US$ Mn) Forecast, by Application, 2015 - 2025
    Table 17: APAC Cloud Based Simulation Application Market Size (US$ Mn) Forecast, by Solution, 2015 - 2025
    Table 18: APAC Cloud Based Simulation Application Market Size (US$ Mn) Forecast, by Industry, 2015 - 2025
    Table 19: APAC Cloud Based Simulation Application Market Size (US$ Mn) Forecast, by Country, 2015 - 2025
    Table 20: MEA Cloud Based Simulation Application Market Size (US$ Mn) Forecast, by Application, 2015 - 2025
    Table 21: MEA Cloud Based Simulation Application Market Size (US$ Mn) Forecast, by Solution, 2015 - 2025
    Table 22: MEA Cloud Based Simulation Application Market Size (US$ Mn) Forecast, by Industry, 2015 - 2025
    Table 23: MEA Cloud Based Simulation Application Market Size (US$ Mn) Forecast, by Country, 2015 - 2025
    Table 24: South America Cloud Based Simulation Application Market Size (US$ Mn) Forecast, by Application, 2015 - 2025
    Table 25: South America Cloud Based Simulation Application Market Size (US$ Mn) Forecast, by Solution, 2015 - 2025
    Table 26: South America Cloud Based Simulation Application Market Size (US$ Mn) Forecast, by Industry, 2015 - 2025
    Table 27: South America Cloud Based Simulation Application Market Size (US$ Mn) Forecast, by Country, 2015 - 2025

    List of Figures

    Figure 1: Global Cloud Based Simulation Application Market Revenue Projection (US$ Mn), 2015 – 2025
    Figure 2: Global Cloud Based Simulation Application Market Y-o-Y Growth (Value %) Forecast, 2016 - 2025
    Figure 3: Global Cloud Based Simulation Application Market Revenue Projection (US$ Mn), by Region, 2015 – 2025
    Figure 4: Market Value Share by Region (2016)
    Figure 5: Market Value Share by Application (2016)
    Figure 6: Market Value Share by Solution (2016)
    Figure 7: Market Value Share by Industry (2016)
    Figure 8: Global Cloud Based Simulation Application Market Revenue and Y-o-Y Growth, by Application – Training, 2015 - 2025, (US$ Mn and Value %)
    Figure 9: Global Cloud Based Simulation Application Market Revenue and Y-o-Y Growth, by Application – Process Improvement, 2015 - 2025, (US$ Mn and Value %)
    Figure 10: Global Cloud Based Simulation Application Market Revenue and Y-o-Y Growth, by Application – Predicting Outcomes, 2015 - 2025, (US$ Mn and Value %)
    Figure 11: Global Cloud Based Simulation Application Market Revenue and Y-o-Y Growth, by Application – Managing Risk 2015 - 2025, (US$ Mn and Value %)
    Figure 12: Global Cloud Based Simulation Application Market Comparison Matrix, By Application
    Figure 13: Cloud Based Simulation Application Market Attractiveness Analysis by Application
    Figure 14: Global Cloud Based Simulation Application Market Revenue and Y-o-Y Growth, by Solution – Software as a Service (SaaS), 2015 - 2025, (US$ Mn and Value %)
    Figure 15: Global Cloud Based Simulation Application Market Revenue and Y-o-Y Growth, by Solution – Platform as a Service (PaaS), 2015 - 2025, (US$ Mn and Value %)
    Figure 16: Global Cloud Based Simulation Application Market Revenue and Y-o-Y Growth, by Solution – Infrastructure as a Service (IaaS), 2015 - 2025, (US$ Mn and Value %)
    Figure 17: Global Cloud Based Simulation Application Market Comparison Matrix, By Solution
    Figure 18: Cloud Based Simulation Application Market Attractiveness Analysis by Solution
    Figure 19: Global Cloud Based Simulation Application Market Revenue and Y-o-Y Growth, by Industry – Manufacturing, 2015 - 2025, (US$ Mn and Value %)
    Figure 20: Global Cloud Based Simulation Application Market Revenue and Y-o-Y Growth, by Industry – Media & Entertainment, 2015 - 2025, (US$ Mn and Value %)
    Figure 21: Global Cloud Based Simulation Application Market Revenue and Y-o-Y Growth, by Industry – Construction, 2015 - 2025, (US$ Mn and Value %)
    Figure 22: Global Cloud Based Simulation Application Market Revenue and Y-o-Y Growth, by Industry – Automotive, 2015 - 2025, (US$ Mn and Value %)
    Figure 23: Global Cloud Based Simulation Application Market Revenue and Y-o-Y Growth, by Industry – Transportation & Logistics, 2015 - 2025, (US$ Mn and Value %)
    Figure 24: Global Cloud Based Simulation Application Market Revenue and Y-o-Y Growth, by Industry – Healthcare, 2015 - 2025, (US$ Mn and Value %)
    Figure 25: Global Cloud Based Simulation Application Market Revenue and Y-o-Y Growth, by Industry – Defense and Aerospace, 2015 - 2025, (US$ Mn and Value %)
    Figure 26: Global Cloud Based Simulation Application Market Revenue and Y-o-Y Growth, by Industry – Energy & Power, 2015 - 2025, (US$ Mn and Value %)
    Figure 27: Global Cloud Based Simulation Application Market Revenue and Y-o-Y Growth, by Industry – Others, 2015 - 2025, (US$ Mn and Value %)
    Figure 28: Segment Growth Matrix, 2017 - 25 (%)
    Figure 29: Segment Revenue Contribution, 2017 - 25 (%)
    Figure 30: Segment Compounded Growth Matrix (CAGR %)
    Figure 31: Global Cloud Based Simulation Application Market Attractiveness Analysis by Industry
    Figure 32: Global Cloud Based Simulation Application Market Attractiveness Analysis, by Region
    Figure 33: North America Market Trends
    Figure 34: North America Cloud Based Simulation Application Market Size (US$ Mn) Forecast, 2015 - 2025
    Figure 35: Market Attractiveness by Application (2016)
    Figure 36: Market Attractiveness By Industry (2016)
    Figure 37: Market Attractiveness by Solution (2016)
    Figure 38: Market Attractiveness By Country (2016)
    Figure 39: Europe Market Trends
    Figure 40: Europe Cloud Based Simulation Application Market Size (US$ Mn) Forecast, 2015 - 2025
    Figure 41: Market Attractiveness by Application (2016)
    Figure 42: Market Attractiveness by Industry (2016)
    Figure 43: Market Attractiveness by Solution (2016)
    Figure 44: Market Attractiveness By Country (2016)
    Figure 45: Asia Pacific Market Trends
    Figure 46: Asia Pacific Cloud Based Simulation Application Market Size (US$ Mn) Forecast, 2015 - 2025
    Figure 47: Market Attractiveness by Application (2016)
    Figure 48: Market Attractiveness By Industry (2016)
    Figure 49: Market Attractiveness by Solution (2016)
    Figure 50: Market Attractiveness By Country (2016)
    Figure 51: MEA Market Trends
    Figure 52: MEA Cloud Based Simulation Application Market Size (US$ Mn) Forecast, 2015 - 2025
    Figure 53: Market Attractiveness by Application (2016)
    Figure 54: Market Attractiveness By Industry (2016)
    Figure 55: Market Attractiveness by Solution (2016)
    Figure 56: Market Attractiveness By Country (2016)
    Figure 57: South America Market Trends
    Figure 58: South America Cloud Based Simulation Application Market Size (US$ Mn) Forecast, 2015 - 2025
    Figure 59: Market Attractiveness by Application (2016)
    Figure 60: Market Attractiveness By Industry (2016)
    Figure 61: Market Attractiveness by Solution (2016)
    Figure 62: Market Attractiveness By Country (2016)
    Figure 63: ANSYS, Inc., Operating Revenue (2016), by Region
    Figure 64: ANSYS, Inc., Revenue (US$ Mn) and Y-o-Y Growth (%), 2014–2016
    Figure 65: Autodesk Inc., Operating Revenue(2017), by Region
    Figure 66: Autodesk Inc., Revenue (US$ Mn) and Y-o-Y Growth (%), 2015–2017
    Figure 67: Dassault Systèmes, Operating Revenue (2016), by Region
    Figure 68: Dassault Systèmes, Revenue (US$ Mn) and Y-o-Y Growth (%), 2014–2016
    Figure 69: Exa Corporation, Operating Revenue (2017), by Region
    Figure 70: Exa Corporation, Revenue (US$ Mn) and Y-o-Y Growth (%), 2015–2017
    Figure 71: MSC Software, Breakdown of Net Sales (Hexagon AB), by Region/Country (2016)
    Figure 72: MSC Software, Revenue (US$ Mn) & Y-o-Y Growth (%), 2009, 2015-2016
    Figure 73: Siemens, Breakdown of Net Sales, by Region/Country (2016)
    Figure 74: Siemens, Revenue (US$ Bn) & Y-o-Y Growth (%), Siemens AG, 2014-2016

Copyright © Transparency Market Research, Inc. All Rights reserved