
Challenges associated with traditional integration needs have compelled the adoption of Integration Platform as a Service (IPaaS) approach, which is a viable alternative to deliver integration stacks. Complex tasks such as integrating hybrid application portfolios with conventional data systems are being effectively carried out by IPaaS solutions. Transparency Market Research anticipates that in the near future, the adoption of IPaaS will surge vigorously, particularly owing to the capabilities of these services in routing & orchestration of complex dataflow and providing easy implementation of API, applications and processes for subscribers.
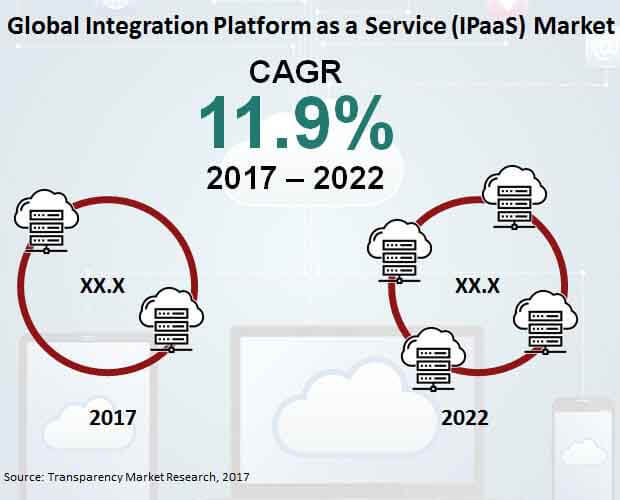
According to the recently developed market study, the global IPaaS market is anticipated to be worth over US$ 1.2 billion by 2022-end. Over the next five years, the global IPaaS market is pegged to expand at a robust CAGR. The report has highlighted several factors that are expected to influence the dynamics of global IPaaS market during the forecast period. Increasing demand for cloud-based integration, rising implementation of service-oriented business architecture, and operational importance of executing integration flows among contrasting applications, are among the key factors addressed in the report as growth drivers for the global IPaaS market.
By 2022, software platforms offered by IPaaS providers will bring in nearly US$ 800 million in global revenues
Key components of IPaaS solutions include either the service provided for integration tasks, or the software platforms developed to carry out these tasks. In 2017, a major share of revenues procured in the global IPaaS market are anticipated to come from sales of software platforms. However, over the forecast period, the end-users of IPaaS solutions will be shifting their focus from using a software platform to adopting a service. Implementation issues associated with IPaaS software platforms are being viewed to decelerate their revenue procurement traction in the global market over the forecast period. By the end of 2022, IPaaS software platforms will procure largest share as a component in the global IPaaS market. Although, the adoption of IPaaS services will be considerably rapid, and is anticipated to register a stellar 12.8% CAGR throughout the forecast period.
Higher end-use of IPaaS by large enterprises
The report projects that large enterprises will remain key end-users of IPaaS during the forecast period. Compared to small & medium enterprises, multinational corporations and manufacturing giants are estimated to actively adopt IPaaS solutions and integrate complex operations to enhance their overall productivity. In 2017, close to three-fourth share of revenues procured in the global IPaaS market are anticipated to be accounted by their end-use among large enterprises across the globe. On the other hand, constraints associated with expenditure on integration solutions will continue to lower the adoption of IPaaS among SMEs.
Steadfast IPaaS adoption in Healthcare and Education industries
According to the report, the global IPaaS market will showcase considerable traction in terms of adoption across education and healthcare verticals. While the adoption of IPaaS will be predominant in the IT & telecommunications industry, participants in the healthcare and education sectors will also show increased interests towards integration solutions. Hospitals and healthcare service providers are likely to adopt IPaaS for integration of documentation processes and supplies management. Pharmaceutical companies are expected to implement IPaaS for consolidating their manufacturing with drug development operations. For the education industry, IPaaS will enable schools to streamline and organize their daily operations, and control the access to information and data through integrated platforms.
Leading IPaaS Providers
The report has also profiled key players in the global IPaaS market. Companies namely, IBM Corporation, MuleSoft, Inc., Oracle Corporation, Fujitsu Ltd., Red Hat, Inc., SAP SE, Microsoft Corp., Capgemini SE, TIBCO Software Inc., and Dell Inc. are anticipated to remain active in the expansion of global IPaaS market through 2022. Several IPaaS providers will be focusing on eliminating the implementation drawbacks and lowering the additional service requirements by developing custom-made offerings.
Integration Platform as a Service (iPaaS) Market to Grow as Digital Transformation Gains Momentum
The demand within the global integration platform as a service (iPaaS) market is expected to rise at a sturdy pace in the times to follow. Growing digitalization has caused an uptick in demand for integration services in recent years. The corporate landscape has undergone major overhauls over the past decade, promoting industrial decision-makers to make deliberate efforts towards attaining digital maturity. The trend of digitalization is strongly supported by the ardent efforts of corporate houses towards connecting their business nodes. As the corporate industry goes digital, use of integration technologies and services shall become more pronounced. Therefore, the total volume of sales across the global integration platform as a service (iPaaS) market is slated to rise in the years to follow.
Use of third-party cloud software has also increased by leaps and bounds post the onset of the COVID-19 pandemic. This is an important driver of demand within the global integration platform as a service (iPaaS) market. Furthermore, the relevance of remote data sharing across industrial and business units has brought cloud platforms under the spotlight of attention. In view of these factors, it is safe to assert that the global integration platform as a service (iPaaS) market would grow at a stellar pace in the years to follow. Use of data assets across the business sector during the current pandemic situation is also driving revenue generation across the market.
1. Global Integration Platform as a Service (IPaaS) Market - Executive Summary
2. Global Integration Platform as a Service (IPaaS) Market Overview
2.1. Introduction
2.1.1. Global Integration Platform as a Service (IPaaS) Market Taxonomy
2.1.2. Global Integration Platform as a Service (IPaaS) Market Definition
2.2. Global Integration Platform as a Service (IPaaS) Market Size (US$ Mn) and Forecast, 2012-2022
2.2.1. Global Integration Platform as a Service (IPaaS) Market Y-o-Y Growth
2.3. Global Integration Platform as a Service (IPaaS) Market Dynamics
2.4. Value Chain
2.5. Service Vendors List
2.6. Regional Trends
2.7. Managed Service providers List
2.8. Key Participants Market Presence (Intensity Map) By Region
3. Global Integration Platform as a Service (IPaaS) Market Analysis and Forecast By Component
3.1. Global Integration Platform as a Service (IPaaS) Market Size and Forecast By Component, 2012-2022
3.1.1. Software Platform Market Size and Forecast, 2012-2022
3.1.1.1. Revenue (US$ Mn) Comparison, By Region
3.1.1.2. Market Share Comparison, By Region
3.1.1.3. Y-o-Y growth Comparison, By Region
3.1.2. Services Market Size and Forecast, 2012-2022
3.1.2.1. Revenue (US$ Mn) Comparison, By Region
3.1.2.2. Market Share Comparison, By Region
3.1.2.3. Y-o-Y growth Comparison, By Region
4. Global Integration Platform as a Service (IPaaS) Market Analysis and Forecast By End User
4.1. Global Integration Platform as a Service (IPaaS) Market Size and Forecast By End User, 2012-2022
4.1.1. Large Enterprise Market Size and Forecast, 2012-2022
4.1.1.1. Revenue (US$ Mn) Comparison, By Region
4.1.1.2. Market Share Comparison, By Region
4.1.1.3. Y-o-Y growth Comparison, By Region
4.1.2. Small & Medium Enterprise Market Size and Forecast, 2012-2022
4.1.2.1. Revenue (US$ Mn) Comparison, By Region
4.1.2.2. Market Share Comparison, By Region
4.1.2.3. Y-o-Y growth Comparison, By Region
5. Global Integration Platform as a Service (IPaaS) Market Analysis and Forecast By Industry
5.1. Global Integration Platform as a Service (IPaaS) Market Size and Forecast By Industry, 2012-2022
5.1.1. BFSI Market Size and Forecast, 2012-2022
5.1.1.1. Revenue (US$ Mn) Comparison, By Region
5.1.1.2. Market Share Comparison, By Region
5.1.1.3. Y-o-Y growth Comparison, By Region
5.1.2. IT & Telecom Market Size and Forecast, 2012-2022
5.1.2.1. Revenue (US$ Mn) Comparison, By Region
5.1.2.2. Market Share Comparison, By Region
5.1.2.3. Y-o-Y growth Comparison, By Region
5.1.3. Healthcare Market Size and Forecast, 2012-2022
5.1.3.1. Revenue (US$ Mn) Comparison, By Region
5.1.3.2. Market Share Comparison, By Region
5.1.3.3. Y-o-Y growth Comparison, By Region
5.1.4. Government Market Size and Forecast, 2012-2022
5.1.4.1. Revenue (US$ Mn) Comparison, By Region
5.1.4.2. Market Share Comparison, By Region
5.1.4.3. Y-o-Y growth Comparison, By Region
5.1.5. Education Market Size and Forecast, 2012-2022
5.1.5.1. Revenue (US$ Mn) Comparison, By Region
5.1.5.2. Market Share Comparison, By Region
5.1.5.3. Y-o-Y growth Comparison, By Region
5.1.6. Others Market Size and Forecast, 2012-2022
5.1.6.1. Revenue (US$ Mn) Comparison, By Region
5.1.6.2. Market Share Comparison, By Region
5.1.6.3. Y-o-Y growth Comparison, By Region
6. Global Integration Platform as a Service (IPaaS) Market Analysis and Forecast By Region
6.1. Global Integration Platform as a Service (IPaaS) Market Size and Forecast, 2012-2022
6.1.1. North America Integration Platform as a Service (IPaaS) Market Size and Forecast, 2012-2022
6.1.1.1. Revenue (US$ Mn) Comparison, By Component
6.1.1.2. Revenue (US$ Mn) Comparison, By End User
6.1.1.3. Revenue (US$ Mn) Comparison, By Industry
6.1.2. Latin America Integration Platform as a Service (IPaaS) Market Size and Forecast, 2012-2022
6.1.2.1. Revenue (US$ Mn) Comparison, By Component
6.1.2.2. Revenue (US$ Mn) Comparison, By End User
6.1.2.3. Revenue (US$ Mn) Comparison, By Industry
6.1.3. Europe Integration Platform as a Service (IPaaS) Market Size and Forecast, 2012-2022
6.1.3.1. Revenue (US$ Mn) Comparison, By Component
6.1.3.2. Revenue (US$ Mn) Comparison, By End User
6.1.3.3. Revenue (US$ Mn) Comparison, By Industry
6.1.4. Japan Integration Platform as a Service (IPaaS) Market Size and Forecast, 2012-2022
6.1.4.1. Revenue (US$ Mn) Comparison, By Component
6.1.4.2. Revenue (US$ Mn) Comparison, By End User
6.1.4.3. Revenue (US$ Mn) Comparison, By Industry
6.1.5. APEJ Integration Platform as a Service (IPaaS) Market Size and Forecast, 2012-2022
6.1.5.1. Revenue (US$ Mn) Comparison, By Component
6.1.5.2. Revenue (US$ Mn) Comparison, By End User
6.1.5.3. Revenue (US$ Mn) Comparison, By Industry
6.1.6. MEA Integration Platform as a Service (IPaaS) Market Size and Forecast, 2012-2022
6.1.6.1. Revenue (US$ Mn) Comparison, By Component
6.1.6.2. Revenue (US$ Mn) Comparison, By End User
6.1.6.3. Revenue (US$ Mn) Comparison, By Industry
7. North America Integration Platform as a Service (IPaaS) Market Analysis and Forecast, By Country, 2012-2022
7.1. US Integration Platform as a Service (IPaaS) Market Size and Forecast, 2012-2022
7.1.1. Revenue (US$ Mn) Comparison, By Component
7.1.2. Revenue (US$ Mn) Comparison, By End User
7.1.3. Revenue (US$ Mn) Comparison, By Industry
7.2. Canada Integration Platform as a Service (IPaaS) Market Size and Forecast, 2012-2022
7.2.1. Revenue (US$ Mn) Comparison, By Component
7.2.2. Revenue (US$ Mn) Comparison, By End User
7.2.3. Revenue (US$ Mn) Comparison, By Industry
8. Latin America Integration Platform as a Service (IPaaS) Market Analysis and Forecast, By Country, 2012-2022
8.1. Brazil Integration Platform as a Service (IPaaS) Market Size and Forecast, 2012-2022
8.1.1. Revenue (US$ Mn) Comparison, By Component
8.1.2. Revenue (US$ Mn) Comparison, By End User
8.1.3. Revenue (US$ Mn) Comparison, By Industry
8.2. Mexico Integration Platform as a Service (IPaaS) Market Size and Forecast, 2012-2022
8.2.1. Revenue (US$ Mn) Comparison, By Component
8.2.2. Revenue (US$ Mn) Comparison, By End User
8.2.3. Revenue (US$ Mn) Comparison, By Industry
8.3. Argentina Integration Platform as a Service (IPaaS) Market Size and Forecast, 2012-2022
8.3.1. Revenue (US$ Mn) Comparison, By Component
8.3.2. Revenue (US$ Mn) Comparison, By End User
8.3.3. Revenue (US$ Mn) Comparison, By Industry
9. Europe Integration Platform as a Service (IPaaS) Market Analysis and Forecast, By Country, 2012-2022
9.1. Germany Integration Platform as a Service (IPaaS) Market Size and Forecast, 2012-2022
9.1.1. Revenue (US$ Mn) Comparison, By Component
9.1.2. Revenue (US$ Mn) Comparison, By End User
9.1.3. Revenue (US$ Mn) Comparison, By Industry
9.2. UK Integration Platform as a Service (IPaaS) Market Size and Forecast, 2012-2022
9.2.1. Revenue (US$ Mn) Comparison, By Component
9.2.2. Revenue (US$ Mn) Comparison, By End User
9.2.3. Revenue (US$ Mn) Comparison, By Industry
9.3. France Integration Platform as a Service (IPaaS) Market Size and Forecast, 2012-2022
9.3.1. Revenue (US$ Mn) Comparison, By Component
9.3.2. Revenue (US$ Mn) Comparison, By End User
9.3.3. Revenue (US$ Mn) Comparison, By Industry
9.4. Spain Integration Platform as a Service (IPaaS) Market Size and Forecast, 2012-2022
9.4.1. Revenue (US$ Mn) Comparison, By Component
9.4.2. Revenue (US$ Mn) Comparison, By End User
9.4.3. Revenue (US$ Mn) Comparison, By Industry
9.5. Italy Integration Platform as a Service (IPaaS) Market Size and Forecast, 2012-2022
9.5.1. Revenue (US$ Mn) Comparison, By Component
9.5.2. Revenue (US$ Mn) Comparison, By End User
9.5.3. Revenue (US$ Mn) Comparison, By Industry
9.6. Nordic Integration Platform as a Service (IPaaS) Market Size and Forecast, 2012-2022
9.6.1. Revenue (US$ Mn) Comparison, By Component
9.6.2. Revenue (US$ Mn) Comparison, By End User
9.6.3. Revenue (US$ Mn) Comparison, By Industry
10. Japan Integration Platform as a Service (IPaaS) Market Analysis and Forecast, By Country, 2012-2022
10.1. Japan Integration Platform as a Service (IPaaS) Market Size and Forecast, 2012-2022
10.1.1. Revenue (US$ Mn) Comparison, By Component
10.1.2. Revenue (US$ Mn) Comparison, By End User
10.1.3. Revenue (US$ Mn) Comparison, By Industry
11. APEJ Integration Platform as a Service (IPaaS) Market Analysis and Forecast, By Country, 2012-2022
11.1. China Integration Platform as a Service (IPaaS) Market Size and Forecast, 2012-2022
11.1.1. Revenue (US$ Mn) Comparison, By Component
11.1.2. Revenue (US$ Mn) Comparison, By End User
11.1.3. Revenue (US$ Mn) Comparison, By Industry
11.2. India Integration Platform as a Service (IPaaS) Market Size and Forecast, 2012-2022
11.2.1. Revenue (US$ Mn) Comparison, By Component
11.2.2. Revenue (US$ Mn) Comparison, By End User
11.2.3. Revenue (US$ Mn) Comparison, By Industry
11.3. Malaysia Integration Platform as a Service (IPaaS) Market Size and Forecast, 2012-2022
11.3.1. Revenue (US$ Mn) Comparison, By Component
11.3.2. Revenue (US$ Mn) Comparison, By End User
11.3.3. Revenue (US$ Mn) Comparison, By Industry
11.4. Thailand Integration Platform as a Service (IPaaS) Market Size and Forecast, 2012-2022
11.4.1. Revenue (US$ Mn) Comparison, By Component
11.4.2. Revenue (US$ Mn) Comparison, By End User
11.4.3. Revenue (US$ Mn) Comparison, By Industry
11.5. Singapore Integration Platform as a Service (IPaaS) Market Size and Forecast, 2012-2022
11.5.1. Revenue (US$ Mn) Comparison, By Component
11.5.2. Revenue (US$ Mn) Comparison, By End User
11.5.3. Revenue (US$ Mn) Comparison, By Industry
11.6. Australia Integration Platform as a Service (IPaaS) Market Size and Forecast, 2012-2022
11.6.1. Revenue (US$ Mn) Comparison, By Component
11.6.2. Revenue (US$ Mn) Comparison, By End User
11.6.3. Revenue (US$ Mn) Comparison, By Industry
12. MEA Integration Platform as a Service (IPaaS) Market Analysis and Forecast, By Country, 2012-2022
12.1. GCC Countries Integration Platform as a Service (IPaaS) Market Size and Forecast, 2012-2022
12.1.1. Revenue (US$ Mn) Comparison, By Component
12.1.2. Revenue (US$ Mn) Comparison, By End User
12.1.3. Revenue (US$ Mn) Comparison, By Industry
12.2. South Africa Integration Platform as a Service (IPaaS) Market Size and Forecast, 2012-2022
12.2.1. Revenue (US$ Mn) Comparison, By Component
12.2.2. Revenue (US$ Mn) Comparison, By End User
12.2.3. Revenue (US$ Mn) Comparison, By Industry
12.3. Nigeria Integration Platform as a Service (IPaaS) Market Size and Forecast, 2012-2022
12.3.1. Revenue (US$ Mn) Comparison, By Component
12.3.2. Revenue (US$ Mn) Comparison, By End User
12.3.3. Revenue (US$ Mn) Comparison, By Industry
12.4. Israel Integration Platform as a Service (IPaaS) Market Size and Forecast, 2012-2022
12.4.1. Revenue (US$ Mn) Comparison, By Component
12.4.2. Revenue (US$ Mn) Comparison, By End User
12.4.3. Revenue (US$ Mn) Comparison, By Industry
13. Global Integration Platform as a Service (IPaaS) Market Company Share, Competition Landscape and Company Profiles
13.1. Company Share Analysis
13.2. Competition Landscape
13.3. Company Profiles
13.3.1. IBM Corporation
13.3.2. MuleSoft Inc.
13.3.3. Oracle Corporation
13.3.4. Fujitsu Limited
13.3.5. Red Hat Inc.
13.3.6. SAP SE
13.3.7. Microsoft Corporation
13.3.8. Capgemini SE
13.3.9. Tibco Software Inc
13.3.10. Dell Inc.
14. Research Methodology
15. Secondary and Primary Sources
16. Assumptions and Acronyms
17. Disclaimer
List of Tables
TABLE 1 Global Integration Platform as a Service (IPaaS) Market Value (US$ Mn), 2012-2016
TABLE 2 Global Integration Platform as a Service (IPaaS) Market Value (US$ Mn), 2017-2022
TABLE 3 Global Integration Platform as a Service (IPaaS) Market Value (US$ Mn) and Y-o-Y, 2015-2022
TABLE 4 Global Software Platform Segment Value (US$ Mn), By Region 2012-2016
TABLE 5 Global Software Platform Segment Value (US$ Mn), By Region 2017-2022
TABLE 6 Global Software Platform Segment Market Share, By Region 2012-2016
TABLE 7 Global Software Platform Segment Market Share, By Region 2017-2022
TABLE 8 Global Software Platform Segment Y-o-Y, By Region 2015-2022
TABLE 9 Global Services Segment Value (US$ Mn), By Region 2012-2016
TABLE 10 Global Services Segment Value (US$ Mn), By Region 2017-2022
TABLE 11 Global Services Segment Market Share, By Region 2012-2016
TABLE 12 Global Services Segment Market Share, By Region 2017-2022
TABLE 13 Global Services Segment Y-o-Y, By Region 2015-2022
TABLE 14 Global Large Enterprise Segment Value (US$ Mn), By Region 2012-2016
TABLE 15 Global Large Enterprise Segment Value (US$ Mn), By Region 2017-2022
TABLE 16 Global Large Enterprise Segment Market Share, By Region 2012-2016
TABLE 17 Global Large Enterprise Segment Market Share, By Region 2017-2022
TABLE 18 Global Large Enterprise Segment Y-o-Y, By Region 2015-2022
TABLE 19 Global Small & Medium Enterprise Segment Value (US$ Mn), By Region 2012-2016
TABLE 20 Global Small & Medium Enterprise Segment Value (US$ Mn), By Region 2017-2022
TABLE 21 Global Small & Medium Enterprise Segment Market Share, By Region 2012-2016
TABLE 22 Global Small & Medium Enterprise Segment Market Share, By Region 2017-2022
TABLE 23 Global Small & Medium Enterprise Segment Y-o-Y, By Region 2015-2022
TABLE 24 Global BFSI Segment Value (US$ Mn), By Region 2012-2016
TABLE 25 Global BFSI Segment Value (US$ Mn), By Region 2017-2022
TABLE 26 Global BFSI Segment Market Share, By Region 2012-2016
TABLE 27 Global BFSI Segment Market Share, By Region 2017-2022
TABLE 28 Global BFSI Segment Y-o-Y, By Region 2015-2022
TABLE 29 Global IT & Telecom Segment Value (US$ Mn), By Region 2012-2016
TABLE 30 Global IT & Telecom Segment Value (US$ Mn), By Region 2017-2022
TABLE 31 Global IT & Telecom Segment Market Share, By Region 2012-2016
TABLE 32 Global IT & Telecom Segment Market Share, By Region 2017-2022
TABLE 33 Global IT & Telecom Segment Y-o-Y, By Region 2015-2022
TABLE 34 Global Healthcare Segment Value (US$ Mn), By Region 2012-2016
TABLE 35 Global Healthcare Segment Value (US$ Mn), By Region 2017-2022
TABLE 36 Global Healthcare Segment Market Share, By Region 2012-2016
TABLE 37 Global Healthcare Segment Market Share, By Region 2017-2022
TABLE 38 Global Healthcare Segment Y-o-Y, By Region 2015-2022
TABLE 39 Global Government Segment Value (US$ Mn), By Region 2012-2016
TABLE 40 Global Government Segment Value (US$ Mn), By Region 2017-2022
TABLE 41 Global Government Segment Market Share, By Region 2012-2016
TABLE 42 Global Government Segment Market Share, By Region 2017-2022
TABLE 43 Global Government Segment Y-o-Y, By Region 2015-2022
TABLE 44 Global Education Segment Value (US$ Mn), By Region 2012-2016
TABLE 45 Global Education Segment Value (US$ Mn), By Region 2017-2022
TABLE 46 Global Education Segment Market Share, By Region 2012-2016
TABLE 47 Global Education Segment Market Share, By Region 2017-2022
TABLE 48 Global Education Segment Y-o-Y, By Region 2015-2022
TABLE 49 Global Others Segment Value (US$ Mn), By Region 2012-2016
TABLE 50 Global Others Segment Value (US$ Mn), By Region 2017-2022
TABLE 51 Global Others Segment Market Share, By Region 2012-2016
TABLE 52 Global Others Segment Market Share, By Region 2017-2022
TABLE 53 Global Others Segment Y-o-Y, By Region 2015-2022
TABLE 54 North America Integration Platform as a Service (IPaaS) Market Value (US$ Mn), By Component 2012-2016
TABLE 55 North America Integration Platform as a Service (IPaaS) Market Value (US$ Mn), By Component 2017-2022
TABLE 56 North America Integration Platform as a Service (IPaaS) Market Value (US$ Mn), By End User 2012-2016
TABLE 57 North America Integration Platform as a Service (IPaaS) Market Value (US$ Mn), By End User 2017-2022
TABLE 58 North America Integration Platform as a Service (IPaaS) Market Value (US$ Mn), By Industry 2012-2016
TABLE 59 North America Integration Platform as a Service (IPaaS) Market Value (US$ Mn), By Industry 2017-2022
TABLE 60 Latin America Integration Platform as a Service (IPaaS) Market Value (US$ Mn), By Component 2012-2016
TABLE 61 Latin America Integration Platform as a Service (IPaaS) Market Value (US$ Mn), By Component 2017-2022
TABLE 62 Latin America Integration Platform as a Service (IPaaS) Market Value (US$ Mn), By End User 2012-2016
TABLE 63 Latin America Integration Platform as a Service (IPaaS) Market Value (US$ Mn), By End User 2017-2022
TABLE 64 Latin America Integration Platform as a Service (IPaaS) Market Value (US$ Mn), By Industry 2012-2016
TABLE 65 Latin America Integration Platform as a Service (IPaaS) Market Value (US$ Mn), By Industry 2017-2022
TABLE 66 Europe Integration Platform as a Service (IPaaS) Market Value (US$ Mn), By Component 2012-2016
TABLE 67 Europe Integration Platform as a Service (IPaaS) Market Value (US$ Mn), By Component 2017-2022
TABLE 68 Europe Integration Platform as a Service (IPaaS) Market Value (US$ Mn), By End User 2012-2016
TABLE 69 Europe Integration Platform as a Service (IPaaS) Market Value (US$ Mn), By End User 2017-2022
TABLE 70 Europe Integration Platform as a Service (IPaaS) Market Value (US$ Mn), By Industry 2012-2016
TABLE 71 Europe Integration Platform as a Service (IPaaS) Market Value (US$ Mn), By Industry 2017-2022
TABLE 72 Japan Integration Platform as a Service (IPaaS) Market Value (US$ Mn), By Component 2012-2016
TABLE 73 Japan Integration Platform as a Service (IPaaS) Market Value (US$ Mn), By Component 2017-2022
TABLE 74 Japan Integration Platform as a Service (IPaaS) Market Value (US$ Mn), By End User 2012-2016
TABLE 75 Japan Integration Platform as a Service (IPaaS) Market Value (US$ Mn), By End User 2017-2022
TABLE 76 Japan Integration Platform as a Service (IPaaS) Market Value (US$ Mn), By Industry 2012-2016
TABLE 77 Japan Integration Platform as a Service (IPaaS) Market Value (US$ Mn), By Industry 2017-2022
TABLE 78 APEJ Integration Platform as a Service (IPaaS) Market Value (US$ Mn), By Component 2012-2016
TABLE 79 APEJ Integration Platform as a Service (IPaaS) Market Value (US$ Mn), By Component 2017-2022
TABLE 80 APEJ Integration Platform as a Service (IPaaS) Market Value (US$ Mn), By End User 2012-2016
TABLE 81 APEJ Integration Platform as a Service (IPaaS) Market Value (US$ Mn), By End User 2017-2022
TABLE 82 APEJ Integration Platform as a Service (IPaaS) Market Value (US$ Mn), By Industry 2012-2016
TABLE 83 APEJ Integration Platform as a Service (IPaaS) Market Value (US$ Mn), By Industry 2017-2022
TABLE 84 MEA Integration Platform as a Service (IPaaS) Market Value (US$ Mn), By Component 2012-2016
TABLE 85 MEA Integration Platform as a Service (IPaaS) Market Value (US$ Mn), By Component 2017-2022
TABLE 86 MEA Integration Platform as a Service (IPaaS) Market Value (US$ Mn), By End User 2012-2016
TABLE 87 MEA Integration Platform as a Service (IPaaS) Market Value (US$ Mn), By End User 2017-2022
TABLE 88 MEA Integration Platform as a Service (IPaaS) Market Value (US$ Mn), By Industry 2012-2016
TABLE 89 MEA Integration Platform as a Service (IPaaS) Market Value (US$ Mn), By Industry 2017-2022
TABLE 90 US Integration Platform as a Service (IPaaS) Market Value (US$ Mn), By Component 2012-2016
TABLE 91 US Integration Platform as a Service (IPaaS) Market Value (US$ Mn), By Component 2017-2022
TABLE 92 US Integration Platform as a Service (IPaaS) Market Value (US$ Mn), By End User 2012-2016
TABLE 93 US Integration Platform as a Service (IPaaS) Market Value (US$ Mn), By End User 2017-2022
TABLE 94 US Integration Platform as a Service (IPaaS) Market Value (US$ Mn), By Industry 2012-2016
TABLE 95 US Integration Platform as a Service (IPaaS) Market Value (US$ Mn), By Industry 2017-2022
TABLE 96 Canada Integration Platform as a Service (IPaaS) Market Value (US$ Mn), By Component 2012-2016
TABLE 97 Canada Integration Platform as a Service (IPaaS) Market Value (US$ Mn), By Component 2017-2022
TABLE 98 Canada Integration Platform as a Service (IPaaS) Market Value (US$ Mn), By End User 2012-2016
TABLE 99 Canada Integration Platform as a Service (IPaaS) Market Value (US$ Mn), By End User 2017-2022
TABLE 100 Canada Integration Platform as a Service (IPaaS) Market Value (US$ Mn), By Industry 2012-2016
TABLE 101 Canada Integration Platform as a Service (IPaaS) Market Value (US$ Mn), By Industry 2017-2022
TABLE 102 Brazil Integration Platform as a Service (IPaaS) Market Value (US$ Mn), By Component 2012-2016
TABLE 103 Brazil Integration Platform as a Service (IPaaS) Market Value (US$ Mn), By Component 2017-2022
TABLE 104 Brazil Integration Platform as a Service (IPaaS) Market Value (US$ Mn), By End User 2012-2016
TABLE 105 Brazil Integration Platform as a Service (IPaaS) Market Value (US$ Mn), By End User 2017-2022
TABLE 106 Brazil Integration Platform as a Service (IPaaS) Market Value (US$ Mn), By Industry 2012-2016
TABLE 107 Brazil Integration Platform as a Service (IPaaS) Market Value (US$ Mn), By Industry 2017-2022
TABLE 108 Mexico Integration Platform as a Service (IPaaS) Market Value (US$ Mn), By Component 2012-2016
TABLE 109 Mexico Integration Platform as a Service (IPaaS) Market Value (US$ Mn), By Component 2017-2022
TABLE 110 Mexico Integration Platform as a Service (IPaaS) Market Value (US$ Mn), By End User 2012-2016
TABLE 111 Mexico Integration Platform as a Service (IPaaS) Market Value (US$ Mn), By End User 2017-2022
TABLE 112 Mexico Integration Platform as a Service (IPaaS) Market Value (US$ Mn), By Industry 2012-2016
TABLE 113 Mexico Integration Platform as a Service (IPaaS) Market Value (US$ Mn), By Industry 2017-2022
TABLE 114 Argentina Integration Platform as a Service (IPaaS) Market Value (US$ Mn), By Component 2012-2016
TABLE 115 Argentina Integration Platform as a Service (IPaaS) Market Value (US$ Mn), By Component 2017-2022
TABLE 116 Argentina Integration Platform as a Service (IPaaS) Market Value (US$ Mn), By End User 2012-2016
TABLE 117 Argentina Integration Platform as a Service (IPaaS) Market Value (US$ Mn), By End User 2017-2022
TABLE 118 Argentina Integration Platform as a Service (IPaaS) Market Value (US$ Mn), By Industry 2012-2016
TABLE 119 Argentina Integration Platform as a Service (IPaaS) Market Value (US$ Mn), By Industry 2017-2022
TABLE 120 Germany Integration Platform as a Service (IPaaS) Market Value (US$ Mn), By Component 2012-2016
TABLE 121 Germany Integration Platform as a Service (IPaaS) Market Value (US$ Mn), By Component 2017-2022
TABLE 122 Germany Integration Platform as a Service (IPaaS) Market Value (US$ Mn), By End User 2012-2016
TABLE 123 Germany Integration Platform as a Service (IPaaS) Market Value (US$ Mn), By End User 2017-2022
TABLE 124 Germany Integration Platform as a Service (IPaaS) Market Value (US$ Mn), By Industry 2012-2016
TABLE 125 Germany Integration Platform as a Service (IPaaS) Market Value (US$ Mn), By Industry 2017-2022
TABLE 126 UK Integration Platform as a Service (IPaaS) Market Value (US$ Mn), By Component 2012-2016
TABLE 127 UK Integration Platform as a Service (IPaaS) Market Value (US$ Mn), By Component 2017-2022
TABLE 128 UK Integration Platform as a Service (IPaaS) Market Value (US$ Mn), By End User 2012-2016
TABLE 129 UK Integration Platform as a Service (IPaaS) Market Value (US$ Mn), By End User 2017-2022
TABLE 130 UK Integration Platform as a Service (IPaaS) Market Value (US$ Mn), By Industry 2012-2016
TABLE 131 UK Integration Platform as a Service (IPaaS) Market Value (US$ Mn), By Industry 2017-2022
TABLE 132 France Integration Platform as a Service (IPaaS) Market Value (US$ Mn), By Component 2012-2016
TABLE 133 France Integration Platform as a Service (IPaaS) Market Value (US$ Mn), By Component 2017-2022
TABLE 134 France Integration Platform as a Service (IPaaS) Market Value (US$ Mn), By End User 2012-2016
TABLE 135 France Integration Platform as a Service (IPaaS) Market Value (US$ Mn), By End User 2017-2022
TABLE 136 France Integration Platform as a Service (IPaaS) Market Value (US$ Mn), By Industry 2012-2016
TABLE 137 France Integration Platform as a Service (IPaaS) Market Value (US$ Mn), By Industry 2017-2022
TABLE 138 Spain Integration Platform as a Service (IPaaS) Market Value (US$ Mn), By Component 2012-2016
TABLE 139 Spain Integration Platform as a Service (IPaaS) Market Value (US$ Mn), By Component 2017-2022
TABLE 140 Spain Integration Platform as a Service (IPaaS) Market Value (US$ Mn), By End User 2012-2016
TABLE 141 Spain Integration Platform as a Service (IPaaS) Market Value (US$ Mn), By End User 2017-2022
TABLE 142 Spain Integration Platform as a Service (IPaaS) Market Value (US$ Mn), By Industry 2012-2016
TABLE 143 Spain Integration Platform as a Service (IPaaS) Market Value (US$ Mn), By Industry 2017-2022
TABLE 144 Italy Integration Platform as a Service (IPaaS) Market Value (US$ Mn), By Component 2012-2016
TABLE 145 Italy Integration Platform as a Service (IPaaS) Market Value (US$ Mn), By Component 2017-2022
TABLE 146 Italy Integration Platform as a Service (IPaaS) Market Value (US$ Mn), By End User 2012-2016
TABLE 147 Italy Integration Platform as a Service (IPaaS) Market Value (US$ Mn), By End User 2017-2022
TABLE 148 Italy Integration Platform as a Service (IPaaS) Market Value (US$ Mn), By Industry 2012-2016
TABLE 149 Italy Integration Platform as a Service (IPaaS) Market Value (US$ Mn), By Industry 2017-2022
TABLE 150 Nordic Integration Platform as a Service (IPaaS) Market Value (US$ Mn), By Component 2012-2016
TABLE 151 Nordic Integration Platform as a Service (IPaaS) Market Value (US$ Mn), By Component 2017-2022
TABLE 152 Nordic Integration Platform as a Service (IPaaS) Market Value (US$ Mn), By End User 2012-2016
TABLE 153 Nordic Integration Platform as a Service (IPaaS) Market Value (US$ Mn), By End User 2017-2022
TABLE 154 Nordic Integration Platform as a Service (IPaaS) Market Value (US$ Mn), By Industry 2012-2016
TABLE 155 Nordic Integration Platform as a Service (IPaaS) Market Value (US$ Mn), By Industry 2017-2022
TABLE 156 Japan Integration Platform as a Service (IPaaS) Market Value (US$ Mn), By Component 2012-2016
TABLE 157 Japan Integration Platform as a Service (IPaaS) Market Value (US$ Mn), By Component 2017-2022
TABLE 158 Japan Integration Platform as a Service (IPaaS) Market Value (US$ Mn), By End User 2012-2016
TABLE 159 Japan Integration Platform as a Service (IPaaS) Market Value (US$ Mn), By End User 2017-2022
TABLE 160 Japan Integration Platform as a Service (IPaaS) Market Value (US$ Mn), By Industry 2012-2016
TABLE 161 Japan Integration Platform as a Service (IPaaS) Market Value (US$ Mn), By Industry 2017-2022
TABLE 162 China Integration Platform as a Service (IPaaS) Market Value (US$ Mn), By Component 2012-2016
TABLE 163 China Integration Platform as a Service (IPaaS) Market Value (US$ Mn), By Component 2017-2022
TABLE 164 China Integration Platform as a Service (IPaaS) Market Value (US$ Mn), By End User 2012-2016
TABLE 165 China Integration Platform as a Service (IPaaS) Market Value (US$ Mn), By End User 2017-2022
TABLE 166 China Integration Platform as a Service (IPaaS) Market Value (US$ Mn), By Industry 2012-2016
TABLE 167 China Integration Platform as a Service (IPaaS) Market Value (US$ Mn), By Industry 2017-2022
TABLE 168 India Integration Platform as a Service (IPaaS) Market Value (US$ Mn), By Component 2012-2016
TABLE 169 India Integration Platform as a Service (IPaaS) Market Value (US$ Mn), By Component 2017-2022
TABLE 170 India Integration Platform as a Service (IPaaS) Market Value (US$ Mn), By End User 2012-2016
TABLE 171 India Integration Platform as a Service (IPaaS) Market Value (US$ Mn), By End User 2017-2022
TABLE 172 India Integration Platform as a Service (IPaaS) Market Value (US$ Mn), By Industry 2012-2016
TABLE 173 India Integration Platform as a Service (IPaaS) Market Value (US$ Mn), By Industry 2017-2022
TABLE 174 Malaysia Integration Platform as a Service (IPaaS) Market Value (US$ Mn), By Component 2012-2016
TABLE 175 Malaysia Integration Platform as a Service (IPaaS) Market Value (US$ Mn), By Component 2017-2022
TABLE 176 Malaysia Integration Platform as a Service (IPaaS) Market Value (US$ Mn), By End User 2012-2016
TABLE 177 Malaysia Integration Platform as a Service (IPaaS) Market Value (US$ Mn), By End User 2017-2022
TABLE 178 Malaysia Integration Platform as a Service (IPaaS) Market Value (US$ Mn), By Industry 2012-2016
TABLE 179 Malaysia Integration Platform as a Service (IPaaS) Market Value (US$ Mn), By Industry 2017-2022
TABLE 180 Thailand Integration Platform as a Service (IPaaS) Market Value (US$ Mn), By Component 2012-2016
TABLE 181 Thailand Integration Platform as a Service (IPaaS) Market Value (US$ Mn), By Component 2017-2022
TABLE 182 Thailand Integration Platform as a Service (IPaaS) Market Value (US$ Mn), By End User 2012-2016
TABLE 183 Thailand Integration Platform as a Service (IPaaS) Market Value (US$ Mn), By End User 2017-2022
TABLE 184 Thailand Integration Platform as a Service (IPaaS) Market Value (US$ Mn), By Industry 2012-2016
TABLE 185 Thailand Integration Platform as a Service (IPaaS) Market Value (US$ Mn), By Industry 2017-2022
TABLE 186 Singapore Integration Platform as a Service (IPaaS) Market Value (US$ Mn), By Component 2012-2016
TABLE 187 Singapore Integration Platform as a Service (IPaaS) Market Value (US$ Mn), By Component 2017-2022
TABLE 188 Singapore Integration Platform as a Service (IPaaS) Market Value (US$ Mn), By End User 2012-2016
TABLE 189 Singapore Integration Platform as a Service (IPaaS) Market Value (US$ Mn), By End User 2017-2022
TABLE 190 Singapore Integration Platform as a Service (IPaaS) Market Value (US$ Mn), By Industry 2012-2016
TABLE 191 Singapore Integration Platform as a Service (IPaaS) Market Value (US$ Mn), By Industry 2017-2022
TABLE 192 Australia Integration Platform as a Service (IPaaS) Market Value (US$ Mn), By Component 2012-2016
TABLE 193 Australia Integration Platform as a Service (IPaaS) Market Value (US$ Mn), By Component 2017-2022
TABLE 194 Australia Integration Platform as a Service (IPaaS) Market Value (US$ Mn), By End User 2012-2016
TABLE 195 Australia Integration Platform as a Service (IPaaS) Market Value (US$ Mn), By End User 2017-2022
TABLE 196 Australia Integration Platform as a Service (IPaaS) Market Value (US$ Mn), By Industry 2012-2016
TABLE 197 Australia Integration Platform as a Service (IPaaS) Market Value (US$ Mn), By Industry 2017-2022
TABLE 198 GCC Countries Integration Platform as a Service (IPaaS) Market Value (US$ Mn), By Component 2012-2016
TABLE 199 GCC Countries Integration Platform as a Service (IPaaS) Market Value (US$ Mn), By Component 2017-2022
TABLE 200 GCC Countries Integration Platform as a Service (IPaaS) Market Value (US$ Mn), By End User 2012-2016
TABLE 201 GCC Countries Integration Platform as a Service (IPaaS) Market Value (US$ Mn), By End User 2017-2022
TABLE 202 GCC Countries Integration Platform as a Service (IPaaS) Market Value (US$ Mn), By Industry 2012-2016
TABLE 203 GCC Countries Integration Platform as a Service (IPaaS) Market Value (US$ Mn), By Industry 2017-2022
TABLE 204 South Africa Integration Platform as a Service (IPaaS) Market Value (US$ Mn), By Component 2012-2016
TABLE 205 South Africa Integration Platform as a Service (IPaaS) Market Value (US$ Mn), By Component 2017-2022
TABLE 206 South Africa Integration Platform as a Service (IPaaS) Market Value (US$ Mn), By End User 2012-2016
TABLE 207 South Africa Integration Platform as a Service (IPaaS) Market Value (US$ Mn), By End User 2017-2022
TABLE 208 South Africa Integration Platform as a Service (IPaaS) Market Value (US$ Mn), By Industry 2012-2016
TABLE 209 South Africa Integration Platform as a Service (IPaaS) Market Value (US$ Mn), By Industry 2017-2022
TABLE 210 Nigeria Integration Platform as a Service (IPaaS) Market Value (US$ Mn), By Component 2012-2016
TABLE 211 Nigeria Integration Platform as a Service (IPaaS) Market Value (US$ Mn), By Component 2017-2022
TABLE 212 Nigeria Integration Platform as a Service (IPaaS) Market Value (US$ Mn), By End User 2012-2016
TABLE 213 Nigeria Integration Platform as a Service (IPaaS) Market Value (US$ Mn), By End User 2017-2022
TABLE 214 Nigeria Integration Platform as a Service (IPaaS) Market Value (US$ Mn), By Industry 2012-2016
TABLE 215 Nigeria Integration Platform as a Service (IPaaS) Market Value (US$ Mn), By Industry 2017-2022
TABLE 216 Israel Integration Platform as a Service (IPaaS) Market Value (US$ Mn), By Component 2012-2016
TABLE 217 Israel Integration Platform as a Service (IPaaS) Market Value (US$ Mn), By Component 2017-2022
TABLE 218 Israel Integration Platform as a Service (IPaaS) Market Value (US$ Mn), By End User 2012-2016
TABLE 219 Israel Integration Platform as a Service (IPaaS) Market Value (US$ Mn), By End User 2017-2022
TABLE 220 Israel Integration Platform as a Service (IPaaS) Market Value (US$ Mn), By Industry 2012-2016
TABLE 221 Israel Integration Platform as a Service (IPaaS) Market Value (US$ Mn), By Industry 2017-2022
List of Figures
FIG. 1 Global Integration Platform as a Service (IPaaS) Market Value (US$ Mn), 2012-2016
FIG. 2 Global Integration Platform as a Service (IPaaS) Market Value (US$ Mn) Forecast, 2017-2022
FIG. 3 Global Integration Platform as a Service (IPaaS) Market Value (US$ Mn) and Y-o-Y, 2015-2022
FIG. 4 Global Software Platform Segment Market Value (US$ Mn) By Region, 2012-2016
FIG. 5 Global Software Platform Segment Market Value (US$ Mn) By Region, 2017-2022
FIG. 6 Global Software Platform Segment Y-o-Y Growth Rate, By Region, 2015-2022
FIG. 7 Global Services Segment Market Value (US$ Mn) By Region, 2012-2016
FIG. 8 Global Services Segment Market Value (US$ Mn) By Region, 2017-2022
FIG. 9 Global Services Segment Y-o-Y Growth Rate, By Region, 2015-2022
FIG. 10 Global Large Enterprise Segment Market Value (US$ Mn) By Region, 2012-2016
FIG. 11 Global Large Enterprise Segment Market Value (US$ Mn) By Region, 2017-2022
FIG. 12 Global Large Enterprise Segment Y-o-Y Growth Rate, By Region, 2015-2022
FIG. 13 Global Small & Medium Enterprise Segment Market Value (US$ Mn) By Region, 2012-2016
FIG. 14 Global Small & Medium Enterprise Segment Market Value (US$ Mn) By Region, 2017-2022
FIG. 15 Global Small & Medium Enterprise Segment Y-o-Y Growth Rate, By Region, 2015-2022
FIG. 16 Global BFSI Segment Market Value (US$ Mn) By Region, 2012-2016
FIG. 17 Global BFSI Segment Market Value (US$ Mn) By Region, 2017-2022
FIG. 18 Global BFSI Segment Y-o-Y Growth Rate, By Region, 2015-2022
FIG. 19 Global IT & Telecom Segment Market Value (US$ Mn) By Region, 2012-2016
FIG. 20 Global IT & Telecom Segment Market Value (US$ Mn) By Region, 2017-2022
FIG. 21 Global IT & Telecom Segment Y-o-Y Growth Rate, By Region, 2015-2022
FIG. 22 Global Healthcare Segment Market Value (US$ Mn) By Region, 2012-2016
FIG. 23 Global Healthcare Segment Market Value (US$ Mn) By Region, 2017-2022
FIG. 24 Global Healthcare Segment Y-o-Y Growth Rate, By Region, 2015-2022
FIG. 25 Global Government Segment Market Value (US$ Mn) By Region, 2012-2016
FIG. 26 Global Government Segment Market Value (US$ Mn) By Region, 2017-2022
FIG. 27 Global Government Segment Y-o-Y Growth Rate, By Region, 2015-2022
FIG. 28 Global Education Segment Market Value (US$ Mn) By Region, 2012-2016
FIG. 29 Global Education Segment Market Value (US$ Mn) By Region, 2017-2022
FIG. 30 Global Education Segment Y-o-Y Growth Rate, By Region, 2015-2022
FIG. 31 Global Others Segment Market Value (US$ Mn) By Region, 2012-2016
FIG. 32 Global Others Segment Market Value (US$ Mn) By Region, 2017-2022
FIG. 33 Global Others Segment Y-o-Y Growth Rate, By Region, 2015-2022
FIG. 34 North America Integration Platform as a Service (IPaaS) Market Value (US$ Mn), By Component 2012-2016
FIG. 35 North America Integration Platform as a Service (IPaaS) Market Value (US$ Mn), By Component 2017-2022
FIG. 36 North America Integration Platform as a Service (IPaaS) Market Value (US$ Mn), By End User 2012-2016
FIG. 37 North America Integration Platform as a Service (IPaaS) Market Value (US$ Mn), By End User 2017-2022
FIG. 38 North America Integration Platform as a Service (IPaaS) Market Value (US$ Mn), By Industry 2012-2016
FIG. 39 North America Integration Platform as a Service (IPaaS) Market Value (US$ Mn), By Industry 2017-2022
FIG. 40 Latin America Integration Platform as a Service (IPaaS) Market Value (US$ Mn), By Component 2012-2016
FIG. 41 Latin America Integration Platform as a Service (IPaaS) Market Value (US$ Mn), By Component 2017-2022
FIG. 42 Latin America Integration Platform as a Service (IPaaS) Market Value (US$ Mn), By End User 2012-2016
FIG. 43 Latin America Integration Platform as a Service (IPaaS) Market Value (US$ Mn), By End User 2017-2022
FIG. 44 Latin America Integration Platform as a Service (IPaaS) Market Value (US$ Mn), By Industry 2012-2016
FIG. 45 Latin America Integration Platform as a Service (IPaaS) Market Value (US$ Mn), By Industry 2017-2022
FIG. 46 Europe Integration Platform as a Service (IPaaS) Market Value (US$ Mn), By Component 2012-2016
FIG. 47 Europe Integration Platform as a Service (IPaaS) Market Value (US$ Mn), By Component 2017-2022
FIG. 48 Europe Integration Platform as a Service (IPaaS) Market Value (US$ Mn), By End User 2012-2016
FIG. 49 Europe Integration Platform as a Service (IPaaS) Market Value (US$ Mn), By End User 2017-2022
FIG. 50 Europe Integration Platform as a Service (IPaaS) Market Value (US$ Mn), By Industry 2012-2016
FIG. 51 Europe Integration Platform as a Service (IPaaS) Market Value (US$ Mn), By Industry 2017-2022
FIG. 52 Japan Integration Platform as a Service (IPaaS) Market Value (US$ Mn), By Component 2012-2016
FIG. 53 Japan Integration Platform as a Service (IPaaS) Market Value (US$ Mn), By Component 2017-2022
FIG. 54 Japan Integration Platform as a Service (IPaaS) Market Value (US$ Mn), By End User 2012-2016
FIG. 55 Japan Integration Platform as a Service (IPaaS) Market Value (US$ Mn), By End User 2017-2022
FIG. 56 Japan Integration Platform as a Service (IPaaS) Market Value (US$ Mn), By Industry 2012-2016
FIG. 57 Japan Integration Platform as a Service (IPaaS) Market Value (US$ Mn), By Industry 2017-2022
FIG. 58 APEJ Integration Platform as a Service (IPaaS) Market Value (US$ Mn), By Component 2012-2016
FIG. 59 APEJ Integration Platform as a Service (IPaaS) Market Value (US$ Mn), By Component 2017-2022
FIG. 60 APEJ Integration Platform as a Service (IPaaS) Market Value (US$ Mn), By End User 2012-2016
FIG. 61 APEJ Integration Platform as a Service (IPaaS) Market Value (US$ Mn), By End User 2017-2022
FIG. 62 APEJ Integration Platform as a Service (IPaaS) Market Value (US$ Mn), By Industry 2012-2016
FIG. 63 APEJ Integration Platform as a Service (IPaaS) Market Value (US$ Mn), By Industry 2017-2022
FIG. 64 MEA Integration Platform as a Service (IPaaS) Market Value (US$ Mn), By Component 2012-2016
FIG. 65 MEA Integration Platform as a Service (IPaaS) Market Value (US$ Mn), By Component 2017-2022
FIG. 66 MEA Integration Platform as a Service (IPaaS) Market Value (US$ Mn), By End User 2012-2016
FIG. 67 MEA Integration Platform as a Service (IPaaS) Market Value (US$ Mn), By End User 2017-2022
FIG. 68 MEA Integration Platform as a Service (IPaaS) Market Value (US$ Mn), By Industry 2012-2016
FIG. 69 MEA Integration Platform as a Service (IPaaS) Market Value (US$ Mn), By Industry 2017-2022
Copyright © Transparency Market Research, Inc. All Rights reserved
Trust Online


Integration Platform as a Service (iPaaS) Market