
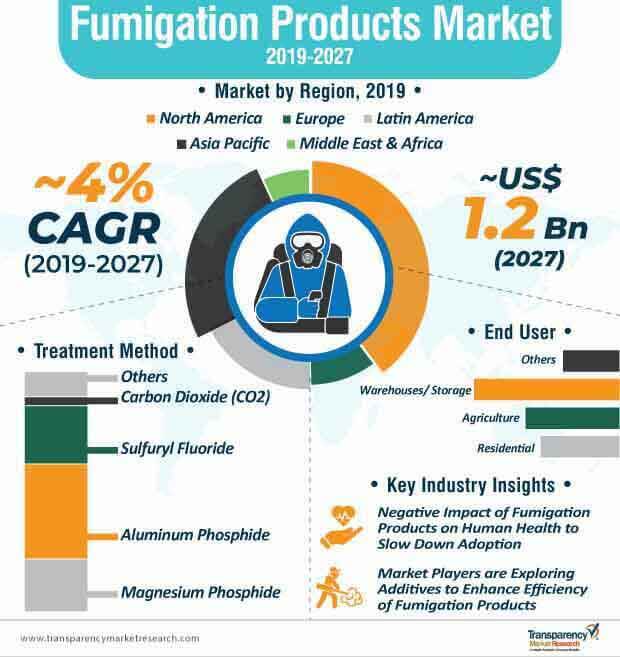
Volume sales in the fumigation products market were recorded at ~662 thousand tons in 2018, and the uptake in their demand in residential, agricultural, and storage applications is estimated to drive sales worth ~1.17 million tons by 2027.
Also, prior to the transportation of agricultural products, there is high demand for fumigants in warehouses. A hawk-eye on hygienic and infection-free food products in the food & beverage industry has passed the stress onto the agricultural sector to ensure the quality of raw materials, which has substantially led to the rise in the fumigation practice.
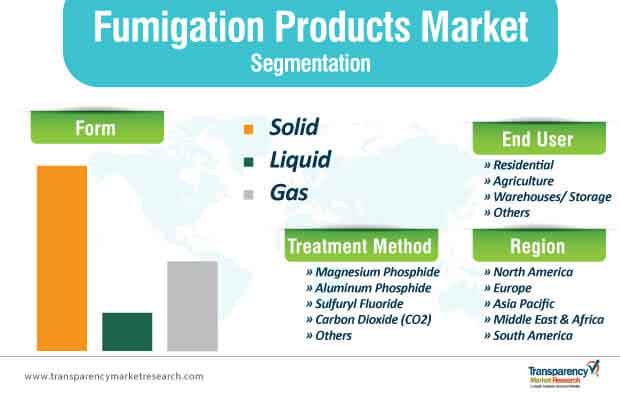
Analyzing the future scope of demand, players in the fumigation products market are seen outperforming their competitors on the basis of 'convenience'. The availability of fumigation products in various forms - solid, liquid, and gaseous - offers ease of use to end users, which has been a driving force for sales in the fumigation products market.
Get an idea about the offerings of our report from Report Brochure
The very nature of fumigants is volatile and toxic. Despite this, several companies in the fumigation products market claim to have produced fumigation products that are poisonous to only insects and not humans. Such false claims lead to the reckless use of fumigants, which affects the health of pest control service providers. Incidences related to the ill-effects of these products on human health have been coming to light, which has been limiting the true sales potential of the fumigation products market.
Also, regular exposure to fumigants for a prolonged period of time could cause acute and chronic disorders in humans, which has instigated the shift of pest control service providers towards natural and less hazardous disinfectants such as fungicides, insecticides, and herbicides. Manufacturers of these harmless products further attract sales by offering cost benefits to end users, which is projected to upkeep a medium-to-high level of threat of substitutes in the fumigation products market.
To gauge the scope of customization in our reports Ask for a Sample
In 2019, North America is projected to account for sales of ~264 thousand tons worth of fumigation products, and likely to record a volume CAGR of ~3% during 2019-2027. A significant part of this growth is attributable to the presence of stringent government regulations in the U.S. and Canada, which ensures that only quality products penetrate the fumigation products market. In addition, a significant number of warehouses in the region, used for the storage of agricultural products, are likely to upkeep the demand for fumigants during the forecast period.
It is worth noting that, the growth of the Asia Pacific fumigation products market is evincing an exponential trajectory, on account of the urban sprawl, which is generating demand for pest control from warehouses as well as residential areas.
Since the technology used for the development of fumigation products is relatively expensive, North America is home to a substantial number of fumigation product market players, while Asia Pacific is seen as a cash cow for investment. Given the number of consolidation opportunities, the overall degree of competition in the fumigation products market will be high during the forecast period.
Looking for Regional Analysis or Competitive Landscape in Fumigation Products Market ?ask for a customized report
Analysts’ Viewpoint
Authors of the report opine that, the fumigation product market will register a sluggish CAGR of ~4% during the forecast period of 2019-2027. Since sound technical knowledge is a must to survive in this fragmented landscape, new entrants face difficulties investing high upfront working capital into the business, which is likely to create an entry barrier in the fumigation products market. Well-established market players tend to set up efficient and organized transportation systems to ensure the delivery of their products in the stipulated time.
Though available in abundance, the prices of raw material such as ammonia, aluminum, yellow phosphorus, and magnesium are volatile in nature. Hence, players in the fumigation products market can enter into long-term partnerships with suppliers to avoid fluctuations in raw material prices.
Fumigation Products: Description
What are the Key Growth Drivers of the Global Fumigation Products Market?
What are the Major Challenges for the Global Fumigation Products Market?
Lucrative Opportunities for Global Fumigation Products Market
North America to Dominate Global Fumigation Products Market
Asia Pacific to Offer Growth Opportunities
Leading Players Actively Engage in Mergers & Acquisitions
Key players operating in the global fumigation products market include
These companies are engaged in expansions, mergers & acquisitions, and joint ventures in order to increase their share of the global fumigation products market.
Global Fumigation Products Market – Segmentation
TMR’s research study assesses the global fumigation products market on the basis of form, treatment method, end user, and region. This report presents extensive market dynamics and progressive trends associated with different segments, and how they are influencing the growth prospects of the global fumigation products market.
|
Form |
Solid Liquid Gas |
|
Treatment Method |
Magnesium Phosphide Aluminum Phosphide Sulfuryl Fluoride Carbon Dioxide (CO2) Others |
|
End User |
Residential Agriculture Warehouses/ Storage Others |
|
Region |
North America Latin America Europe Asia Pacific Middle East & Africa |
1. Preface
1.1. Report Scope and Market Segmentation
1.2. Research Highlights
2. Assumptions and Research Methodology
2.1. Assumptions and Acronyms Used
2.2. Research Methodology
3. Executive Summary: Global Fumigation Products Market
3.1. Market Value, Indicative (US$ Thousand)
3.2. Top Three Trends
4. Market Overview
4.1. Product Overview
4.2. Key Market Developments
4.3. Market Indicators
5. Market Dynamics
5.1. Drivers and Restraints Snapshot Analysis
5.1.1. Drivers
5.1.2. Restraints
5.1.3. Opportunities
5.2. Porter’s Five Forces Analysis
5.2.1. Threat of Substitutes
5.2.2. Bargaining Power of Buyers
5.2.3. Bargaining Power of Suppliers
5.2.4. Threat of New Entrants
5.2.5. Degree of Competition
5.3. Value Chain Analysis
5.4. List of Potential Customers
6. Global Fumigation Products Market: Price Trend Analysis, 2018
6.1. Fumigation Products Price Trend, by Treatment Method (US$/ton), 2018
6.2. Fumigation Products Price Trend, by Region (US$/ton), 2018
7. Global Fumigation Products Production Output, by Region, 2018
8. Global Fumigation Products Market Volume (Tons) and Value (US$ Thousand) Analysis, by Form
8.1. Key Findings and Introduction
8.2. Global Fumigation Products Market Volume (Tons) and Value (US$ Thousand) Forecast, by Form, 2018–2027
8.2.1. Global Fumigation Products Market Volume (Tons) and Value (US$ Thousand) Forecast, by Solid, 2018–2027
8.2.2. Global Fumigation Products Market Volume (Tons) and Value (US$ Thousand) Forecast, by Liquid, 2018–2027
8.2.3. Global Fumigation Products Market Volume (Tons) and Value (US$ Thousand) Forecast, by Gas, 2018–2027
8.3. Global Fumigation Products Market Attractiveness Analysis, by Form
9. Global Fumigation Products Market Volume (Tons) and Value (US$ Thousand) Analysis, by Treatment Method
9.1. Key Findings and Introduction
9.2. Global Fumigation Products Market Volume (Tons) and Value (US$ Thousand) Forecast, by Treatment Method, 2018–2027
9.2.1. Global Fumigation Products Market Volume (Tons) and Value (US$ Thousand) Forecast, by Magnesium Phosphide, 2018–2027
9.2.2. Global Fumigation Products Market Volume (Tons) and Value (US$ Thousand) Forecast, by Aluminum Phosphide, 2018–2027
9.2.3. Global Fumigation Products Market Volume (Tons) and Value (US$ Thousand) Forecast, by Sulfuryl Fluoride, 2018–2027
9.2.4. Global Fumigation Products Market Volume (Tons) and Value (US$ Thousand) Forecast, by Carbon Dioxide (CO2), 2018–2027
9.2.5. Global Fumigation Products Market Volume (Tons) and Value (US$ Thousand) Forecast, by Others, 2018–2027
9.3. Global Fumigation Products Market Attractiveness Analysis, by Treatment Method
10. Global Fumigation Products Market Volume (Tons) and Value (US$ Thousand) Analysis, by End-user
10.1. Key Findings and Introduction
10.2. Global Fumigation Products Market Volume (Tons) and Value (US$ Thousand) Forecast, by End-user, 2018–2027
10.2.1. Global Fumigation Products Market Volume (Tons) and Value (US$ Thousand) Forecast, by Residential, 2018–2027
10.2.2. Global Fumigation Products Market Volume (Tons) and Value (US$ Thousand) Forecast, by Agriculture, 2018–2027
10.2.3. Global Fumigation Products Market Volume (Tons) and Value (US$ Thousand) Forecast, by Warehouse / Storage, 2018–2027
10.2.4. Global Fumigation Products Market Volume (Tons) and Value (US$ Thousand) Forecast, by Others, 2018–2027
10.3. Global Fumigation Products Market Attractiveness Analysis, by End-user
11. Global Fumigation Products Market Analysis, by Region
11.1. Global Regulatory Scenario
11.2. Global Fumigation Products Market Volume (Tons) and Value (US$ Thousand) Forecast, by Region
11.2.1. North America
11.2.2. Europe
11.2.3. Asia Pacific
11.2.4. Latin America
11.2.5. Middle East & Africa
11.3. Global Fumigation Products Market Attractiveness Analysis, by Region
12. North America Fumigation Products Market Overview
12.1. Key Findings
12.2. North America Fumigation Products Market Volume (Tons) and Value (US$ Thousand) Forecast, by Form, 2018–2027
12.3. North America Fumigation Products Market Volume (Tons) and Value (US$ Thousand) Forecast, by End-user, 2018–2027
12.4. North America Fumigation Products Market Volume (Tons) and Value (US$ Thousand) Forecast, by Country
12.4.1. U.S. Fumigation Products Market Volume (Tons) and Value (US$ Thousand) Forecast, by Form, 2018–2027
12.4.2. U.S. Fumigation Products Market Volume (Tons) and Value (US$ Thousand) Forecast, by Treatment Method, 2018–2027
12.4.3. U.S. Fumigation Products Market Volume (Tons) and Value (US$ Thousand) Forecast, by End-user, 2018–2027
12.4.4. Canada Fumigation Products Market Volume (Tons) and Value (US$ Thousand) Forecast, by Form, 2018–2027
12.4.5. Canada Fumigation Products Market Volume (Tons) and Value (US$ Thousand) Forecast, by Treatment Method, 2018–2027
12.4.6. Canada Fumigation Products Market Volume (Tons) and Value (US$ Thousand) Forecast, by End-user, 2018–2027
12.5. North America Fumigation Products Market Attractiveness Analysis, by Form
12.6. North America Fumigation Products Market Attractiveness Analysis, by Treatment Method
12.7. North America Fumigation Products Market Attractiveness Analysis, by End-user
13. Europe Fumigation Products Market Overview
13.1. Key Findings
13.2. Europe Fumigation Products Market Volume (Tons) and Value (US$ Thousand) Forecast, by Form, 2018–2027
13.3. Europe Fumigation Products Market Volume (Tons) and Value (US$ Thousand) Forecast, by Treatment Method, 2018–2027
13.4. Europe Fumigation Products Market Volume (Tons) and Value (US$ Thousand) Forecast, by End-user, 2018–2027
13.5. Europe Fumigation Products Market Value (US$ Thousand) and Volume (Tons) Forecast, by Country and Sub-region
13.5.1. Germany Fumigation Products Market Volume (Tons) and Value (US$ Thousand) Forecast, by Form, 2018–2027
13.5.2. Germany Fumigation Products Market Volume (Tons) and Value (US$ Thousand) Forecast, by Treatment Method, 2018–2027
13.5.3. Germany Fumigation Products Market Volume (Tons) and Value (US$ Thousand) Forecast, by End-user, 2018–2027
13.5.4. France Fumigation Products Market Volume (Tons) and Value (US$ Thousand) Forecast, by Form, 2018–2027
13.5.5. France Fumigation Products Market Volume (Tons) and Value (US$ Thousand) Forecast, by Treatment Method, 2018–2027
13.5.6. France Fumigation Products Market Volume (Tons) and Value (US$ Thousand) Forecast, by End-user, 2018–2027
13.5.7. U.K. Fumigation Products Market Volume (Tons) and Value (US$ Thousand) Forecast, by Form, 2018–2027
13.5.8. U.K. Fumigation Products Market Volume (Tons) and Value (US$ Thousand) Forecast, by Treatment Method, 2018–2027
13.5.9. U.K. Fumigation Products Market Volume (Tons) and Value (US$ Thousand) Forecast, by End-user, 2018–2027
13.5.10. Italy Fumigation Products Market Volume (Tons) and Value (US$ Thousand) Forecast, by Form, 2018–2027
13.5.11. Italy Fumigation Products Market Volume (Tons) and Value (US$ Thousand) Forecast, by Treatment Method, 2018–2027
13.5.12. Italy Fumigation Products Market Volume (Tons) and Value (US$ Thousand) Forecast, by End-user, 2018–2027
13.5.13. Spain Fumigation Products Market Volume (Tons) and Value (US$ Thousand) Forecast, by Form, 2018–2027
13.5.14. Spain Fumigation Products Market Volume (Tons) and Value (US$ Thousand) Forecast, by Treatment Method, 2018–2027
13.5.15. Spain Fumigation Products Market Volume (Tons) and Value (US$ Thousand) Forecast, by End-user, 2018–2027
13.5.16. Russia & CIS Fumigation Products Market Volume (Tons) and Value (US$ Thousand) Forecast, by Form, 2018–2027
13.5.17. Russia & CIS Fumigation Products Market Volume (Tons) and Value (US$ Thousand) Forecast, by Treatment Method, 2018–2027
13.5.18. Russia & CIS Fumigation Products Market Volume (Tons) and Value (US$ Thousand) Forecast, by End-user, 2018–2027
13.5.19. Rest of Europe Fumigation Products Market Volume (Tons) and Value (US$ Thousand) Forecast, by Form, 2018–2027
13.5.20. Rest of Europe Fumigation Products Market Volume (Tons) and Value (US$ Thousand) Forecast, by Treatment Method, 2018–2027
13.5.21. Rest of Europe Fumigation Products Market Volume (Tons) and Value (US$ Thousand) Forecast, by End-user, 2018–2027
13.6. Europe Fumigation Products Market Attractiveness Analysis, by Form
13.7. Europe Fumigation Products Market Attractiveness Analysis, by Treatment Method
13.8. Europe Fumigation Products Market Attractiveness Analysis, by End-user
14. Asia Pacific Fumigation Products Market Overview
14.1. Key Findings
14.2. Asia Pacific Fumigation Products Market Volume (Tons) and Value (US$ Thousand) Forecast, by Form, 2018–2027
14.3. Asia Pacific Fumigation Products Market Volume (Tons) and Value (US$ Thousand) Forecast, by Treatment Method, 2018–2027
14.4. Asia Pacific Fumigation Products Market Volume (Tons) and Value (US$ Thousand) Forecast, by End-user, 2018–2027
14.5. Asia Pacific Fumigation Products Market Volume (Tons) and Value (US$ Thousand) Forecast, by Country and Sub-region
14.5.1. China Fumigation Products Market Volume (Tons) and Value (US$ Thousand) Forecast, by Form, 2018–2027
14.5.2. China Fumigation Products Market Volume (Tons) and Value (US$ Thousand) Forecast, by Treatment Method, 2018–2027
14.5.3. China Fumigation Products Market Volume (Tons) and Value (US$ Thousand) Forecast, by End-user, 2018–2027
14.5.4. India Fumigation Products Market Volume (Tons) and Value (US$ Thousand) Forecast, by Form, 2018–2027
14.5.5. India Fumigation Products Market Volume (Tons) and Value (US$ Thousand) Forecast, by Treatment Method, 2018–2027
14.5.6. India Fumigation Products Market Volume (Tons) and Value (US$ Thousand) Forecast, by End-user, 2018–2027
14.5.7. Japan Fumigation Products Market Volume (Tons) and Value (US$ Thousand) Forecast, by Form, 2018–2027
14.5.8. Japan Fumigation Products Market Volume (Tons) and Value (US$ Thousand) Forecast, by Treatment Method, 2018–2027
14.5.9. Japan Fumigation Products Market Volume (Tons) and Value (US$ Thousand) Forecast, by End-user, 2018–2027
14.5.10. ASEAN Fumigation Products Market Volume (Tons) and Value (US$ Thousand) Forecast, by Form, 2018–2027
14.5.11. ASEAN Fumigation Products Market Volume (Tons) and Value (US$ Thousand) Forecast, by Treatment Method, 2018–2027
14.5.12. ASEAN Fumigation Products Market Volume (Tons) and Value (US$ Thousand) Forecast, by End-user, 2018–2027
14.5.13. Rest of Asia Pacific Fumigation Products Market Volume (Tons) and Value (US$ Thousand) Forecast, by Form, 2018–2027
14.5.14. Rest of Asia Pacific Fumigation Products Market Volume (Tons) and Value (US$ Thousand) Forecast, by Treatment Method, 2018–2027
14.5.15. Rest of Asia Pacific Fumigation Products Market Volume (Tons) and Value (US$ Thousand) Forecast, by End-user, 2018–2027
14.6. Asia Pacific Fumigation Products Market Attractiveness Analysis, by Form
14.7. Asia Pacific Fumigation Products Market Attractiveness Analysis, by Treatment Method
14.8. Asia Pacific Fumigation Products Market Attractiveness Analysis, by End-user
15. Latin America Fumigation Products Market Overview
15.1. Key Findings
15.2. Latin America Fumigation Products Market Volume (Tons) and Value (US$ Thousand) Forecast, by Form, 2018–2027
15.3. Latin America Fumigation Products Market Volume (Tons) and Value (US$ Thousand) Forecast, by Treatment Method, 2018–2027
15.4. Latin America Fumigation Products Market Volume (Tons) and Value (US$ Thousand) Forecast, by End-user, 2018–2027
15.5. Latin America Fumigation Products Market Volume (Tons) and Value (US$ Thousand) Forecast, by Country and Sub-region
15.5.1. Brazil Fumigation Products Market Volume (Tons) and Value (US$ Thousand) Forecast, by Form, 2018–2027
15.5.2. Brazil Fumigation Products Market Volume (Tons) and Value (US$ Thousand) Forecast, by Treatment Method, 2018–2027
15.5.3. Brazil Fumigation Products Market Volume (Tons) and Value (US$ Thousand) Forecast, by End-user, 2018–2027
15.5.4. Mexico Fumigation Products Market Volume (Tons) and Value (US$ Thousand) Forecast, by Form, 2018–2027
15.5.5. Mexico Fumigation Products Market Volume (Tons) and Value (US$ Thousand) Forecast, by Treatment Method, 2018–2027
15.5.6. Mexico Fumigation Products Market Volume (Tons) and Value (US$ Thousand) Forecast, by End-user, 2018–2027
15.5.7. Rest of Latin America Fumigation Products Market Volume (Tons) and Value (US$ Thousand) Forecast, by Form, 2018–2027
15.5.8. Rest of Latin America Fumigation Products Market Volume (Tons) and Value (US$ Thousand) Forecast, by Treatment Method, 2018–2027
15.5.9. Rest of Latin America Fumigation Products Market Volume (Tons) and Value (US$ Thousand) Forecast, by End-user, 2018–2027
15.6. Latin America Fumigation Products Market Attractiveness Analysis, by Form
15.7. Latin America Fumigation Products Market Attractiveness Analysis, by Treatment Method
15.8. Latin America Fumigation Products Market Attractiveness Analysis, by End-user
16. Middle East & Africa Fumigation Products Market Overview
16.1. Key Findings
16.2. Middle East & Africa Fumigation Products Market Volume (Tons) and Value (US$ Thousand) Forecast, by Form, 2018–2027
16.3. Middle East & Africa Fumigation Products Market Volume (Tons) and Value (US$ Thousand) Forecast, by Treatment Method, 2018–2027
16.4. Middle East & Africa Fumigation Products Market Volume (Tons) and Value (US$ Thousand) Forecast, by End-user, 2018–2027
16.5. Middle East & Africa Fumigation Products Market Volume (Tons) and Value (US$ Thousand) Forecast, by Country and Sub-region
16.5.1. GCC Fumigation Products Market Volume (Tons) and Value (US$ Thousand) Forecast, by Form, 2018–2027
16.5.2. GCC Fumigation Products Market Volume (Tons) and Value (US$ Thousand) Forecast, by Treatment Method, 2018–2027
16.5.3. GCC Fumigation Products Market Volume (Tons) and Value (US$ Thousand) Forecast, by End-user, 2018–2027
16.5.4. South Africa Fumigation Products Market Volume (Tons) and Value (US$ Thousand) Forecast, by Form, 2018–2027
16.5.5. South Africa Fumigation Products Market Volume (Tons) and Value (US$ Thousand) Forecast, by Treatment Method, 2018–2027
16.5.6. South Africa Fumigation Products Market Volume (Tons) and Value (US$ Thousand) Forecast, by End-user, 2018–2027
16.5.7. Rest of Middle East & Africa Fumigation Products Market Volume (Tons) and Value (US$ Thousand) Forecast, by Form, 2018–2027
16.5.8. Rest of Middle East & Africa Fumigation Products Market Volume (Tons) and Value (US$ Thousand) Forecast, by Treatment Method, 2018–2027
16.5.9. Rest of Middle East & Africa Fumigation Products Market Volume (Tons) and Value (US$ Thousand) Forecast, by End-user, 2018–2027
16.6. Middle East & Africa Fumigation Products Market Attractiveness Analysis, by Form
16.7. Middle East & Africa Fumigation Products Market Attractiveness Analysis, by Treatment Method
16.8. Middle East & Africa Fumigation Products Market Attractiveness Analysis, by End-user
17. Competition Landscape
17.1. Global Fumigation Products Market Share Analysis, by Company (2018)
17.2. Competition Matrix
17.2.1. Detia Degesch GmbH
17.2.2. AMVAC Chemical Corporation
17.3. Company Profiles
17.3.1. Rentokil Initial plc.
17.3.1.1. Company Description
17.3.1.2. Business Overview
17.3.1.3. Financial Details
17.3.1.4. Business Strategy
17.3.1.5. Product Portfolio
17.3.1.6. Key Developments
17.3.2. Solvay S.A.
17.3.2.1. Company Description
17.3.2.2. Business Overview
17.3.2.3. Financial Details
17.3.2.4. Business Strategy
17.3.2.5. Product Portfolio
17.3.3. Detia Degesch GmbH
17.3.3.1. Company Description
17.3.3.2. Business Overview
17.3.3.3. Product Portfolio
17.3.4. Industrial Fumigant Company LLC
17.3.4.1. Company Description
17.3.4.2. Business Overview
17.3.4.3. Product Portfolio
17.3.5. UPI-USA
17.3.5.1. Company Description
17.3.5.2. Business Overview
17.3.5.3. Product Portfolio
17.3.6. National Fumigants
17.3.6.1. Company Description
17.3.6.2. Business Overview
17.3.6.3. Product Portfolio
17.3.7. Corteva Agriscience
17.3.7.1. Company Description
17.3.7.2. Business Overview
17.3.7.3. Product Portfolio
17.3.8. JAFFER Group of Companies
17.3.8.1. Company Description
17.3.8.2. Business Overview
17.3.8.3. Product Portfolio
17.3.9. AMVAC Chemical Corporation
17.3.9.1. Company Description
17.3.9.2. Business Overview
17.3.9.3. Product Portfolio
18. Primary Research: Key Insights
List of Tables
Table 01: ListofPotentialCostumers
Table 02: AveragePriceComparisonofFumigationProducts(US$/Ton),byForm&Region,2018
Table 03: GlobalFumigationProductsMarketVolume(Tons)Forecast,byForm,2018–2027
Table 04: GlobalFumigationProductsMarketValue(US$Thousand)Forecast,byForm,2018–2027
Table 05: GlobalFumigationProductsMarketVolume(Tons)Forecast,byEnd-user,2018–2027
Table 06: GlobalFumigationProductsMarketValue(US$Thousand)Forecast,byEnd-user,2018–2027
Table 07: GlobalFumigationProductsMarketVolume(Tons)Forecast,byTreatmentMethod,2018–2027
Table 08: GlobalFumigationProductsMarketValue(US$Thousand)Forecast,byTreatmentMethod,2018–2027
Table 09: GlobalFumigationProductsMarketVolume(Tons)Forecast,byRegion,2018–2027
Table 10: GlobalFumigationProductsMarketValue(US$Thousand)Forecast,byRegion,2018–2027
Table 11: NorthAmericaFumigationProductsMarketVolume(Tons)Forecast,byForm,2018–2027
Table 12: NorthAmericaFumigationProductsMarketValue(US$Thousand)Forecast,byForm,2018–2027
Table 13: NorthAmericaFumigationProductsMarketVolume(Tons)Forecast,byEnd-user,2018–2027
Table 14: NorthAmericaFumigationProductsMarketValue(US$Thousand)Forecast,byEnd-user,2018–2027
Table 15: NorthAmericaFumigationProductsMarketVolume(Tons)Forecast,byTreatmentMethod,2018–2027
Table 16: NorthAmericaFumigationProductsMarketValue(US$Thousand)Forecast,byTreatmentMethod,2018–2027
Table 17: NorthAmericaFumigationProductsMarketVolume(Tons)Forecast,byCountry,2018–2027
Table 18: NorthAmericaFumigationProductsMarketValue(US$Thousand)Forecast,byCountry,2018–2027
Table 19: U.S.FumigationProductsMarketVolume(Tons)Forecast,byForm,2018–2027
Table 20: U.S.FumigationProductsMarketValue(US$Thousand)Forecast,byForm,2018–2027
Table 21: U.S.FumigationProductsMarketVolume(Tons)Forecast,byEnd-user,2018–2027
Table 22: U.S.FumigationProductsMarketValue(US$Thousand)Forecast,byEnd-user,2018–2027
Table 23: U.S.FumigationProductsMarketVolume(Tons)Forecast,byTreatmentMethod,2018–2027
Table 24: U.S.FumigationProductsMarketValue(US$Thousand)Forecast,byTreatmentMethod,2018–2027
Table 25: CanadaFumigationProductsMarketVolume(Tons)Forecast,byForm,2018–2027
Table 26: CanadaFumigationProductsMarketValue(US$Thousand)Forecast,byForm,2018–2027
Table 27: CanadaFumigationProductsMarketVolume(Tons)Forecast,byEnd-user,2018–2027
Table 28: CanadaFumigationProductsMarketValue(US$Thousand)Forecast,byEnd-user,2018–2027
Table 29: CanadaFumigationProductsMarketVolume(Tons)Forecast,byTreatmentMethod,2018–2027
Table 30: CanadaFumigationProductsMarketValue(US$Thousand)Forecast,byTreatmentMethod,2018–2027
Table 31: EuropeFumigationProductsMarketVolume(Tons)Forecast,byForm,2018–2027
Table 32: EuropeFumigationProductsMarketValue(US$Thousand)Forecast,byForm,2018–2027
Table 33: EuropeFumigationProductsMarketVolume(Tons)Forecast,byEnd-user,2018–2027
Table 34: EuropeFumigationProductsMarketValue(US$Thousand)Forecast,byEnd-user,2018–2027
Table 35: EuropeFumigationProductsMarketVolume(Tons)Forecast,byTreatmentMethod,2018–2027
Table 36: EuropeFumigationProductsMarketValue(US$Thousand)Forecast,byTreatmentMethod,2018–2027
Table 37: EuropeFumigationProductsMarketVolume(Tons)Forecast,byCountriesandSub-region,2018–2027
Table 38: EuropeFumigationProductsMarketValue(US$Thousand)Forecast,byCountriesandSub-region,2018–2027
Table 39: GermanyFumigationProductsMarketVolume(Tons)Forecast,byForm,2018–2027
Table 40: GermanyFumigationProductsMarketValue(US$Thousand)Forecast,byForm,2018–2027
Table 41: GermanyFumigationProductsMarketVolume(Tons)Forecast,byEnd-user,2018–2027
Table 42: GermanyFumigationProductsMarketValue(US$Thousand)Forecast,byEnd-user,2018–2027
Table 43: GermanyFumigationProductsMarketVolume(Tons)Forecast,byTreatmentMethod,2018–2027
Table 44: GermanyFumigationProductsMarketValue(US$Thousand)Forecast,byTreatmentMethod,2018–2027
Table 45: U.K.FumigationProductsMarketVolume(Tons)Forecast,byForm,2018–2027
Table 46: U.K.FumigationProductsMarketValue(US$Thousand)Forecast,byForm,2018–2027
Table 47: U.K.FumigationProductsMarketVolume(Tons)Forecast,byEnd-user,2018–2027
Table 48: U.K.FumigationProductsMarketValue(US$Thousand)Forecast,byEnd-user,2018–2027
Table 49: U.K.FumigationProductsMarketVolume(Tons)Forecast,byTreatmentMethod,2018–2027
Table 50: U.K.FumigationProductsMarketValue(US$Thousand)Forecast,byTreatmentMethod,2018–2027
Table 51: FranceFumigationProductsMarketVolume(Tons)Forecast,byForm,2018–2027
Table 52: FranceFumigationProductsMarketValue(US$Thousand)Forecast,byForm,2018–2027
Table 53: FranceFumigationProductsMarketVolume(Tons)Forecast,byEnd-user,2018–2027
Table 54: FranceFumigationProductsMarketValue(US$Thousand)Forecast,byEnd-user,2018–2027
Table 55: FranceFumigationProductsMarketVolume(Tons)Forecast,byTreatmentMethod,2018–2027
Table 56: FranceFumigationProductsMarketValue(US$Thousand)Forecast,byTreatmentMethod,2018–2027
Table 57: ItalyFumigationProductsMarketVolume(Tons)Forecast,byForm,2018–2027
Table 58: ItalyFumigationProductsMarketValue(US$Thousand)Forecast,byForm,2018–2027
Table 59: ItalyFumigationProductsMarketVolume(Tons)Forecast,byEnd-user,2018–2027
Table 60: ItalyFumigationProductsMarketValue(US$Thousand)Forecast,byEnd-user,2018–2027
Table 61: ItalyFumigationProductsMarketVolume(Tons)Forecast,byTreatmentMethod,2018–2027
Table 62: ItalyFumigationProductsMarketValue(US$Thousand)Forecast,byTreatmentMethod,2018–2027
Table 63: SpainFumigationProductsMarketVolume(Tons)Forecast,byForm,2018–2027
Table 64: SpainFumigationProductsMarketValue(US$Thousand)Forecast,byForm,2018–2027
Table 65: SpainFumigationProductsMarketVolume(Tons)Forecast,byEnd-user,2018–2027
Table 66: SpainFumigationProductsMarketValue(US$Thousand)Forecast,byEnd-user,2018–2027
Table 67: SpainFumigationProductsMarketVolume(Tons)Forecast,byTreatmentMethod,2018–2027
Table 68: SpainFumigationProductsMarketValue(US$Thousand)Forecast,byTreatmentMethod,2018–2027
Table 69: Russia&CISFumigationProductsMarketVolume(Tons)Forecast,byForm,2018–2027
Table 70: Russia&CISFumigationProductsMarketValue(US$Thousand)Forecast,byForm,2018–2027
Table 71: Russia&CISFumigationProductsMarketVolume(Tons)Forecast,byEnd-user,2018–2027
Table 72: Russia&CISFumigationProductsMarketValue(US$Thousand)Forecast,byEnd-user,2018–2027
Table 73: Russia&CISFumigationProductsMarketVolume(Tons)Forecast,byTreatmentMethod,2018–2027
Table 74: Russia&CISFumigationProductsMarketValue(US$Thousand)Forecast,byTreatmentMethod,2018–2027
Table 75: RestofEuropeFumigationProductsMarketVolume(Tons)Forecast,byForm,2018–2027
Table 76: RestofEuropeFumigationProductsMarketValue(US$Thousand)Forecast,byForm,2018–2027
Table 77: RestofEuropeFumigationProductsMarketVolume(Tons)Forecast,byEnd-user,2018–2027
Table 78: RestofEuropeFumigationProductsMarketValue(US$Thousand)Forecast,byEnd-user,2018–2027
Table 79: RestofEuropeFumigationProductsMarketVolume(Tons)Forecast,byTreatmentMethod,2018–2027
Table 80: RestofEuropeFumigationProductsMarketValue(US$Thousand)Forecast,byTreatmentMethod,2018–2027
Table 81: AsiaPacificFumigationProductsMarketVolume(Tons)Forecast,byForm,2018–2027
Table 82: AsiaPacificFumigationProductsMarketValue(US$Thousand)Forecast,byForm,2018–2027
Table 83: AsiaPacificFumigationProductsMarketVolume(Tons)Forecast,byEnd-user,2018–2027
Table 84: AsiaPacificFumigationProductsMarketValue(US$Thousand)Forecast,byEnd-user,2018–2027
Table 85: AsiaPacificFumigationProductsMarketVolume(Tons)Forecast,byTreatmentMethod,2018–2027
Table 86: AsiaPacificFumigationProductsMarketValue(US$Thousand)Forecast,byTreatmentMethod,2018–2027
Table 87: AsiaPacificFumigationProductsMarketVolume(Tons)Forecast,byCountryandSub-region,2018–2027
Table 88: AsiaPacificFumigationProductsMarketValue(US$Thousand)Forecast,byCountryandSub-region,2018–2027
Table 89: ChinaFumigationProductsMarketVolume(Tons)Forecast,byForm,2018–2027
Table 90: ChinaFumigationProductsMarketValue(US$Thousand)Forecast,byForm,2018–2027
Table 91: ChinaFumigationProductsMarketVolume(Tons)Forecast,byEnd-user,2018–2027
Table 92: ChinaFumigationProductsMarketValue(US$Thousand)Forecast,byEnd-user,2018–2027
Table 93: ChinaFumigationProductsMarketVolume(Tons)Forecast,byTreatmentMethod,2018–2027
Table 94: ChinaFumigationProductsMarketValue(US$Thousand)Forecast,byTreatmentMethod,2018–2027
Table 95: IndiaFumigationProductsMarketVolume(Tons)Forecast,byForm,2018–2027
Table 96: IndiaFumigationProductsMarketValue(US$Thousand)Forecast,byForm,2018–2027
Table 97: IndiaFumigationProductsMarketVolume(Tons)Forecast,byEnd-user,2018–2027
Table 98: IndiaFumigationProductsMarketValue(US$Thousand)Forecast,byEnd-user,2018–2027
Table 99: IndiaFumigationProductsMarketVolume(Tons)Forecast,byTreatmentMethod,2018–2027
Table 100: IndiaFumigationProductsMarketValue(US$Thousand)Forecast,byTreatmentMethod,2018–2027
Table 101: JapanFumigationProductsMarketVolume(Tons)Forecast,byForm,2018–2027
Table 102: JapanFumigationProductsMarketValue(US$Thousand)Forecast,byForm,2018–2027
Table 103: JapanFumigationProductsMarketVolume(Tons)Forecast,byEnd-user,2018–2027
Table 104: JapanFumigationProductsMarketValue(US$Thousand)Forecast,byEnd-user,2018–2027
Table 105: JapanFumigationProductsMarketVolume(Tons)Forecast,byTreatmentMethod,2018–2027
Table 106: JapanFumigationProductsMarketValue(US$Thousand)Forecast,byTreatmentMethod,2018–2027
Table 107: ASEANFumigationProductsMarketVolume(Tons)Forecast,byForm,2018–2027
Table 108: ASEANFumigationProductsMarketValue(US$Thousand)Forecast,byForm,2018–2027
Table 109: ASEANFumigationProductsMarketVolume(Tons)Forecast,byEnd-user,2018–2027
Table 110: ASEANFumigationProductsMarketValue(US$Thousand)Forecast,byEnd-user,2018–2027
Table 111: ASEANFumigationProductsMarketVolume(Tons)Forecast,byTreatmentMethod,2018–2027
Table 112: ASEANFumigationProductsMarketValue(US$Thousand)Forecast,byTreatmentMethod,2018–2027
Table 113: RestofAsiaPacificFumigationProductsMarketVolume(Tons)Forecast,byForm,2018–2027
Table 114: RestofAsiaPacificFumigationProductsMarketValue(US$Thousand)Forecast,byForm,2018–2027
Table 115: RestofAsiaPacificFumigationProductsMarketVolume(Tons)Forecast,byEnd-user,2018–2027
Table 116: RestofAsiaPacificFumigationProductsMarketValue(US$Thousand)Forecast,byEnd-user,2018–2027
Table 117: RestofAsiaPacificFumigationProductsMarketVolume(Tons)Forecast,byTreatmentMethod,2018–2027
Table 118: RestofAsiaPacificFumigationProductsMarketValue(US$Thousand)Forecast,byTreatmentMethod,2018–2027
Table 119: LatinAmericaFumigationProductsMarketVolume(Tons)Forecast,byForm,2018–2027
Table 120: LatinAmericaFumigationProductsMarketValue(US$Thousand)Forecast,byForm,2018–2027
Table 121: LatinAmericaFumigationProductsMarketVolume(Tons)Forecast,byEnd-user,2018–2027
Table 122: LatinAmericaFumigationProductsMarketValue(US$Thousand)Forecast,byEnd-user,2018–2027
Table 123: LatinAmericaFumigationProductsMarketVolume(Tons)Forecast,byTreatmentMethod,2018–2027
Table 124: LatinAmericaFumigationProductsMarketValue(US$Thousand)Forecast,byTreatmentMethod,2018–2027
Table 125: LatinAmericaFumigationProductsMarketVolume(Tons)Forecast,byCountryandSub-region,2018–2027
Table 126: LatinAmericaFumigationProductsMarketValue(US$Thousand)Forecast,byCountryandSub-region,2018–2027
Table 127: BrazilFumigationProductsMarketVolume(Tons)Forecast,byForm,2018–2027
Table 128: BrazilFumigationProductsMarketValue(US$Thousand)Forecast,byForm,2018–2027
Table 129: BrazilFumigationProductsMarketVolume(Tons)Forecast,byEnd-user,2018–2027
Table 130: BrazilFumigationProductsMarketValue(US$Thousand)Forecast,byEnd-user,2018–2027
Table 131: BrazilFumigationProductsMarketVolume(Tons)Forecast,byTreatmentMethod,2018–2027
Table 132: BrazilFumigationProductsMarketValue(US$Thousand)Forecast,byTreatmentMethod,2018–2027
Table 133: MexicoFumigationProductsMarketVolume(Tons)Forecast,byForm,2018–2027
Table 134: MexicoFumigationProductsMarketValue(US$Thousand)Forecast,byForm,2018–2027
Table 135: MexicoFumigationProductsMarketVolume(Tons)Forecast,byEnd-user,2018–2027
Table 136: MexicoFumigationProductsMarketValue(US$Thousand)Forecast,byEnd-user,2018–2027
Table 137: MexicoFumigationProductsMarketVolume(Tons)Forecast,byTreatmentMethod,2018–2027
Table 138: MexicoFumigationProductsMarketValue(US$Thousand)Forecast,byTreatmentMethod,2018–2027
Table 139: RestofLatinAmericaFumigationProductsMarketVolume(Tons)Forecast,byForm,2018–2027
Table 140: RestofLatinAmericaFumigationProductsMarketValue(US$Thousand)Forecast,byForm,2018–2027
Table 141: RestofLatinAmericaFumigationProductsMarketVolume(Tons)Forecast,byEnd-user,2018–2027
Table 142: RestofLatinAmericaFumigationProductsMarketValue(US$Thousand)Forecast,byEnd-user,2018–2027
Table 143: RestofLatinAmericaFumigationProductsMarketVolume(Tons)Forecast,byTreatmentMethod,2018–2027
Table 144: RestofLatinAmericaFumigationProductsMarketValue(US$Thousand)Forecast,byTreatmentMethod,2018–2027
Table 145: MiddleEast&AfricaFumigationProductsMarketVolume(Tons)Forecast,byForm,2018–2027
Table 146: MiddleEast&AfricaFumigationProductsMarketValue(US$Thousand)Forecast,byForm,2018–2027
Table 147: MiddleEast&AfricaFumigationProductsMarketVolume(Tons)Forecast,byEnd-user,2018–2027
Table 148: MiddleEast&AfricaFumigationProductsMarketValue(US$Thousand)Forecast,byEnd-user,2018–2027
Table 149: MiddleEast&AfricaFumigationProductsMarketVolume(Tons)Forecast,byTreatmentMethod,2018–2027
Table 150: MiddleEast&AfricaFumigationProductsMarketValue(US$Thousand)Forecast,byTreatmentMethod,2018–2027
Table 151: MiddleEast&AfricaFumigationProductsMarketVolume(Tons)Forecast,byCountryandSub-region,2018–2027
Table 152: MiddleEast&AfricaFumigationProductsMarketValue(US$Thousand)Forecast,byCountryandSub-region,2018–2027
Table 153: GCCFumigationProductsMarketVolume(Tons)Forecast,byForm,2018–2027
Table 154: GCCFumigationProductsMarketValue(US$Thousand)Forecast,byForm,2018–2027
Table 155: GCCFumigationProductsMarketVolume(Tons)Forecast,byEnd-user,2018–2027
Table 156: GCCFumigationProductsMarketValue(US$Thousand)Forecast,byEnd-user,2018–2027
Table 157: GCCFumigationProductsMarketVolume(Tons)Forecast,byTreatmentMethod,2018–2027
Table 158: GCCFumigationProductsMarketValue(US$Thousand)Forecast,byTreatmentMethod,2018–2027
Table 159: SouthAfricaFumigationProductsMarketVolume(Tons)Forecast,byForm,2018–2027
Table 160: SouthAfricaFumigationProductsMarketValue(US$Thousand)Forecast,byForm,2018–2027
Table 161: SouthAfricaFumigationProductsMarketVolume(Tons)Forecast,byEnd-user,2018–2027
Table 162: SouthAfricaFumigationProductsMarketValue(US$Thousand)Forecast,byEnd-user,2018–2027
Table 163: SouthAfricaFumigationProductsMarketVolume(Tons)Forecast,byTreatmentMethod,2018–2027
Table 164: SouthAfricaFumigationProductsMarketValue(US$Thousand)Forecast,byTreatmentMethod,2018–2027
Table 165: RestofMiddleEast&AfricaFumigationProductsMarketVolume(Tons)Forecast,byForm,2018–2027
Table 166: RestofMiddleEast&AfricaFumigationProductsMarketValue(US$Thousand)Forecast,byForm,2018–2027
Table 167: RestofMiddleEast&AfricaFumigationProductsMarketVolume(Tons)Forecast,byEnd-user,2018–2027
Table 168: RestofMiddleEast&AfricaFumigationProductsMarketValue(US$Thousand)Forecast,byEnd-user,2018–2027
Table 169: RestofMiddleEast&AfricaFumigationProductsMarketVolume(Tons)Forecast,byTreatmentMethod,2018–2027
Table 170: RestofMiddleEast&AfricaFumigationProductsMarketValue(US$Thousand)Forecast,byTreatmentMethod,2018–2027
List of Figures
Figure 01: GlobalFumigationProductsMarketSnapshot,IndicativeVolume(Tons)andValue(US$Thousand),2018–2027
Figure 02: MarketSnapshot,Indicative%RevenueShareandTopTrends
Figure 03: WorldPopulationGrowthandForecast(Million),2012–2050
Figure 04: GlobalAgriculturalProduction(ThousandTons),2012–2018
Figure 05: GlobalFumigationProductsMarketValue(US$Thousand)andVolume(Tons),bySolid,2018–2027
Figure 06: GlobalFumigationProductsMarketValue(US$Thousand)andVolume(Tons),byLiquid,2018–2027
Figure 07: GlobalFumigationProductsMarketValue(US$Thousand)andVolume(Tons),byGas,2018–2027
Figure 08: GlobalFumigationProductsMarketVolumeShare,byForm,2018and2027
Figure 09: GlobalFumigationProductsMarketValue(US$Thousand)andVolume(Tons),byResidential,2018–2027
Figure 10: GlobalFumigationProductsMarketValue(US$Thousand)andVolume(Tons),byAgriculture,2018–2027
Figure 11: GlobalFumigationProductsMarketValue(US$Thousand)andVolume(Tons),byWarehouse/Storage,2018–2027
Figure 12: GlobalFumigationProductsMarketValue(US$Thousand)andVolume(Tons),byOthers,2018–2027
Figure 13: GlobalFumigationProductsMarketVolumeShare,byEnd-user,2018and2027
Figure 14: GlobalFumigationProductsMarketValue(US$Thousand)andVolume(Tons),byMagnesiumPhosphide,2018–2027
Figure 15: GlobalFumigationProductsMarketValue(US$Thousand)andVolume(Tons),byAluminumPhosphide,2018–2027
Figure 16: GlobalFumigationProductsMarketValue(US$Thousand)andVolume(Tons),bySulfurylFluoride,2018–2027
Figure 17: GlobalFumigationProductsMarketValue(US$Thousand)andVolume(Tons),byCarbonDioxide(CO2),2018–2027
Figure 18: GlobalFumigationProductsMarketValue(US$Thousand)andVolume(Tons),byOthers,2018–2027
Figure 19: GlobalFumigationProductsMarketVolumeShare,byTreatmentMethod,2018and2027
Figure 20: GlobalFumigationProductsMarketVolumeShare,byRegion,2018and2027
Figure 21: GlobalFumigationProductsMarketAttractivenessAnalysis,Form
Figure 22: GlobalFumigationProductsMarketAttractiveness,byEnd-user
Figure 23: GlobalFumigationProductsMarketAttractiveness,byTreatmentMethod
Figure 24: GlobalFumigationProductsMarketAttractiveness,byRegion
Figure 25: NorthAmericaFumigationProductsMarketVolume(Tons)andValue(US$Thousand)Forecast,2018–2027
Figure 26: NorthAmericaFumigationProductsMarketAttractiveness,byCountry,
Figure 27: NorthAmericaFumigationProductsMarketVolumeShare,byForm,2018and2027
Figure 28: NorthAmericaFumigationProductsMarketVolumeShare,byEnd-user,2018and2027
Figure 29: NorthAmericaFumigationProductsMarketVolumeShare,byTreatmentMethod,2018and2027
Figure 30: NorthAmericaFumigationProductsMarketVolumeShare,byCountry,2018and2027
Figure 31: NorthAmericaFumigationProductsMarketAttractiveness,byForm
Figure 32: NorthAmericaFumigationProductsMarketAttractiveness,byEnd-user
Figure 33: NorthAmericaMarketAttractivenessAnalysis,byTreatmentMethod
Figure 34: EuropeFumigationProductsMarketVolume(Tons)andValue(US$Thousand)Forecast,2018–2027
Figure 35: EuropeFumigationProductsMarketAttractiveness,byCountryandSub-region
Figure 36: EuropeFumigationProductsMarketVolumeShare,byForm,2018and2027
Figure 37: EuropeFumigationProductsMarketVolumeShare,byEnd-user,2018and2027
Figure 38: EuropeFumigationProductsMarketVolumeShare,byTreatmentMethod,2018and2027
Figure 39: EuropeFumigationProductsMarketVolumeShare,byCountryandSub-region,2018and2027
Figure 40: EuropeFumigationProductsMarketAttractiveness,byForm
Figure 41: EuropeFumigationProductsMarketAttractiveness,byEnd-user
Figure 42: EuropeFumigationProductsMarketAttractiveness,byTreatmentMethod
Figure 43: AsiaPacificFumigationProductsMarketVolume(Tons)andValue(US$Thousand)Forecast,2018–2027
Figure 44: AsiaPacificFumigationProductsMarketAttractiveness,byCountryandSub-region
Figure 45: AsiaPacificFumigationProductsMarketVolumeShare,byForm,2018and2027
Figure 46: AsiaPacificFumigationProductsMarketVolumeShare,byEnd-user,2018and2027
Figure 47: AsiaPacificFumigationProductsMarketVolumeShare,byTreatmentMethod,2018and2027
Figure 48: AsiaPacificFumigationProductsMarketVolumeShare,byCountryandSub-region,2018and2027
Figure 49: AsiaPacificFumigationProductsMarketAttractiveness,byForm
Figure 50: AsiaPacificFumigationProductsMarketAttractiveness,byEnd-user
Figure 51: AsiaPacificFumigationProductsMarketAttractiveness,byTreatmentMethod
Figure 52: LatinAmericaFumigationProductsMarketVolume(Tons)andValue(US$Thousand)Forecast,2018–2027
Figure 53: LatinAmericaFumigationProductsMarketAttractiveness,byCountryandSub-region
Figure 54: LatinAmericaFumigationProductsMarketVolumeShare,byForm,2018and2027
Figure 55: LatinAmericaFumigationProductsMarketVolumeShare,byEnd-user,2018and2027
Figure 56: LatinAmericaFumigationProductsMarketVolumeShare,byTreatmentMethod,2018and2027
Figure 57: LatinAmericaFumigationProductsMarketVolumeShare,byCountryandSub-region,2018and2027
Figure 58: LatinAmericaFumigationProductsMarketAttractiveness,byForm
Figure 59: LatinAmericaFumigationProductsMarketAttractiveness,byEnd-user
Figure 60: LatinAmericaMarketAttractivenessAnalysis,byTreatmentMethod
Figure 61: MiddleEast&AfricaFumigationProductsMarketVolume(Tons)andValue(US$Thousand)Forecast,2018–2027
Figure 62: MiddleEast&AfricaFumigationProductsMarketAttractiveness,byCountryandSub-region
Figure 63: MiddleEast&AfricaFumigationProductsMarketVolumeShare,byForm,2018and2027
Figure 64: MiddleEast&AfricaFumigationProductsMarketVolumeShare,byEnd-user,2018and2027
Figure 65: MiddleEast&AfricaFumigationProductsMarketVolumeShare,byTreatmentMethod,2018and2027
Figure 66: MiddleEast&AfricaFumigationProductsMarketVolumeShare,byCountryandSub-region,2018and2027
Figure 67: MiddleEast&AfricaFumigationProductsMarketAttractiveness,byForm
Figure 68: MiddleEast&AfricaFumigationProductsMarketAttractiveness,byEnd-user
Figure 69: MiddleEast&AfricaFumigationMarketAttractiveness,byTreatmentMethod
Figure 70: GlobalFumigationProductsMarketShareAnalysis,byCompany(2018)
Copyright © Transparency Market Research, Inc. All Rights reserved
Trust Online


Fumigation Products Market