
Ampoules are tiny vials that contain the drug used for injecting into the body and syringes are medical devices used to inject the drug into the body. Continuous developments in the medical sector, such as advancements in biosimilar and biologics, have led to an increase in the demand for ampoules and syringes worldwide. As per the studies conducted by TMR, the global ampoule and syringes market was valued at US$5.1bn in 2015 and is expanding at a CAGR of 10.50% between the forecast period of 2016-2024. By the end of the forecast period of 2024 the ampoule and syringes market is expected to grow at a value of US$12, 4 bn.
The global market for ampoule and syringes is categorized on the basis of the type of ampoule product and syringes. The key ampoule products found in the market are cyclic olefin polymers, plastic ampoules, and cyclic olefin copolymers. The demand for ampoule products is increasing rapidly. Especially glass ampoules are in high demand due to their heat-resistant feature. This aspect led to nearly 84% of the share of glass ampoules in the ampoule and syringes market in the year 2015. The demand for glass ampoules in the ampoule and syringes market is estimated to witness a high growth trajectory in near future. Plastic ampoules are also gaining traction and are foreseen to exhibit a significant growth trajectory. These facets ultimately assist the growth of the ampoule and syringes market.
The two main types of syringes available the in global ampoule and syringes market are glass syringes and polymer syringes. However, the demand for glass syringes is high as compared to plastic syringes. Further, this trend is expected to continue in the forthcoming years. All these aspects have propelled the growth of the ampoule and syringes.
Owing to the growing contraction of chronic diseases among the geriatric population, the masses are inclined towards home healthcare. Furthermore, the syringes are user-friendly and ensure the proper amount of dosage, and can be self-monitored without any formal medical training. The hassles caused during hospitalization can be avoided due to the user-friendly home health care which can be possible through the use of ampoules and syringes. Additionally, the minimum cost of progression-free survival as compared to the ambulatory service centers and hospitals. All these aspects have augured the growth of the ampoule and syringes market during the forecast period of 2016-2024.
The COVID-19 pandemic has hit people across the world. A lot of R&D activities were conducted intensively to cater to the treatment required by people suffering from COVID -19.The increasing number of patients resulted in an emergency situation and non-emergency healthcare services were halted. In the current scenario, the medical services have resumed back as earlier. Hence, the ampoule and syringes market is envisaged to exhibit zealous growth in forthcoming years.
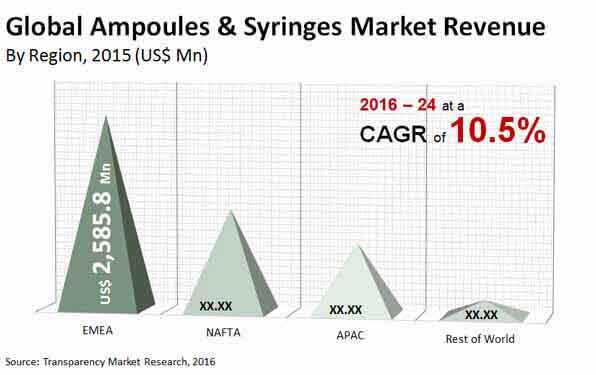
According to the market study based on geographical segmentation, the ampoule and syringes market extends across Europe, Asia Pacific (APAC), the Middle East and Africa (EMEA).The U.S, Mexico, Canada, and the Rest of the world come under the North American Free Trade Agreement (NAFTA).
The EMEA dominates the global ampoule and syringes market due to the increasing demand for home healthcare coupled with awareness about ampoule and syringes. Europe has contributed towards the growth of ampoules and syringes in EMEA. The NAFTA market is expected to witness steady growth due to the presence of major pharmaceutical companies in the region.
The biologics and biosimilar industry is growing at a steady pace and has increased the demand for ampoules and syringes. Thus, the key market players are focusing on acquiring new patents of biologics and introducing biosimilar owing to the growing demand for ampoules and syringes. In accordance with this, the players are investing in R&D activities and constructing manufacturing facilities. The market players are collaborating with leading companies to expand their market reach. The key market players collectively held a share of approximately 77% in the ampoule and syringes market in 2015. These included Nipro Corp., West Pharmaceuticals, Schott AG., Gerresheimer AG, and Becton, Dickinson
The global ampoules and syringes market are segmented as follows
|
By Ampoules Product Type |
|
|
By Syringes Product Type |
|
|
By Region |
|
Ampoules And Syringes Market is projected to reach US $12.4 Bn by 2024
Ampoules And Syringes Market is expected to grow at a CAGR of 10.50% during 2016 - 2024
Ampoules And Syringes Market is studied from 2016 - 2024
Key vendors in the Ampoules And Syringes Market are Nipro Corp., West Pharmaceuticals, Schott AG., Gerresheimer AG, and Becton, Dickinson
Europe region Takes Lead in the Ampoules And Syringes Market
1.Executive Summary
2.Research Methodology
3.Assumptions and Acronyms
4.Market Dynamics & Consumer Survey Analysis
4.1.Drivers
4.1.1.Demand Side
4.1.2.Supply Side
4.2.Industry Challenges and Restraints
4.3.Industry Developments
4.4.Global Ampoules & Syringes Market: Product & Consumer Survey Analysis
4.4.1.Glass Ampoules – Associated Risk
4.4.2.Glass Ampoules – Benefits
4.4.3.Global Ampoules & Syringes Market: Cross Sectional Analysis by Product Type
4.4.4.End User Survey Analysis: Key factors for end users to switch
4.5.Market Taxonomy
4.6.Value Chain
4.7.Global Ampoules & Syringes Market: Prices
5.Global Ampoules & Syringes Market: Market Analysis
5.1.Global Ampoules & Syringes Market – Value & Volume and Absolute $ Opportunity
5.2.Global Ampoules & Syringes Market Analysis, By Product Type
5.2.1.Ampoules
5.2.2.Syringes
5.3.Market Attractiveness Analysis By Product Type
5.4.Global Ampoules & Syringes Market Analysis and Forecast, By Region
5.4.1.Introduction
5.4.1.1.Basis Point Share (BPS) Analysis By Region
5.4.1.2.Y-o-Y Growth Projections By Region
5.4.2.Market Size (US$ Mn) and Volume (Units) Forecast By Region
5.4.2.1.NAFTA
5.4.2.2.EMEA
5.4.2.3.Asia Pacific (APAC)
5.4.2.4.Rest of World
5.4.3.Market Attractiveness Analysis By Region
6.Global Ampoules Market Analysis, By Product Type
6.1.Global Ampoules Market – Value & Volume and Absolute $ Opportunity
6.2.Global Ampoules Market Forecast By Product Type
6.2.1.Global Ampoules Market – Value & Volume and Absolute $ Opportunity, by Glass Ampoules
6.2.1.1.Type I
6.2.1.2.Type II
6.2.1.3.Type III
6.2.2.Global Ampoules Market – Value & Volume and Absolute $ Opportunity, by Plastic Ampoules
6.2.2.1.PVC
6.2.2.2.Polyethylene
6.2.2.3.Polypropylene
6.2.2.4.Others (PET, EVA, Polycarbonate)
6.2.3.Global Ampoules Market – Value & Volume and Absolute $ Opportunity, by COC Ampoules
6.2.4.Global Ampoules Market – Value & Volume and Absolute $ Opportunity, by COP Ampoules
7.Global Ampoules Market Analysis, By Region
7.1.Basis Point Share (BPS) Analysis By Region
7.1.1.Y-o-Y Growth Projections By Region
7.1.2.Market Attractiveness Analysis By Region
7.2.NAFTA Ampoules Market Analysis and Forecast
7.2.1.Market Value & Volume and Absolute $ Opportunity, By Product Type
7.2.1.1.Glass Ampoules
7.2.1.1.1.Type I
7.2.1.1.2.Type II
7.2.1.1.3.Type III
7.2.1.2.Plastic Ampoules
7.2.1.2.1.PVC
7.2.1.2.2.Polyethylene
7.2.1.2.3.Polypropylene
7.2.1.2.4.Others (PET, EVA, Polycarbonate)
7.2.1.3.COC
7.2.1.4.COP
7.3.EMEA Ampoules Market Analysis and Forecast
7.3.1.Market Value & Volume and Absolute $ Opportunity, By Product Type
7.3.1.1.Glass Ampoules
7.3.1.1.1.Type I
7.3.1.1.2.Type II
7.3.1.1.3.Type III
7.3.1.2.Plastic Ampoules
7.3.1.2.1.PVC
7.3.1.2.2.Polyethylene
7.3.1.2.3.Polypropylene
7.3.1.2.4.Others (PET, EVA, Polycarbonate)
7.3.1.3.COC
7.3.1.4.COP
7.4.APAC Ampoules Market Analysis and Forecast
7.4.1.Market Value & Volume and Absolute $ Opportunity, By Product Type
7.4.1.1.Glass Ampoules
7.4.1.1.1.Type I
7.4.1.1.2.Type II
7.4.1.1.3.Type III
7.4.1.2.Plastic Ampoules
7.4.1.2.1.PVC
7.4.1.2.2.Polyethylene
7.4.1.2.3.Polypropylene
7.4.1.2.4.Others (PET, EVA, Polycarbonate)
7.4.1.3.COC
7.4.1.4.COP
7.5.Rest of World Ampoules Market Analysis and Forecast
7.5.1.Market Value & Volume and Absolute $ Opportunity, By Product Type
7.5.1.1.Glass Ampoules
7.5.1.1.1.Type I
7.5.1.1.2.Type II
7.5.1.1.3.Type III
7.5.1.2.Plastic Ampoules
7.5.1.2.1.PVC
7.5.1.2.2.Polyethylene
7.5.1.2.3.Polypropylene
7.5.1.2.4.Others (PET, EVA, Polycarbonate)
7.5.1.3.COC
7.5.1.4.COP
8.Global Syringes Market Analysis, By Product Type
8.1.Global Syringes Market – Value & Volume and Absolute $ Opportunity
8.2.Global Syringes Market Forecast By Product Type
8.2.1.Global Syringes Market – Value & Volume and Absolute $ Opportunity, by Glass Syringes
8.2.2.Global Syringes Market – Value & Volume and Absolute $ Opportunity, by Polymer Syringes
8.2.2.1.COC
8.2.2.2.COP
8.2.2.3.PP and others
9.Global Syringes Market Analysis, By Region
9.1.Basis Point Share (BPS) Analysis By Region
9.1.1.Y-o-Y Growth Projections By Region
9.1.2.Market Attractiveness Analysis By Region
9.2.NAFTA Syringes Market Analysis and Forecast
9.2.1.Market Value & Volume and Absolute $ Opportunity, By Product Type
9.2.1.1.Glass Syringes
9.2.1.2.Polymer Syringes
9.2.1.2.1.COC
9.2.1.2.2.COP
9.2.1.2.3.PP and others
9.3.EMEA Syringes Market Analysis and Forecast
9.3.1.Market Value & Volume and Absolute $ Opportunity, By Product Type
9.3.1.1.Glass Syringes
9.3.1.2.Polymer Syringes
9.3.1.2.1.COC
9.3.1.2.2.COP
9.3.1.2.3.PP and others
9.4.APAC Syringes Market Analysis and Forecast
9.4.1.Market Value & Volume and Absolute $ Opportunity, By Product Type
9.4.1.1.Glass Syringes
9.4.1.2.Polymer Syringes
9.4.1.2.1.COC
9.4.1.2.2.COP
9.4.1.2.3.PP and others
9.5.Rest of World Syringes Market Analysis and Forecast
9.5.1.Market Value & Volume and Absolute $ Opportunity, By Product Type
9.5.1.1.Glass Syringes
9.5.1.2.Polymer Syringes
9.5.1.2.1.COC
9.5.1.2.2.COP
9.5.1.2.3.PP and others
10. Competitive Landscape
10.1. Competition Dashboard
10.2. Company Market Share
10.3. Company Profiles (Details – Overview, Financials, Strategy, Recent Developments)
10.4. Global Players
10.4.1. Schott AG
• Overview
• Financials
• Recent Developments
• Strategy
10.4.2. Gerresheimer AG
• Overview
• Financials
• Recent Developments
• Strategy
10.4.3. Becton, Dickinson and Company
• Overview
• Financials
• Recent Developments
• Strategy
10.4.4. West Pharmaceutical Services, Inc.
• Overview
• Financials
• Recent Developments
• Strategy
10.4.5. Nipro Corporation
• Overview
• Financials
• Recent Developments
• Strategy
10.4.6. Vetter Pharma International GmbH
• Overview
• Financials
• Recent Developments
• Strategy
10.4.7. Stevanato Group
• Overview
• Financials
• Recent Developments
• Strategy
10.4.8. TOPAS Advanced Polymers
• Overview
• Financials
• Recent Developments
• Strategy
10.4.9. JSR CORPORATION
• Overview
• Financials
• Recent Developments
• Strategy
10.4.10. Baxter International Inc.
• Overview
• Financials
• Recent Developments
• Strategy
10.4.11.Terumo Corporation
•Overview
•Financials
•Recent Developments
•Strategy
10.4.12. B. Braun Melsungen AG
• Overview
• Financials
• Recent Developments
• Strategy
10.4.13. Unilife Corporation,
• Overview
• Financials
• Recent Developments
• Strategy
10.4.14.Ypsomed Holding AG
• Overview
• Financials
• Recent Developments
• Strategy
10.4.15.Medtronic
• Overview
• Financials
• Recent Developments
• Strategy
10.4.16. Zeon Corporation
• Overview
• Financials
• Recent Developments
• Strategy
List of Tables
Table 01: Global Ampoules & Syringes Market Size (US$ Mn) and Volume (Mn Units) Forecast, 2014-2024
Table 02: Global Ampoules & Syringes Market Size (US$ Mn) and Volume (Mn Units) Forecast, By Region, 2014-2024
Table 03: Global Ampoules Market Size (US$ Mn) and Volume (Mn Units) Forecast, By Product Type, 2014–2024
Table 04: Global Ampoules Market Size (US$ Mn) and Volume (Mn Units) Forecast, By Glass Ampoules Type, 2014–2024
Table 05: Global Ampoules Market Size (US$ Mn) and Volume (Mn Units) Forecast, By Plastic Ampoules Type, 2014–2024
Table 06: Global Ampoules Market Size (US$ Mn) and Volume (Mn Units) Forecast, By Region, 2014-2024
Table 07: NAFTA Ampoules Market Size (US$ Mn) and Volume (Mn Units) Forecast, By Product Type, 2014–2024
Table 08: NAFTA Ampoules Market Size (US$ Mn) and Volume (Mn Units) Forecast, By Glass Ampoules Type, 2014–2024
Table 09: NAFTA Ampoules Market Size (US$ Mn) and Volume (Mn Units) Forecast, By Plastic Ampoules Type, 2014–2024
Table 10: EMEA Ampoules Market Size (US$ Mn) and Volume (Mn Units) Forecast, By Product Type, 2014–2024
Table 11: EMEA Ampoules Market Size (US$ Mn) and Volume (Mn Units) Forecast, By Glass Ampoules Type, 2014–2024
Table 12: EMEA Ampoules Market Size (US$ Mn) and Volume (Mn Units) Forecast, By Plastic Ampoules Type, 2014–2024
Table 13: APAC Ampoules Market Size (US$ Mn) and Volume (Mn Units) Forecast, By Product Type, 2014–2024
Table 14: APAC Ampoules Market Size (US$ Mn) and Volume (Mn Units) Forecast, By Glass Ampoules Type, 2014–2024
Table 15: APAC Ampoules Market Size (US$ Mn) and Volume (Mn Units) Forecast, By Plastic Ampoules Type, 2014–2024
Table 16: ROW Ampoules Market Size (US$ Mn) and Volume (Mn Units) Forecast, By Product Type, 2014–2024
Table 17: ROW Ampoules Market Size (US$ Mn) and Volume (Mn Units) Forecast, By Glass Ampoules Type, 2014–2024
Table 18: ROW Ampoules Market Size (US$ Mn) and Volume (Mn Units) Forecast, By Plastic Ampoules Type, 2014–2024
Table 19: Global Syringes Market Size (US$ Mn) and Volume (Mn Units) Forecast, By Product Type, 2014–2024
Table 20: Global Syringes Market Size (US$ Mn) and Volume (Mn Units) Forecast, By Region, 2016-2024
Table 21: NAFTA Syringes Market Size (US$ Mn) and Volume (Mn Units) Forecast, By Product Type, 2016-2024
Table 22: EMEA Syringes Market Size (US$ Mn) and Volume (Mn Units) Forecast, By Product Type, 2014-2024
Table 23: APAC Syringes Market Size (US$ Mn) and Volume (Mn Units) Forecast, By Product Type, 2014-2024
Table 24: ROW Syringes Market Size (US$ Mn) and Volume (Mn Units) Forecast, By Product Type, 2014-2024
List of Figures
Figure 01: Global Ampoules & Syringes Market Value (US$ Mn) and Volume (Mn Units), 2015–2024
Figure 02: Global Ampoules & Syringes Market Absolute $ Opportunity (US$ Mn), 2016?2024
Figure 03: Global Ampoules & Syringes Market Value Share & BPS Analysis By Product Type, 2016 & 2024
Figure 04: Global Ampoules & Syringes Market Revenue Y-o-Y Growth By Product Type, 2015–2024
Figure 05: Global Ampoules & Syringes Market Attractiveness Index By Product Type, 2016–2024
Figure 06: Global Ampoules & Syringes Market Value Share & BPS Analysis By Region, 2016 & 2024
Figure 07: Global Ampoules & Syringes Market Revenue Y-o-Y Growth By Region, 2015–2024
Figure 08: Global Ampoules & Syringes Market Attractiveness Index By Region, 2016–2024
Figure 09: Global Ampoules Market Value (US$ Mn) and Volume (Mn Units), 2015–2024
Figure 10: Global Ampoules Market Absolute $ Opportunity (US$ Mn), 2016?2024
Figure 11: Global Ampoules Market Value Share & BPS Analysis By Product Type, 2016 & 2024
Figure 12: Global Ampoules Market Revenue Y-o-Y Growth By Product Type, 2015–2024
Figure 13: Global Ampoules Market Attractiveness Index By Product Type, 2016–2024
Figure 14: Global Ampoules Market Value (US$ Mn) and Volume (Mn Units) By Glass Ampoules Segment, 2015–2024
Figure 15: Global Ampoules Market Absolute $ Opportunity (US$ Mn), , By Glass Ampoules Segment, 2016–2024
Figure 16: Global Ampoules Market Value Share & BPS Analysis By Glass Ampoules Segment , 2016 & 2024
Figure 17: Global Ampoules Market Revenue Y-o-Y Growth By Glass Ampoules Segment , 2016 & 2024
Figure 18: Global Ampoules Market Attractiveness Index By Glass Ampoules Segment , 2016 & 2024
Figure 19: Global Ampoules Market Value (US$ Mn) and Volume (Mn Units) by Type I Glass Ampoules Sub-segment, 2015–2024
Figure 20: Global Ampoules Market Revenue and Volume Y-o-Y Growth (%), by Type I Glass Ampoules Sub-segment, , 2015–2024
Figure 21: Global Ampoules Market Value (US$ Mn) and Volume (Mn Units) by Type II Glass Ampoules Sub-segment , 2015–2024
Figure 22: Global Ampoules Market Revenue and Volume Y-o-Y Growth (%), by Type II Glass Ampoules Sub-segment, 2015–2024
Figure 23: Global Ampoules Market Value (US$ Mn) and Volume (Mn Units) by Type III Glass Ampoules Sub-segment , 2015–2024
Figure 24: Global Ampoules Market Revenue and Volume Y-o-Y Growth (%), by Type III Glass Ampoules Sub-segment, 2015–2024
Figure 25: Global Ampoules Market Value (US$ Mn) and Volume (Mn Units) by Plastic Ampoules Segment, 2015–2024
Figure 26: Global Ampoules Market Absolute $ Opportunity (US$ Mn), by Plastic Ampoules Segment, 2016–2024
Figure 27: Global Ampoules Market Value Share & BPS Analysis By Plastic Ampoules Segment , 2015–2024
Figure 28: Global Ampoules Market Revenue Y-o-Y Growth By Plastic Ampoules Segment , 2016 & 2024
Figure 29: Global Ampoules Market Attractiveness Index By Plastic Ampoules Segment , 2016 & 2024
Figure 30: Global Ampoules Market Value (US$ Mn) and Volume (Mn Units) by PVC Ampoules Sub-segment, 2015–2024
Figure 31: Global Ampoules Market Revenue and Volume Y-o-Y Growth (%), by PVC Ampoules Sub-segment, , 2015–2024
Figure 32: Global Ampoules Market Value (US$ Mn) and Volume (Mn Units) by Polypropylene Ampoules Sub-segment, 2015–2024
Figure 33: Global Ampoules Market Revenue and Volume Y-o-Y Growth (%), by Polyethylene Ampoules Sub-segment, , 2015–2024
Figure 34: Global Ampoules Market Value (US$ Mn) and Volume (Mn Units) by Polypropylene Ampoules Sub-segment, 2015–2024
Figure 35: Global Ampoules Market Revenue and Volume Y-o-Y Growth (%), by Polypropylene Ampoules Sub-segment, , 2015–2024
Figure 36: Global Ampoules Market Value (US$ Mn) and Volume (Mn Units) by Others (PET, EVA, Polycarbonate) Ampoules Sub-segment, 2015–2024
Figure 37: Global Ampoules Market Revenue and Volume Y-o-Y Growth (%), by Others (PET, EVA, Polycarbonate) Ampoules Sub-segment, , 2015–2024
Figure 38: Global Ampoules Market Value (US$ Mn) and Volume (Mn Units) by COC Ampoules Segment, 2015–2024
Figure 39: Global Ampoules Market Absolute $ Opportunity (US$ Mn), by COC Ampoules Segment, , 2016–2024
Figure 40: Global Ampoules Market Value (US$ Mn) and Volume (Mn Units) by COP Ampoules Segment, 2015–2024
Figure 41: Global Ampoules Market Absolute $ Opportunity (US$ Mn) by COP Ampoules Segment, , 2016–2024
Figure 42: Global Ampoules Market Value Share & BPS Analysis By Region, 2016 & 2024
Figure 43: Global Ampoules Market Revenue Y-o-Y Growth By Region, 2015–2024
Figure 44: Global Ampoules Market Attractiveness Index By Region, 2016–2024
Figure 45: NAFTA Ampoules Market Value (US$ Mn) and Volume (Mn Units), 2015–2024
Figure 46: NAFTA Ampoules Market Absolute $ Opportunity (US$ Mn), 2016–2024
Figure 47: NAFTA Ampoules Market Value Share & BPS Analysis By Product Type, 2016 & 2024
Figure 48: NAFTA Ampoules Market Revenue Y-o-Y Growth By Product Type, 2015–2024
Figure 49: NAFTA Ampoules Market Attractiveness Index By Product Type, 2016–2024
Figure 50: NAFTA Ampoules Market Value (US$ Mn) and Volume (Mn Units) By Glass Ampoules Segment, 2015–2024
Figure 51: NAFTA Ampoules Market Absolute $ Opportunity (US$ Mn), By Glass Ampoules Segment, 2016–2024
Figure 52: NAFTA Ampoules Market Value Share & BPS Analysis By Glass Ampoules Segment , 2016 & 2024
Figure 53: NAFTA Ampoules Market Revenue Y-o-Y Growth By Glass Ampoules Segment , 2016 & 2024
Figure 54: NAFTA Ampoules Market Attractiveness Index By Glass Ampoules Segment , 2016 & 2024
Figure 55: NAFTA Ampoules Market Absolute $ Opportunity (US$ Mn), by Type I Glass Ampoules Sub-segment, 2016–2024
Figure 56: NAFTA Ampoules Market Absolute $ Opportunity (US$ Mn), by Type II Glass Ampoules Sub-segment, 2016–2024
Figure 57: NAFTA Ampoules Market Absolute $ Opportunity (US$ Mn), by Type III Glass Ampoules Sub-segment, 2016–2024
Figure 58: NAFTA Ampoules Market Value (US$ Mn) and Volume (Mn Units) by Plastic Ampoules Segment , 2015–2024
Figure 59: NAFTA Ampoules Market Absolute $ Opportunity (US$ Mn), by Plastic Ampoules Segment, 2016–2024
Figure 60: NAFTA Ampoules Market Value Share & BPS Analysis By Plastic Ampoules Segment, 2015–2024
Figure 61: NAFTA Ampoules Market Revenue Y-o-Y Growth By Plastic Ampoules Segment, 2016 & 2024
Figure 62: NAFTA Ampoules Market Attractiveness Index By Plastic Ampoules Segment, 2016 & 2024
Figure 63: NAFTA Ampoules Market Absolute $ Opportunity (US$ Mn), by PVC Ampoules Sub-segment, 2016–2024
Figure 64: NAFTA Ampoules Market Absolute $ Opportunity (US$ Mn), by Polyethylene Ampoules Sub-segment, 2016–2024
Figure 65: NAFTA Ampoules Market Absolute $ Opportunity (US$ Mn), by Polypropylene Ampoules Sub-segment, 2016–2024
Figure 66: NAFTA Ampoules Market Absolute $ Opportunity (US$ Mn), by Others (PET, EVA, Polycarbonate) Ampoules Sub-segment, 2016–2024
Figure 67: Global Ampoules Market Value (US$ Mn) and Volume (Mn Units) by COC Ampoules Segment, 2015–2024
Figure 68: Global Ampoules Market Absolute $ Opportunity (US$ Mn), by COC Ampoules Segment, , 2016–2024
Figure 69: Global Ampoules Market Value (US$ Mn) and Volume (Mn Units) by COP Ampoules Segment, 2015–2024
Figure 70: Global Ampoules Market Absolute $ Opportunity (US$ Mn), by COP Ampoules Segment, , 2016–2024
Figure 71: EMEA Ampoules Market Value (US$ Mn) and Volume (Mn Units), 2015–2024
Figure 72: EMEA Ampoules Market Absolute $ Opportunity (US$ Mn), 2016–2024
Figure 73: EMEA Ampoules Market Value Share & BPS Analysis By Product Type, 2016 & 2024
Figure 74: EMEA Ampoules Market Revenue Y-o-Y Growth By Product Type, 2015–2024
Figure 75: EMEA Ampoules Market Attractiveness Index By Product Type, 2016–2024
Figure 76: EMEA Ampoules Market Value (US$ Mn) and Volume (Mn Units) By Glass Ampoules Segment, 2015–2024
Figure 77: EMEA Ampoules Market Absolute $ Opportunity (US$ Mn), By Glass Ampoules Segment, 2016–2024
Figure 78: EMEA Ampoules Market Value Share & BPS Analysis By Glass Ampoules Segment , 2016 & 2024
Figure 79: EMEA Ampoules Market Revenue Y-o-Y Growth By Glass Ampoules Segment , 2016 & 2024
Figure 80: EMEA Ampoules Market Attractiveness Index By Glass Ampoules Segment , 2016 & 2024
Figure 81: EMEA Ampoules Market Absolute $ Opportunity (US$ Mn), by Type I Glass Ampoules Sub-segment, 2016–2024
Figure 82: EMEA Ampoules Market Absolute $ Opportunity (US$ Mn), by Type II Glass Ampoules Sub-segment, 2016–2024
Figure 83: EMEA Ampoules Market Absolute $ Opportunity (US$ Mn), by Type III Glass Ampoules Sub-segment, 2016–2024
Figure 84: EMEA Ampoules Market Value (US$ Mn) and Volume (Mn Units) by Plastic Ampoules Segment , 2015–2024
Figure 85: EMEA Ampoules Market Absolute $ Opportunity (US$ Mn), by Plastic Ampoules Segment, 2016–2024
Figure 86: EMEA Ampoules Market Value Share & BPS Analysis By Plastic Ampoules Segment, 2015–2024
Figure 87: EMEA Ampoules Market Revenue Y-o-Y Growth By Plastic Ampoules Segment, 2016 & 2024
Figure 88: EMEA Ampoules Market Attractiveness Index By Plastic Ampoules Segment, 2016 & 2024
Figure 89: EMEA Ampoules Market Absolute $ Opportunity (US$ Mn), by PVC Ampoules Sub-segment, 2016–2024
Figure 90: EMEA Ampoules Market Absolute $ Opportunity (US$ Mn), by Polyethylene Ampoules Sub-segment, 2016–2024
Figure 91: EMEA Ampoules Market Absolute $ Opportunity (US$ Mn), by Polypropylene Ampoules Sub-segment, 2016–2024
Figure 92: EMEA Ampoules Market Absolute $ Opportunity (US$ Mn), by Others (PET, EVA, Polycarbonate) Ampoules Sub-segment, 2016–2024
Figure 93: Global Ampoules Market Value (US$ Mn) and Volume (Mn Units) by COC Ampoules Segment, 2015–2024
Figure 94: Global Ampoules Market Absolute $ Opportunity (US$ Mn), by COC Ampoules Segment, , 2016–2024
Figure 95: Global Ampoules Market Value (US$ Mn) and Volume (Mn Units) by COC Ampoules Segment, 2015–2024
Figure 96: Global Ampoules Market Absolute $ Opportunity (US$ Mn), by COC Ampoules Segment, , 2016–2024
Figure 97: APAC Ampoules Market Value (US$ Mn) and Volume (Mn Units), 2015–2024
Figure 98: APAC Ampoules Market Absolute $ Opportunity (US$ Mn), 2016–2024
Figure 99: APAC Ampoules Market Value Share & BPS Analysis By Product Type, 2016 & 2024
Figure 100: APAC Ampoules Market Revenue Y-o-Y Growth By Product Type, 2015–2024
Figure 101: APAC Ampoules Market Attractiveness Index By Product Type, 2016–2024
Figure 102: APAC Ampoules Market Value (US$ Mn) and Volume (Mn Units) By Glass Ampoules Segment, 2015–2024
Figure 103: APAC Ampoules Market Absolute $ Opportunity (US$ Mn), By Glass Ampoules Segment, 2016–2024
Figure 104: APAC Ampoules Market Value Share & BPS Analysis By Glass Ampoules Segment , 2016 & 2024
Figure 105: APAC Ampoules Market Revenue Y-o-Y Growth By Glass Ampoules Segment , 2016 & 2024
Figure 106: APAC Ampoules Market Attractiveness Index By Glass Ampoules Segment , 2016 & 2024
Figure 107: APAC Ampoules Market Absolute $ Opportunity (US$ Mn), by Type I Glass Ampoules Sub-segment, 2016–2024
Figure 108: APAC Ampoules Market Absolute $ Opportunity (US$ Mn), by Type II Glass Ampoules Sub-segment, 2016–2024
Figure 109: APAC Ampoules Market Absolute $ Opportunity (US$ Mn), by Type III Glass Ampoules Sub-segment, 2016–2024
Figure 110: APAC Ampoules Market Value (US$ Mn) and Volume (Mn Units) by Plastic Ampoules Segment , 2015–2024
Figure 111: APAC Ampoules Market Absolute $ Opportunity (US$ Mn), by Plastic Ampoules Segment, 2016–2024
Figure 112: APAC Ampoules Market Value Share & BPS Analysis By Plastic Ampoules Segment, 2015–2024
Figure 113: APAC Ampoules Market Revenue Y-o-Y Growth By Plastic Ampoules Segment, 2016 & 2024
Figure 114: APAC Ampoules Market Attractiveness Index By Plastic Ampoules Segment, 2016 & 2024
Figure 115: APAC Ampoules Market Absolute $ Opportunity (US$ Mn), by PVC Ampoules Sub-segment, 2016–2024
Figure 116: APAC Ampoules Market Absolute $ Opportunity (US$ Mn), by Polyethylene Ampoules Sub-segment, 2016–2024
Figure 117: APAC Ampoules Market Absolute $ Opportunity (US$ Mn), by Polypropylene Ampoules Sub-segment, 2016–2024
Figure 118: APAC Ampoules Market Absolute $ Opportunity (US$ Mn), by Others (PET, EVA, Polycarbonate) Ampoules Sub-segment, 2016–2024
Figure 119: Global Ampoules Market Value (US$ Mn) and Volume (Mn Units) by COC Ampoules Segment, 2015–2024
Figure 120: Global Ampoules Market Absolute $ Opportunity (US$ Mn), by COC Ampoules Segment, , 2016–2024
Figure 121: Global Ampoules Market Value (US$ Mn) and Volume (Mn Units) by COC Ampoules Segment, 2015–2024
Figure 122: Global Ampoules Market Absolute $ Opportunity (US$ Mn), by COC Ampoules Segment, , 2016–2024
Figure 123: ROW Ampoules Market Value (US$ Mn) and Volume (Mn Units), 2015–2024
Figure 124: ROW Ampoules Market Absolute $ Opportunity (US$ Mn), 2016–2024
Figure 125: ROW Ampoules Market Value Share & BPS Analysis By Product Type, 2016 & 2024
Figure 126: ROW Ampoules Market Revenue Y-o-Y Growth By Product Type, 2015–2024
Figure 127: ROW Ampoules Market Attractiveness Index By Product Type, 2016–2024
Figure 128: ROW Ampoules Market Value (US$ Mn) and Volume (Mn Units) By Glass Ampoules Segment, 2015–2024
Figure 129: ROW Ampoules Market Absolute $ Opportunity (US$ Mn), By Glass Ampoules Segment, 2016–2024
Figure 130: ROW Ampoules Market Value Share & BPS Analysis By Glass Ampoules Segment, 2016 & 2024
Figure 131: ROW Ampoules Market Revenue Y-o-Y Growth By Glass Ampoules Segment, 2016 & 2024
Figure 132: ROW Ampoules Market Attractiveness Index By Glass Ampoules Segment, 2016 & 2024
Figure 133: ROW Ampoules Market Absolute $ Opportunity (US$ Mn), by Type I Glass Ampoules Sub-segment, 2016–2024
Figure 134: ROW Ampoules Market Absolute $ Opportunity (US$ Mn), by Type II Glass Ampoules Sub-segment, 2016–2024
Figure 135: ROW Ampoules Market Absolute $ Opportunity (US$ Mn), by Type III Glass Ampoules Sub-segment, 2016–2024
Figure 136: ROW Ampoules Market Value (US$ Mn) and Volume (Mn Units) by Plastic Ampoules Segment , 2015–2024
Figure 137: ROW Ampoules Market Absolute $ Opportunity (US$ Mn), by Plastic Ampoules Segment, 2016–2024
Figure 138: ROW Ampoules Market Value Share & BPS Analysis By Plastic Ampoules Segment, 2015–2024
Figure 139: ROW Ampoules Market Revenue Y-o-Y Growth By Plastic Ampoules Segment, 2016 & 2024
Figure 140: ROW Ampoules Market Attractiveness Index By Plastic Ampoules Segment, 2016 & 2024
Figure 141: ROW Ampoules Market Absolute $ Opportunity (US$ Mn), by PVC Ampoules Sub-segment, 2016–2024
Figure 142: ROW Ampoules Market Absolute $ Opportunity (US$ Mn), by Polyethylene Ampoules Sub-segment, 2016–2024
Figure 143: ROW Ampoules Market Absolute $ Opportunity (US$ Mn), by Polypropylene Ampoules Sub-segment, 2016–2024
Figure 144: ROW Ampoules Market Absolute $ Opportunity (US$ Mn), by Others (PET, EVA, Polycarbonate) Ampoules Sub-segment, 2016–2024
Figure 145: Global Ampoules Market Value (US$ Mn) and Volume (Mn Units) by COC Ampoules Segment, 2015–2024
Figure 146: Global Ampoules Market Absolute $ Opportunity (US$ Mn), by COC Ampoules Segment, , 2016–2024
Figure 147: Global Ampoules Market Value (US$ Mn) and Volume (Mn Units) by COC Ampoules Segment, 2015–2024
Figure 148: Global Ampoules Market Absolute $ Opportunity (US$ Mn), by COC Ampoules Segment, , 2016–2024
Figure 149: Global Syringes Market Value (US$ Mn) and Volume (Mn Units), 2015–2024
Figure 150: Global Syringes Market Absolute $ Opportunity (US$ Mn), 2016?2024
Figure 151: Global Syringes Market Value Share & BPS Analysis by product type, 2016 & 2024
Figure 152: Global Syringes Market Revenue Y-o-Y Growth (%) by product type, 2015–2024
Figure 153: Global Syringes Market Attractiveness Index by product type, 2016–2024
Figure 154: Global Syringes Market Value (US$ Mn) and Volume (Mn Units) by glass syringes segment, 2015–2024
Figure 155: Global Syringes Market Absolute $ Opportunity (US$ Mn) by glass syringes segment, 2016?2024
Figure 156: Global Syringes Market Value (US$ Mn) and Volume (Mn Units) by polymer syringes segment, 2015–2024
Figure 157: Global Syringes Market Absolute $ Opportunity (US$ Mn), 2015–2024 by polymer syringes segment, 2015–2024
Figure 158: Global Syringes Market Value Share & BPS Analysis by polymer syringes segment, 2016 & 2024
Figure 159: Global Syringes Market Revenue Y-o-Y Growth (%) by polymer syringes segment, 2015–2024
Figure 160: Global Syringes Market Attractiveness Index by polymer syringes segment, 2016–2024
Figure 161: Global Syringes Market Value (US$ Mn) and Volume (Mn Units) by COC segment, 2015–2024
Figure 162: Global Syringes Market Revenue and Volume Y-o-Y Growth (%), by COC segment, 2015–2024
Figure 163: Global Syringes Market Value (US$ Mn) and Volume (Mn Units) by COP segment, 2015–2024
Figure 164: Global Syringes Market Revenue and Volume Y-o-Y Growth (%), by COP segment, 2015–2024
Figure 165: Global Syringes Market Value (US$ Mn) and Volume (Mn Units) by PP and others segment, 2015–2024
Figure 166: Global Syringes Market Revenue Y-o-Y (%) Growth by PP and others segment, 2015–2024
Figure 167: Global Syringes Market Value Share & BPS Analysis by Region, 2016 & 2024
Figure 168: Global Syringes Market Revenue Y-o-Y Growth (%) by Region, 2015–2024
Figure 169: Global Syringes Market Attractiveness Index by Region, 2016–2024
Figure 170: NAFTA Syringes Market Value (US$ Mn) and Volume (Mn Units) Forecast, 2015–2024
Figure 171: NAFTA Syringes Market Absolute $ Opportunity (US$ Mn), 2015?2024
Figure 172: NAFTA Syringes Market Share & BPS Analysis by Product Type, 2016 & 2024
Figure 173: NAFTA Syringes Market Revenue Y-o-Y Growth (%) by Product Type, 2015–2024
Figure 174: NAFTA Syringes Market Attractiveness Index by Product Type, 2016–2024
Figure 175: NAFTA Syringes Market Value (US$ Mn) and Volume (Mn Units) by glass syringes segment, 2015–2024
Figure 176: NAFTA Syringes Market Absolute $ Opportunity (US$ Mn) by glass syringes segment, 2015?2024
Figure 177: NAFTA Syringes Market Value (US$ Mn) and Volume (Mn Units) by polymer syringes segment, 2015–2024
Figure 178: NAFTA Syringes Market Absolute $ Opportunity (US$ Mn) by polymer syringes segment, 2015?2024
Figure 179: NAFTA Syringes Market Share & BPS Analysis by polymer syringes segment, 2016 & 2024
Figure 180: NAFTA Syringes Market Revenue Y-o-Y Growth (%) by polymer syringes segment, 2015–2024
Figure 181: NAFTA Syringes Market Attractiveness Index by polymer syringes segment, 2016–2024
Figure 182: NAFTA Syringes Market Absolute $ Opportunity (US$ Mn) by COC syringes, 2016–2024
Figure 183: NAFTA Syringes Market Absolute $ Opportunity (US$ Mn) by COP syringes, 2016–2024
Figure 184: NAFTA Syringes Market Absolute $ Opportunity (US$ Mn) by PP and others, 2016–2024
Figure 185: EMEA Syringes Market Value (US$ Mn) and Volume (Mn Units) Forecast, 2015–2024
Figure 186: EMEA Syringes Market Absolute $ Opportunity (US$ Mn), 2015?2024
Figure 187: EMEA Syringes Market Share & BPS Analysis by Product Type, 2016 & 2024
Figure 188: EMEA Syringes Market Revenue Y-o-Y Growth (%) by Product Type, 2015–2024
Figure 189: EMEA Syringes Market Attractiveness Index by Product Type, 2016–2024
Figure 190: EMEA Syringes Market Value (US$ Mn) and Volume (Mn Units) by glass syringes segment, 2015–2024
Figure 191: EMEA Syringes Market Absolute $ Opportunity (US$ Mn) by glass syringes segment, 2015?2024
Figure 192: EMEA Syringes Market Value (US$ Mn) and Volume (Mn Units) by polymer syringes segment, 2015–2024
Figure 193: EMEA Syringes Market Absolute $ Opportunity (US$ Mn) by polymer syringes segment, 2015?2024
Figure 194: EMEA Syringes Market Share & BPS Analysis by polymer syringes segment, 2016 & 2024
Figure 195: EMEA Syringes Market Revenue Y-o-Y Growth (%) by polymer syringes segment, 2015–2024
Figure 196: EMEA Syringes Market Attractiveness Index by polymer syringes segment, 2016–2024
Figure 197: EMEA Syringes Market Absolute $ Opportunity (US$ Mn) by COC syringes, 2016–2024
Figure 198: EMEA Syringes Market Absolute $ Opportunity (US$ Mn) by COP syringes, 2016–2024
Figure 199: NAFTA Syringes Market Absolute $ Opportunity (US$ Mn) by PP and others, 2016–2024
Figure 200: APAC Syringes Market Value (US$ Mn) and Volume (Mn Units) Forecast, 2015–2024
Figure 201: APAC Syringes Market Absolute $ Opportunity (US$ Mn), 2015?2024
Figure 202: APAC Syringes Market Share & BPS Analysis by Product Type, 2016 & 2024
Figure 203: APAC Syringes Market Revenue Y-o-Y Growth (%) by Product Type, 2015–2024
Figure 204: APAC Syringes Market Attractiveness Index by Product Type, 2016–2024
Figure 205: APAC Syringes Market Value (US$ Mn) and Volume (Mn Units) by glass syringes segment, 2015–2024
Figure 206: APAC Syringes Market Absolute $ Opportunity (US$ Mn) by glass syringes segment, 2015?2024
Figure 207: APAC Syringes Market Value (US$ Mn) and Volume (Mn Units) by polymer syringes segment, 2015–2024
Figure 208: APAC Syringes Market Absolute $ Opportunity (US$ Mn) by polymer syringes segment, 2015?2024
Figure 209: APAC Syringes Market Share & BPS Analysis by polymer syringes segment, 2016 & 2024
Figure 210: APAC Syringes Market Revenue Y-o-Y Growth (%) by polymer syringes segment, 2015–2024
Figure 211: APAC Syringes Market Attractiveness Index by polymer syringes segment, 2016–2024
Figure 211: APAC Syringes Market Absolute $ Opportunity (US$ Mn) by COC syringes, 2016–2024
Figure 212: APAC Syringes Market Absolute $ Opportunity (US$ Mn) by COP syringes, 2016–2024
Figure 213: APAC Syringes Market Absolute $ Opportunity (US$ Mn) by PP and others syringes, 2016–2024
Figure 214: ROW Syringes Market Value (US$ Mn) and Volume (Mn Units) Forecast, 2015–2024
Figure 215: ROW Syringes Market Absolute $ Opportunity (US$ Mn), 2015?2024
Figure 216: ROW Syringes Market Share & BPS Analysis by Product Type, 2016 & 2024
Figure 217: ROW Syringes Market Revenue Y-o-Y Growth (%) by Product Type, 2015–2024
Figure 218: ROW Syringes Market Attractiveness Index by Product Type, 2016–2024
Figure 219: ROW Syringes Market Value (US$ Mn) and Volume (Mn Units) by glass syringes segment, 2015–2024
Figure 220: ROW Syringes Market Absolute $ Opportunity (US$ Mn) by glass syringes segment, 2015?2024
Figure 221: ROW Syringes Market Value (US$ Mn) and Volume (Mn Units) by polymer syringes segment, 2015–2024
Figure 222: ROW Syringes Market Absolute $ Opportunity (US$ Mn) by polymer syringes segment, 2015?2024
Figure 223: ROW Syringes Market Share & BPS Analysis by polymer syringes segment, 2016 & 2024
Figure 224: ROW Syringes Market Revenue Y-o-Y Growth (%) by polymer syringes segment, 2015–2024
Figure 225: ROW Syringes Market Attractiveness Index by polymer syringes segment, 2016–2024
Copyright © Transparency Market Research, Inc. All Rights reserved
Trust Online


Ampoules and Syringes Market Forecast Analysis Report