
Aluminum is one of the abundant metals found in the earth’s crust. In terms of weight, it accounts for nearly 8% of the earth’s crust. Wide availability and numerous properties of aluminum make it a widely used metal across the world. Aluminum is used in various applications such as packaging, household products, electronics, and transportation. It possesses several properties such as high conductivity, ease of recycling, and corrosion resistance; however, aluminum carries drawbacks such as moderate tensile strength and moderate machinability. This limits its direct usage in various end-user industries.
Implementation of stringent greenhouse gases (GHG) and carbon emission norms, rise in focus on usage of hard but lightweight aluminum alloys for manufacture of vehicle durable components, and low toxic emission are some of the factors driving the demand for aluminum. Aluminum is an ideal substitute for materials such as steel and iron, primarily due to its lower self-weight and high strength properties. Prices of aluminum fluctuate primarily due to its application in several end-user industries.
Factors affecting end-user industries indirectly hamper the demand for aluminum, leading to fluctuations in its prices. However, growth in the usage of aluminum alloys in several industries is ascribed to the different properties instilled in pure aluminum by alloying elements. Alloying elements such as copper, silicon, zinc, and magnesium improve properties of aluminum such as high temperature sustainability, high tensile strength, and high fatigue strength. This is anticipated to drive the aluminum market during the forecast period.
The global aluminum market has been segmented based on product form, manufacturing process, and application. Different product forms considered under the scope of the study include flat products, long products, forged products, cast products, and others. Based on manufacturing process, the market has been divided into rolling, extrusion, forging, casting, and others.
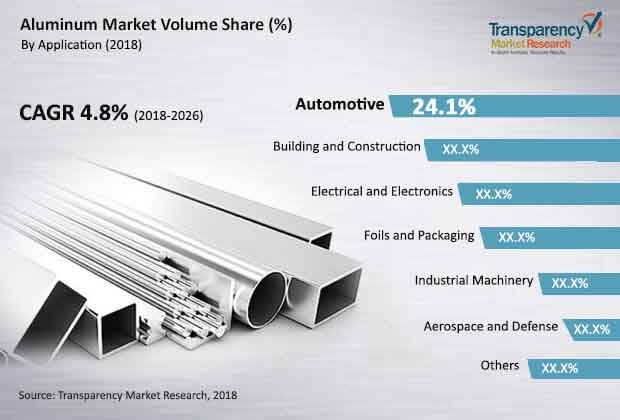
In terms of application, the aluminum market has been segregated into aerospace & defense, automotive, building & construction, electrical & electronics, foils & packaging, industrial machinery, and others. The automotive segment has been further classified into power train, chassis & suspension, and body components, while the building & construction segment has been split into internal, external, and structural. The foils & packaging segment has been segregated into beverage cans, bottles & containers, aerosol cans, foil wraps, medical packaging, and others.
Automobile is considered one of the important industries driving the global economy. It is experiencing a gradual recovery from economic crisis in developed regions. However, demand for automobiles has been rising significantly in Asia Pacific. This increase in demand for automobiles has boosted fuel consumption, thereby propelling the demand for crude petroleum. Additionally, increase in fuel prices across the globe is expected to drive the need for lightweight vehicles. Decrease in weight of vehicles results in better economy of fuel usage. Currently, automobile manufacturers are focusing on lowering the overall weight of vehicles. Aluminum alloys are predominantly used as better substitutes for steel frames of the vehicle body. They help reduce the body weight of the vehicle substantially without compromising on strength and other aspects such as the weight carrying capacity. Aluminum alloys are considerably lighter than conventional steel; this significantly lowers the body weight of automobiles. In turn, this assures better fuel economy, less pollution, and higher efficiency. This is anticipated to increase the demand for aluminum during the forecast period.
Rise in urbanization and industrialization across the globe is boosting the demand for aluminum. The global construction industry is gaining momentum after a moderate contraction in developed regions. Aluminum and aluminum alloys are key materials used in the building & construction industry. Substantial growth in the construction industry is anticipated to augment the need for better materials with high durability & strength, and low-self weight. This, in turn, is estimated to fuel the demand for aluminum and its alloys in the construction industry.
Based on geography, the global aluminum market has been segmented into North America, Europe, Asia Pacific, Latin America, and Middle East & Africa. Asia Pacific was the leading region of the aluminum market in 2017. Consumption of aluminum is concentrated predominantly in electronics production hubs such as China, Japan, South Korea, and Taiwan; and in the construction industry in developing economies in the region. However, the automotive industry is likely to offer higher growth potential for the aluminum market in Asia Pacific. Led by the U.S., demand for aluminum in North America is projected to rise during the forecast period, particularly in industries such as automotive and aerospace & defense.
Key players operating in the aluminum market are expected to benefit from the formation of strategic alliances with global players. Prominent players functioning in the aluminum market include Alcoa Corporation, Aluminum Corporation of China Limited (CHALCO), Norsk Hydro ASA, RUSAL, Emirates Global Aluminium PJSC, and RioTinto.
Aluminum Market - Overview
Aluminum refers to one of the copious metals found in the crust of earth, and accounts for almost 8% weight of the earth’s crust. Over the period of past few years, this metal is gaining immense popularity across various end-user industries including household products, packaging, transportation, and electronics industry. Some of the key reasons behind this wide application of aluminum are numerous properties and wide availability of the metal. Some of the important properties of this metal include ease of recycling, corrosion resistance, and high conductivity. On the flip side, aluminum holds several drawbacks including moderate machinability and moderate tensile strength. As a result, there are limitations for the direct application of aluminum in different end-user industries.
Aluminum is widely used as substitute to various materials including iron and steel. One of the key reasons for this growing adoption of aluminum is the high strength and lower self-weight of the metal. Over the period of past few years, the metal is used in combination with diverse alloying elements including silicon, copper, magnesium, and zinc. This combination helps in advancing the properties of aluminum including high tensile strength, high fatigue strength, and high temperature sustainability.
Increased industrialization across the globe has resulted into notable growth in the number of population shifting toward urban areas of the world. This scenario has boosted the worldwide construction industry, in which aluminum is one of the key raw materials used. Thus, thriving construction industry is likely to generate high demand for aluminum in the years to come. Apart from this, the growth of consumer goods at rapid pace is likely to fuel the market growth in the years to come. Many companies engaged in the aluminum industry are growing focus on their strategic alliances with global players. This strategy is helping them in strengthening their position in the global aluminum market.
|
by Product Form |
|
|
by Manufacturing Proces |
|
|
by Application |
|
|
by Region |
|
1. Preface
1.1. Report Scope and Market Segmentation
1.2. Research Objectives and Highlights
2. Assumptions and Research Methodology
2.1. Report Assumptions
2.2. Scope of the Report
2.3. Secondary Sources and Acronyms Used
3. Executive Summary
3.1. Aluminum Market Snapshot
3.2. Aluminum Market Outlook, 2017
3.3. Market Dynamics & Key Trends
3.4. Aluminum Market - Company Market Share, 2017
3.5. Aluminum Market - Regional Production Output, 2017
4. Market Overview
4.1. Product Overview
4.2. Key Market Developments
4.3. Market Indicators
4.4. Drivers and Restraints Snapshot
4.4.1. Drivers
4.4.2. Restraints
4.4.3. Opportunity Analysis
4.5. Global Aluminum Market Analysis and Forecast
4.6. Porter’s Analysis
4.6.1. Threat of Substitutes
4.6.2. Bargaining Power of Buyers
4.6.3. Bargaining Power of Suppliers
4.6.4. Threat of New Entrants
4.6.5. Degree of Competition
4.7. Value Chain Analysis
4.8. Regulatory Scenario
4.9. Global Aluminum Market: SWOT Analysis
5. Pricing Analysis, 2017
5.1. By Application
5.2. By Region
6. Global Aluminum Production Output Analysis, by Region
7. Global Aluminum Market Analysis, by Product Form
7.1. Key Findings
7.2. Global Aluminum Market Volume Share Analysis, by Product Form
7.3. Global Aluminum Market Forecast and Analysis, by Product Form
7.3.1. Flat Products Market Volume (Kilo Tons) and Value (US$ Mn) Forecast, 2017–2026
7.3.2. Long Products Market Volume (Kilo Tons) and Value (US$ Mn) Forecast, 2017–2026
7.3.3. Forged Products Market Volume (Kilo Tons) and Value (US$ Mn) Forecast, 2017–2026
7.3.4. Cast Products Market Volume (Kilo Tons) and Value (US$ Mn) Forecast, 2017–2026
7.3.5. Others Market Volume (Kilo Tons) and Value (US$ Mn) Forecast, 2017–2026
7.4. Global Aluminum Market Attractiveness Analysis, by Product Form
8. Global Aluminum Market Analysis, by Manufacturing Process
8.1. Key Findings
8.2. Global Aluminum Market Volume Share Analysis, by Manufacturing Process
8.3. Global Aluminum Market Forecast and Analysis, by Manufacturing Process
8.3.1. Aluminum Rolling Market Volume (Kilo Tons) and Value (US$ Mn) Forecast, 2017–2026
8.3.2. Aluminum Extrusion Market Volume (Kilo Tons) and Value (US$ Mn) Forecast, 2017–2026
8.3.3. Aluminum Forging Market Volume (Kilo Tons) and Value (US$ Mn) Forecast, 2017–2026
8.3.4. Aluminum Casting Market Volume (Kilo Tons) and Value (US$ Mn) Forecast, 2017–2026
8.3.5. Other Processes Market Volume (Kilo Tons) and Value (US$ Mn) Forecast, 2017–2026
8.4. Global Aluminum Market Attractiveness Analysis, by Manufacturing Process
9. Global Aluminum Market Analysis, by Application
9.1. Key Findings
9.2. Global Aluminum Market Volume Share Analysis, by Application
9.3. Global Aluminum Market Forecast and Analysis, by Application
9.3.1. Aerospace & Defense Market Volume (Kilo Tons) and Value (US$ Mn) Forecast, 2017–2026
9.3.2. Automotive Market Volume (Kilo Tons) and Value (US$ Mn) Forecast, 2017–2026
9.3.3. Building & Construction Market Volume (Kilo Tons) and Value (US$ Mn) Forecast, 2017–2026
9.3.4. Electrical & Electronics Market Volume (Kilo Tons) and Value (US$ Mn) Forecast, 2017–2026
9.3.5. Foils & Packaging Market Volume (Kilo Tons) and Value (US$ Mn) Forecast, 2017–2026
9.3.6. Industrial Machinery Market Volume (Kilo Tons) and Value (US$ Mn) Forecast, 2017–2026
9.3.7. Others Market Volume (Kilo Tons) and Value (US$ Mn) Forecast, 2017–2026
9.4. Global Aluminum Market Attractiveness Analysis, by Application
10. Global Aluminum Market Analysis, by Region
10.1. Key Findings
10.2. Global Aluminum Market Volume Share Analysis, by Region
10.3. Global Aluminum Market Forecast, by Region
10.3.1. North America Market Volume (Kilo Tons) and Value (US$ Mn) Forecast, 2017–2026
10.3.2. Europe Market Volume (Kilo Tons) and Value (US$ Mn) Forecast, 2017–2026
10.3.3. Asia Pacific Market Volume (Kilo Tons) and Value (US$ Mn) Forecast, 2017–2026
10.3.4. Latin America Market Volume (Kilo Tons) and Value (US$ Mn) Forecast, 2017–2026
10.3.5. Middle East and Africa Market Volume (Kilo Tons) and Value (US$ Mn) Forecast, 2017–2026
10.4. Global Aluminum Market Attractiveness Analysis, by Region
11. North America Aluminum Market Analysis
11.1. Key Findings
11.2. North America Aluminum Market Overview
11.3. North America Aluminum Market Volume Share Analysis and Forecast, by Product Form
11.4. North America Aluminum Market Volume Share Analysis and Forecast, by Manufacturing Process
11.5. North America Aluminum Market Volume Share Analysis and Forecast, by Application
11.6. North America Aluminum Market Volume Share Analysis and Forecast, by Country
11.6.1. U.S. Aluminum Market Volume (Kilo Tons) and Value (US$ Mn) Forecast, by Product Form, 2017-2026
11.6.2. U.S. Aluminum Market Volume (Kilo Tons) and Value (US$ Mn) Forecast, by Manufacturing Process, 2017-2026
11.6.3. U.S. Aluminum Market Volume (Kilo Tons) and Value (US$ Mn) Forecast, by Application, 2017-2026
11.6.4. Canada Aluminum Market Volume (Kilo Tons) and Value (US$ Mn) Forecast, by Product Form, 2017-2026
11.6.5. Canada Aluminum Market Volume (Kilo Tons) and Value (US$ Mn) Forecast, by Manufacturing Process, 2017-2026
11.6.6. Canada Aluminum Market Volume (Kilo Tons) and Value (US$ Mn) Forecast, by Application, 2017-2026
11.7. North America Aluminum Market Attractiveness Analysis
11.8. North America Aluminum Market : PEST Analysis
12. Europe Aluminum Market Analysis
12.1. Key Findings
12.2. Europe Aluminum Market Overview
12.3. Europe Aluminum Market Volume Share Analysis and Forecast, by Product Form
12.4. Europe Aluminum Market Volume Share Analysis and Forecast, by Manufacturing Process
12.5. Europe Aluminum Market Volume Share Analysis and Forecast, by Application
12.6. Europe Aluminum Market Volume Share Analysis and Forecast, by Country/Sub-region
12.6.1. Germany Aluminum Market Volume (Kilo Tons) and Value (US$ Mn) Forecast, by Product Form, 2017-2026
12.6.2. Germany Aluminum Market Volume (Kilo Tons) and Value (US$ Mn) Forecast, by Manufacturing Process, 2017-2026
12.6.3. Germany Aluminum Market Volume (Kilo Tons) and Value (US$ Mn) Forecast, by Application, 2017-2026
12.6.4. France Aluminum Market Volume (Kilo Tons) and Value (US$ Mn) Forecast, by Product Form, 2017-2026
12.6.5. France Aluminum Market Volume (Kilo Tons) and Value (US$ Mn) Forecast, by Manufacturing Process, 2017-2026
12.6.6. France Aluminum Market Volume (Kilo Tons) and Value (US$ Mn) Forecast, by Application, 2017-2026
12.6.7. U.K. Aluminum Market Volume (Kilo Tons) and Value (US$ Mn) Forecast, by Product Form, 2017-2026
12.6.8. U.K. Aluminum Market Volume (Kilo Tons) and Value (US$ Mn) Forecast, by Manufacturing Process, 2017-2026
12.6.9. U.K. Aluminum Market Volume (Kilo Tons) and Value (US$ Mn) Forecast, by Application, 2017-2026
12.6.10. Spain Aluminum Market Volume (Kilo Tons) and Value (US$ Mn) Forecast, by Product Form, 2017-2026
12.6.11. Spain Aluminum Market Volume (Kilo Tons) and Value (US$ Mn) Forecast, by Manufacturing Process, 2017-2026
12.6.12. Spain Aluminum Market Volume (Kilo Tons) and Value (US$ Mn) Forecast, by Application, 2017-2026
12.6.13. Italy Aluminum Market Volume (Kilo Tons) and Value (US$ Mn) Forecast, by Product Form, 2017-2026
12.6.14. Italy Aluminum Market Volume (Kilo Tons) and Value (US$ Mn) Forecast, by Manufacturing Process, 2017-2026
12.6.15. Italy Aluminum Market Volume (Kilo Tons) and Value (US$ Mn) Forecast, by Application, 2017-2026
12.6.16. Russia & CIS Aluminum Market Volume (Kilo Tons) and Value (US$ Mn) Forecast, by Product Form, 2017-2026
12.6.17. Russia & CIS Aluminum Market Volume (Kilo Tons) and Value (US$ Mn) Forecast, by Manufacturing Process, 2017-2026
12.6.18. Russia & CIS Aluminum Market Volume (Kilo Tons) and Value (US$ Mn) Forecast, by Application, 2017-2026
12.6.19. Rest of Europe Aluminum Market Volume (Kilo Tons) and Value (US$ Mn) Forecast, by Product Form, 2017-2026
12.6.20. Rest of Europe Aluminum Market Volume (Kilo Tons) and Value (US$ Mn) Forecast, by Manufacturing Process, 2017-2026
12.6.21. Rest of Europe Aluminum Market Volume (Kilo Tons) and Value (US$ Mn) Forecast, by Application, 2017-2026
12.7. Europe Aluminum Market Attractiveness Analysis
12.8. Europe Aluminum Market : PEST Analysis
13. Asia Pacific Aluminum Market Analysis
13.1. Key Findings
13.2. Asia Pacific Aluminum Market Overview
13.3. Asia Pacific Aluminum Market Volume Share Analysis and Forecast, by Product Form
13.4. Asia Pacific Aluminum Market Volume Share Analysis and Forecast, by Manufacturing Process
13.5. Asia Pacific Aluminum Market Volume Share Analysis and Forecast, by Application
13.6. Asia Pacific Aluminum Market Volume Share Analysis and Forecast, by Country/Sub-region
13.6.1. China Aluminum Market Volume (Kilo Tons) and Value (US$ Mn) Forecast, by Product Form, 2017-2026
13.6.2. China Aluminum Market Volume (Kilo Tons) and Value (US$ Mn) Forecast, by Manufacturing Process, 2017-2026
13.6.3. China Aluminum Market Volume (Kilo Tons) and Value (US$ Mn) Forecast, by Application, 2017-2026
13.6.4. Japan Aluminum Market Volume (Kilo Tons) and Value (US$ Mn) Forecast, by Product Form, 2017-2026
13.6.5. Japan Aluminum Market Volume (Kilo Tons) and Value (US$ Mn) Forecast, by Manufacturing Process, 2017-2026
13.6.6. Japan Aluminum Market Volume (Kilo Tons) and Value (US$ Mn) Forecast, by Application, 2017-2026
13.6.7. India Aluminum Market Volume (Kilo Tons) and Value (US$ Mn) Forecast, by Product Form, 2017-2026
13.6.8. India Aluminum Market Volume (Kilo Tons) and Value (US$ Mn) Forecast, by Manufacturing Process, 2017-2026
13.6.9. India Aluminum Market Volume (Kilo Tons) and Value (US$ Mn) Forecast, by Application, 2017-2026
13.6.10. ASEAN Aluminum Market Volume (Kilo Tons) and Value (US$ Mn) Forecast, by Product Form, 2017-2026
13.6.11. ASEAN Aluminum Market Volume (Kilo Tons) and Value (US$ Mn) Forecast, by Manufacturing Process, 2017-2026
13.6.12. ASEAN Aluminum Market Volume (Kilo Tons) and Value (US$ Mn) Forecast, by Application, 2017-2026
13.6.13. Rest of Asia Pacific Aluminum Market Volume (Kilo Tons) and Value (US$ Mn) Forecast, by Product Form, 2017-2026
13.6.14. Rest of Asia Pacific Aluminum Market Volume (Kilo Tons) and Value (US$ Mn) Forecast, by Manufacturing Process, 2017-2026
13.6.15. Rest of Asia Pacific Aluminum Market Volume (Kilo Tons) and Value (US$ Mn) Forecast, by Application, 2017-2026
13.7. Asia Pacific Aluminum Market Attractiveness Analysis
13.8. Asia Pacific Aluminum Market : PEST Analysis
14. Latin America Aluminum Market Analysis
14.1. Key Findings
14.2. Latin America Aluminum Market Overview
14.3. Latin America Aluminum Market Volume Share Analysis and Forecast, by Product Form
14.4. Latin America Aluminum Market Volume Share Analysis and Forecast, by Manufacturing Process
14.5. Latin America Aluminum Market Volume Share Analysis and Forecast, by Application
14.6. Latin America Aluminum Market Volume Share Analysis and Forecast, by Country/Sub-region
14.6.1. Brazil Aluminum Market Volume (Kilo Tons) and Value (US$ Mn) Forecast, by Product Form, 2017-2026
14.6.2. Brazil Aluminum Market Volume (Kilo Tons) and Value (US$ Mn) Forecast, by Manufacturing Process, 2017-2026
14.6.3. Brazil Aluminum Market Volume (Kilo Tons) and Value (US$ Mn) Forecast, by Application, 2017-2026
14.6.4. Mexico Aluminum Market Volume (Kilo Tons) and Value (US$ Mn) Forecast, by Product Form, 2017-2026
14.6.5. Mexico Aluminum Market Volume (Kilo Tons) and Value (US$ Mn) Forecast, by Manufacturing Process, 2017-2026
14.6.6. Mexico Aluminum Market Volume (Kilo Tons) and Value (US$ Mn) Forecast, by Application, 2017-2026
14.6.7. Rest of Latin America Aluminum Market Volume (Kilo Tons) and Value (US$ Mn) Forecast, by Product Form, 2017-2026
14.6.8. Rest of Latin America Aluminum Market Volume (Kilo Tons) and Value (US$ Mn) Forecast, by Manufacturing Process, 2017-2026
14.6.9. Rest of Latin America Aluminum Market Volume (Kilo Tons) and Value (US$ Mn) Forecast, by Application, 2017-2026
14.7. Latin America Aluminum Market Attractiveness Analysis
14.8. Latin America Aluminum Market : PEST Analysis
15. Middle East & Africa Aluminum Market Analysis
15.1. Key Findings
15.2. Middle East & Africa Aluminum Market Overview
15.3. Middle East & Africa Aluminum Market Volume Share Analysis and Forecast, by Product Form
15.4. Middle East & Africa Aluminum Market Volume Share Analysis and Forecast, by Manufacturing Process
15.5. Middle East & Africa Aluminum Market Volume Share Analysis and Forecast, by Application
15.6. Middle East & Africa Aluminum Market Volume Share Analysis and Forecast, by Country/Sub-region
15.6.1. GCC Aluminum Market Volume (Kilo Tons) and Value (US$ Mn) Forecast, by Product Form, 2017-2026
15.6.2. GCC Aluminum Market Volume (Kilo Tons) and Value (US$ Mn) Forecast, by Manufacturing Process, 2017-2026
15.6.3. GCC Aluminum Market Volume (Kilo Tons) and Value (US$ Mn) Forecast, by Application, 2017-2026
15.6.4. South Africa Aluminum Market Volume (Kilo Tons) and Value (US$ Mn) Forecast, by Product Form, 2017-2026
15.6.5. South Africa Aluminum Market Volume (Kilo Tons) and Value (US$ Mn) Forecast, by Manufacturing Process, 2017-2026
15.6.6. South Africa Aluminum Market Volume (Kilo Tons) and Value (US$ Mn) Forecast, by Application, 2017-2026
15.6.7. Rest of Middle East & Africa Aluminum Market Volume (Kilo Tons) and Value (US$ Mn) Forecast, by Product Form, 2017-2026
15.6.8. Rest of Middle East & Africa Aluminum Market Volume (Kilo Tons) and Value (US$ Mn) Forecast, by Manufacturing Process, 2017-2026
15.6.9. Rest of Middle East & Africa Aluminum Market Volume (Kilo Tons) and Value (US$ Mn) Forecast, by Application, 2017-2026
15.7. Middle East & Africa Aluminum Market Attractiveness Analysis
15.8. Middle East & Africa Aluminum Market : PEST Analysis
16. Competition Landscape
16.1. Global Aluminum Market Share Analysis, by Company (2017)
16.2. Competition Matrix
16.3. Company Profiles
16.3.1. Alcoa Corporation
16.3.1.1. Company Description
16.3.1.2. Business Overview
16.3.1.3. Financial Details
16.3.1.4. Plant/Facility Details
16.3.1.5. Strategic Overview
16.3.2. Aluminum Corporation of China Limited (CHALCO)
16.3.2.1. Company Description
16.3.2.2. Business Overview
16.3.2.3. Financial Details
16.3.2.4. Plant/Facility Details
16.3.2.5. Recent Developments
16.3.2.6. Strategic Overview
16.3.3. Norsk Hydro ASA
16.3.3.1. Company Description
16.3.3.2. Business Overview
16.3.3.3. Financial Details
16.3.3.4. Production Details
16.3.3.5. Recent Developments
16.3.3.6. Strategic Overview
16.3.4. UC Rusal
16.3.4.1. Company Description
16.3.4.2. Business Overview
16.3.4.3. Financial Details
16.3.4.4. Strategic Overview
16.3.5. Emirates Global Aluminium PJSC
16.3.5.1. Company Description
16.3.5.2. Business Overview
16.3.5.3. Financial Details
16.3.5.4. Recent Developments
16.3.5.5. Strategic Overview
16.3.6. RioTinto
16.3.6.1. Company Description
16.3.6.2. Business Overview
16.3.6.3. Financial Details
16.3.6.4. Recent Developments
16.3.6.5. Strategic Overview
16.3.7. China Hongqiao Group Limited
16.3.7.1. Company Description
16.3.7.2. Financial Overview
16.3.7.3. Strategic Overview
16.3.8. State Power Investment Corporation (SPIC)
16.3.8.1. Company Description
16.3.8.2. Business Overview
16.3.9. East Hope Group
16.3.9.1. Company Description
16.3.9.2. Business Overview
16.3.10. Xinfa Group Co. Ltd.
16.3.10.1. Company Description
16.3.10.2. Business Overview
17. Primary Research – Key Insights
List of Tables
Table 01: Production of Aluminum at Regional Level (Kilo Tons), 2017
Table 02: Global Aluminum Market Volume (Kilo Tons) and Value (US$ Mn) Forecast, by Product Form, 2017–2026
Table 03: Global Aluminum Market Volume (Kilo Tons) and Value (US$ Mn) Forecast, by Manufacturing Process, 2017–2026
Table 04: Global Aluminum Market Volume (Kilo Tons) Forecast, by Application, 2017–2026 (1/2)
Table 05: Global Aluminum Market Volume (Kilo Tons) Forecast, by Application, 2017–2026 (2/2)
Table 06: Global Aluminum Market Value (US$ Mn) Forecast, by Application, 2017–2026 (1/2)
Table 07: Global Aluminum Market Value (US$ Mn) Forecast, by Application, 2017–2026 (2/2)
Table 08: Global Aluminum Market Volume (Kilo Tons) and Value (US$ Mn) Forecast, by Region, 2017–2026
Table 09: North America Aluminum Market Volume (Kilo Tons) and Value (US$ Mn) Forecast, by Product Form, 2017–2026
Table 10: North America Aluminum Market Volume (Kilo Tons) and Value (US$ Mn) Forecast, by Manufacturing Process, 2017–2026
Table 11: North America Aluminum Market Volume (Kilo Tons) Forecast, by Application, 2017–2026 (1/2)
Table 12: North America Aluminum Market Volume (Kilo Tons) Forecast, by Application, 2017–2026 (2/2)
Table 13: North America Aluminum Market Value (US$ Mn) Forecast, by Application, 2017–2026 (1/2)
Table 14: North America Aluminum Market Value (US$ Mn) Forecast, by Application, 2017–2026 (2/2)
Table 15: North America Aluminum Market Volume (Kilo Tons) and Value (US$ Mn) Forecast, by Country, 2017–2026
Table 16: U.S. Aluminum Market Volume (Kilo Tons) and Value (US$ Mn) Forecast, by Product Form, 2017–2026
Table 17: U.S. Aluminum Market Volume (Kilo Tons) and Value (US$ Mn) Forecast, by Manufacturing Process, 2017–2026
Table 18: U.S. Aluminum Market Volume (Kilo Tons) Forecast, by Application, 2017–2026 (1/2)
Table 19: U.S. Aluminum Market Volume (Kilo Tons) Forecast, by Application, 2017–2026 (2/2)
Table 20: U.S. Aluminum Market Value (US$ Mn) Forecast, by Application, 2017–2026 (1/2)
Table 21: U.S. Aluminum Market Value (US$ Mn) Forecast, by Application, 2017–2026 (2/2)
Table 22: Canada Aluminum Market Volume (Kilo Tons) and Value (US$ Mn) Forecast, by Product Form, 2017–2026
Table 23: Canada Aluminum Market Volume (Kilo Tons) and Value (US$ Mn) Forecast, by Manufacturing Process, 2017–2026
Table 24: Canada Aluminum Market Volume (Kilo Tons) Forecast, by Application, 2017–2026 (1/2)
Table 25: Canada Aluminum Market Volume (Kilo Tons) Forecast, by Application, 2017–2026 (2/2)
Table 26: Canada Aluminum Market Value (US$ Mn) Forecast, by Application, 2017–2026 (1/2)
Table 27: Canada Aluminum Market Value (US$ Mn) Forecast, by Application, 2017–2026 (2/2)
Table 28: Europe Aluminum Market Volume (Kilo Tons) and Value (US$ Mn) Forecast, by Product Form, 2017–2026
Table 29: Europe Aluminum Market Volume (Kilo Tons) and Value (US$ Mn) Forecast, by Manufacturing Process, 2017–2026
Table 30: Europe Aluminum Market Volume (Kilo Tons) Forecast, by Application, 2017–2026 (1/2)
Table 31: Europe Aluminum Market Volume (Kilo Tons) Forecast, by Application, 2017–2026 (2/2)
Table 32: Europe Aluminum Market Value (US$ Mn) Forecast, by Application, 2017–2026 (1/2)
Table 33: Europe Aluminum Market Value (US$ Mn) Forecast, by Application, 2017–2026 (2/2)
Table 34: Europe Aluminum Market Volume (Kilo Tons) Forecast, by Country/Sub-region, 2017–2026
Table 35: Europe Aluminum Market Value (US$ Mn) Forecast, by Country/Sub-region, 2017–2026
Table 36: Germany Aluminum Market Volume (Kilo Tons) and Value (US$ Mn) Forecast, by Product Form, 2017–2026
Table 37: Germany Aluminum Market Volume (Kilo Tons) and Value (US$ Mn) Forecast, by Manufacturing Process, 2017–2026
Table 38: Germany Aluminum Market Volume (Kilo Tons) Forecast, by Application, 2017–2026 (1/2)
Table 39: Germany Aluminum Market Volume (Kilo Tons) Forecast, by Application, 2017–2026 (2/2)
Table 40: Germany Aluminum Market Value (US$ Mn) Forecast, by Application, 2017–2026 (1/2)
Table 41: Germany Aluminum Market Value (US$ Mn) Forecast, by Application, 2017–2026 (2/2)
Table 42: France Aluminum Market Volume (Kilo Tons) and Value (US$ Mn) Forecast, by Product Form, 2017–2026
Table 43: France Aluminum Market Volume (Kilo Tons) and Value (US$ Mn) Forecast, by Manufacturing Process, 2017–2026
Table 44: France Aluminum Market Volume (Kilo Tons) Forecast, by Application, 2017–2026 (1/2)
Table 45: France Aluminum Market Volume (Kilo Tons) Forecast, by Application, 2017–2026 (2/2)
Table 46: France Aluminum Market Value (US$ Mn) Forecast, by Application, 2017–2026 (1/2)
Table 47: France Aluminum Market Value (US$ Mn) Forecast, by Application, 2017–2026 (2/2)
Table 48: U.K. Aluminum Market Volume (Kilo Tons) and Value (US$ Mn) Forecast, by Product Form, 2017–2026
Table 49: U.K. Aluminum Market Volume (Kilo Tons) and Value (US$ Mn) Forecast, by Manufacturing Process, 2017–2026
Table 50: U.K. Aluminum Market Volume (Kilo Tons) Forecast, by Application, 2017–2026 (1/2)
Table 51: U.K. Aluminum Market Volume (Kilo Tons) Forecast, by Application, 2017–2026 (2/2)
Table 52: U.K. Aluminum Market Value (US$ Mn) Forecast, by Application, 2017–2026 (1/2)
Table 53: U.K. Aluminum Market Value (US$ Mn) Forecast, by Application, 2017–2026 (2/2)
Table 54: Spain Aluminum Market Volume (Kilo Tons) and Value (US$ Mn) Forecast, by Product Form, 2017–2026
Table 55: Spain Aluminum Market Volume (Kilo Tons) and Value (US$ Mn) Forecast, by Manufacturing Process, 2017–2026
Table 56: Spain Aluminum Market Volume (Kilo Tons) Forecast, by Application, 2017–2026 (1/2)
Table 57: Spain Aluminum Market Volume (Kilo Tons) Forecast, by Application, 2017–2026 (2/2)
Table 58: Spain Aluminum Market Value (US$ Mn) Forecast, by Application, 2017–2026 (1/2)
Table 59: Spain Aluminum Market Value (US$ Mn) Forecast, by Application, 2017–2026 (2/2)
Table 60: Italy Aluminum Market Volume (Kilo Tons) and Value (US$ Mn) Forecast, by Product Form, 2017–2026
Table 61: Italy Aluminum Market Volume (Kilo Tons) and Value (US$ Mn) Forecast, by Manufacturing Process, 2017–2026
Table 62: Italy Aluminum Market Volume (Kilo Tons) Forecast, by Application, 2017–2026 (1/2)
Table 63: Italy Aluminum Market Volume (Kilo Tons) Forecast, by Application, 2017–2026 (2/2)
Table 64: Italy Aluminum Market Value (US$ Mn) Forecast, by Application, 2017–2026 (1/2)
Table 65: Italy Aluminum Market Value (US$ Mn) Forecast, by Application, 2017–2026 (2/2)
Table 66: Russia & CIS Aluminum Market Volume (Kilo Tons) and Value (US$ Mn) Forecast, by Product Form, 2017–2026
Table 67: Russia & CIS Aluminum Market Volume (Kilo Tons) and Value (US$ Mn) Forecast, by Manufacturing Process, 2017–2026
Table 68: Russia & CIS Aluminum Market Volume (Kilo Tons) Forecast, by Application, 2017–2026 (1/2)
Table 69: Russia & CIS Aluminum Market Volume (Kilo Tons) Forecast, by Application, 2017–2026 (2/2)
Table 70: Russia & CIS Aluminum Market Value (US$ Mn) Forecast, by Application, 2017–2026 (1/2)
Table 71: Russia & CIS Aluminum Market Value (US$ Mn) Forecast, by Application, 2017–2026 (2/2)
Table 72: Rest of Europe Aluminum Market Volume (Kilo Tons) and Value (US$ Mn) Forecast, by Product Form, 2017–2026
Table 73: Rest of Europe Aluminum Market Volume (Kilo Tons) and Value (US$ Mn) Forecast, by Manufacturing Process, 2017–2026
Table 74: Rest of Europe Aluminum Market Volume (Kilo Tons) Forecast, by Application, 2017–2026 (1/2)
Table 75: Rest of Europe Aluminum Market Volume (Kilo Tons) Forecast, by Application, 2017–2026 (2/2)
Table 76: Rest of Europe Aluminum Market Value (US$ Mn) Forecast, by Application, 2017–2026 (1/2)
Table 77: Rest of Europe Aluminum Market Value (US$ Mn) Forecast, by Application, 2017–2026 (2/2)
Table 78: Asia Pacific Aluminum Market Volume (Kilo Tons) and Value (US$ Mn) Forecast, by Product Form, 2017–2026
Table 79: Asia Pacific Aluminum Market Volume (Kilo Tons) and Value (US$ Mn) Forecast, by Manufacturing Process, 2017–2026
Table 80: Asia Pacific Aluminum Market Volume (Kilo Tons) Forecast, by Application, 2017–2026 (1/2)
Table 81: Asia Pacific Aluminum Market Volume (Kilo Tons) Forecast, by Application, 2017–2026 (2/2)
Table 82: Asia Pacific Aluminum Market Value (US$ Mn) Forecast, by Application, 2017–2026 (1/2)
Table 83: Asia Pacific Aluminum Market Value (US$ Mn) Forecast, by Application, 2017–2026 (2/2)
Table 84: Asia Pacific Aluminum Market Volume (Kilo Tons) and Value (US$ Mn) Forecast, by Country/Sub-region, 2017–2026
Table 85: China Aluminum Market Volume (Kilo Tons) and Value (US$ Mn) Forecast, by Product Form, 2017–2026
Table 86: China Aluminum Market Volume (Kilo Tons) and Value (US$ Mn) Forecast, by Manufacturing Process, 2017–2026
Table 87: China Aluminum Market Volume (Kilo Tons) Forecast, by Application, 2017–2026 (1/2)
Table 88: China Aluminum Market Volume (Kilo Tons) Forecast, by Application, 2017–2026 (2/2)
Table 89: China Aluminum Market Value (US$ Mn) Forecast, by Application, 2017–2026 (1/2)
Table 90: China Aluminum Market Value (US$ Mn) Forecast, by Application, 2017–2026 (2/2)
Table 91: Japan Aluminum Market Volume (Kilo Tons) and Value (US$ Mn) Forecast, by Product Form, 2017–2026
Table 92: Japan Aluminum Market Volume (Kilo Tons) and Value (US$ Mn) Forecast, by Manufacturing Process, 2017–2026
Table 93: Japan Aluminum Market Volume (Kilo Tons) Forecast, by Application, 2017–2026 (1/2)
Table 94: Japan Aluminum Market Volume (Kilo Tons) Forecast, by Application, 2017–2026 (2/2)
Table 95: Japan Aluminum Market Value (US$ Mn) Forecast, by Application, 2017–2026 (1/2)
Table 96: Japan Aluminum Market Value (US$ Mn) Forecast, by Application, 2017–2026 (2/2)
Table 97: India Aluminum Market Volume (Kilo Tons) and Value (US$ Mn) Forecast, by Product Form, 2017–2026
Table 98: India Aluminum Market Volume (Kilo Tons) and Value (US$ Mn) Forecast, by Manufacturing Process, 2017–2026
Table 99: India Aluminum Market Volume (Kilo Tons) Forecast, by Application, 2017–2026 (1/2)
Table 100: India Aluminum Market Volume (Kilo Tons) Forecast, by Application, 2017–2026 (2/2)
Table 101: India Aluminum Market Value (US$ Mn) Forecast, by Application, 2017–2026 (1/2)
Table 102: India Aluminum Market Value (US$ Mn) Forecast, by Application, 2017–2026 (2/2)
Table 103: ASEAN Aluminum Market Volume (Kilo Tons) and Value (US$ Mn) Forecast, by Product Form, 2017–2026
Table 104: ASEAN Aluminum Market Volume (Kilo Tons) and Value (US$ Mn) Forecast, by Manufacturing Process, 2017–2026
Table 105: ASEAN Aluminum Market Volume (Kilo Tons) Forecast, by Application, 2017–2026 (1/2)
Table 106: ASEAN Aluminum Market Volume (Kilo Tons) Forecast, by Application, 2017–2026 (2/2)
Table 107: ASEAN Aluminum Market Value (US$ Mn) Forecast, by Application, 2017–2026 (1/2)
Table 108: ASEAN Aluminum Market Value (US$ Mn) Forecast, by Application, 2017–2026 (2/2)
Table 109: Rest of Asia Pacific Aluminum Market Volume (Kilo Tons) and Value (US$ Mn) Forecast, by Product Form, 2017–2026
Table 110: Rest of Asia Pacific Aluminum Market Volume (Kilo Tons) and Value (US$ Mn) Forecast, by Manufacturing Process, 2017–2026
Table 111: Rest of Asia Pacific Aluminum Market Volume (Kilo Tons) Forecast, by Application, 2017–2026 (1/2)
Table 112: Rest of Asia Pacific Aluminum Market Volume (Kilo Tons) Forecast, by Application, 2017–2026 (2/2)
Table 113: Rest of Asia Pacific Aluminum Market Value (US$ Mn) Forecast, by Application, 2017–2026 (1/2)
Table 114: Rest of Asia Pacific Aluminum Market Value (US$ Mn) Forecast, by Application, 2017–2026 (2/2)
Table 115: Latin America Aluminum Market Volume (Kilo Tons) and Value (US$ Mn) Forecast, by Product Form, 2017–2026
Table 116: Latin America Aluminum Market Volume (Kilo Tons) and Value (US$ Mn) Forecast, by Manufacturing Process, 2017–2026
Table 117: Latin America Aluminum Market Volume (Kilo Tons) Forecast, by Application, 2017–2026 (1/2)
Table 118: Latin America Aluminum Market Volume (Kilo Tons) Forecast, by Application, 2017–2026 (2/2)
Table 119: Latin America Aluminum Market Value (US$ Mn) Forecast, by Application, 2017–2026 (1/2)
Table 120: Latin America Aluminum Market Value (US$ Mn) Forecast, by Application, 2017–2026 (2/2)
Table 121: Latin America Aluminum Market Volume (Kilo Tons) and Value (US$ Mn) Forecast, by Country/Sub-region, 2017–2026
Table 122: Brazil Aluminum Market Volume (Kilo Tons) and Value (US$ Mn) Forecast, by Product Form, 2017–2026
Table 123: Brazil Aluminum Market Volume (Kilo Tons) and Value (US$ Mn) Forecast, by Manufacturing Process, 2017–2026
Table 124: Brazil Aluminum Market Volume (Kilo Tons) Forecast, by Application, 2017–2026 (1/2)
Table 125: Brazil Aluminum Market Volume (Kilo Tons) Forecast, by Application, 2017–2026 (2/2)
Table 126: Brazil Aluminum Market Value (US$ Mn) Forecast, by Application, 2017–2026 (1/2)
Table 127: Brazil Aluminum Market Value (US$ Mn) Forecast, by Application, 2017–2026 (2/2)
Table 128: Mexico Aluminum Market Volume (Kilo Tons) and Value (US$ Mn) Forecast, by Product Form, 2017–2026
Table 129: Mexico Aluminum Market Volume (Kilo Tons) and Value (US$ Mn) Forecast, by Manufacturing Process, 2017–2026
Table 130: Mexico Aluminum Market Volume (Kilo Tons) Forecast, by Application, 2017–2026 (1/2)
Table 131: Mexico Aluminum Market Volume (Kilo Tons) Forecast, by Application, 2017–2026 (2/2)
Table 132: Mexico Aluminum Market Value (US$ Mn) Forecast, by Application, 2017–2026 (1/2)
Table 133: Mexico Aluminum Market Value (US$ Mn) Forecast, by Application, 2017–2026 (2/2)
Table 134: Rest of Latin America Aluminum Market Volume (Kilo Tons) and Value (US$ Mn) Forecast, by Product Form, 2017–2026
Table 135: Rest of Latin America Aluminum Market Volume (Kilo Tons) and Value (US$ Mn) Forecast, by Manufacturing Process, 2017–2026
Table 136: Rest of Latin America Aluminum Market Volume (Kilo Tons) Forecast, by Application, 2017–2026 (1/2)
Table 137: Rest of Latin America Aluminum Market Volume (Kilo Tons) Forecast, by Application, 2017–2026 (2/2)
Table 138: Rest of Latin America Aluminum Market Value (US$ Mn) Forecast, by Application, 2017–2026 (1/2)
Table 139: Rest of Latin America Aluminum Market Value (US$ Mn) Forecast, by Application, 2017–2026 (2/2)
Table 140: Middle East & Africa Aluminum Market Volume (Kilo Tons) and Value (US$ Mn) Forecast, by Product Form, 2017–2026
Table 141: Middle East & Africa Aluminum Market Volume (Kilo Tons) and Value (US$ Mn) Forecast, by Manufacturing Process, 2017–2026
Table 142: Middle East & Africa Aluminum Market Volume (Kilo Tons) Forecast, by Application, 2017–2026 (1/2)
Table 143: Middle East & Africa Aluminum Market Volume (Kilo Tons) Forecast, by Application, 2017–2026 (2/2)
Table 144: Middle East & Africa Aluminum Market Value (US$ Mn) Forecast, by Application, 2017–2026 (1/2)
Table 145: Middle East & Africa Aluminum Market Value (US$ Mn) Forecast, by Application, 2017–2026 (2/2)
Table 146: Middle East & Africa Aluminum Market Volume (Kilo Tons) and Value (US$ Mn) Forecast, by Country/Sub-region, 2017–2026
Table 147: GCC Aluminum Market Volume (Kilo Tons) and Value (US$ Mn) Forecast, by Product Form, 2017–2026
Table 148: GCC Aluminum Market Volume (Kilo Tons) and Value (US$ Mn) Forecast, by Manufacturing Process, 2017–2026
Table 149: GCC Aluminum Market Volume (Kilo Tons) Forecast, by Application, 2017–2026 (1/2)
Table 150: GCC Aluminum Market Volume (Kilo Tons) Forecast, by Application, 2017–2026 (2/2)
Table 151: GCC Aluminum Market Value (US$ Mn) Forecast, by Application, 2017–2026 (1/2)
Table 152: GCC Aluminum Market Value (US$ Mn) Forecast, by Application, 2017–2026 (2/2)
Table 153: South Africa Aluminum Market Volume (Kilo Tons) and Value (US$ Mn) Forecast, by Product Form, 2017–2026
Table 154: South Africa Aluminum Market Volume (Kilo Tons) and Value (US$ Mn) Forecast, by Manufacturing Process, 2017–2026
Table 155: South Africa Aluminum Market Volume (Kilo Tons) Forecast, by Application, 2017–2026 (1/2)
Table 156: South Africa Aluminum Market Volume (Kilo Tons) Forecast, by Application, 2017–2026 (2/2)
Table 157: South Africa Aluminum Market Value (US$ Mn) Forecast, by Application, 2017–2026 (1/2)
Table 158: South Africa Aluminum Market Value (US$ Mn) Forecast, by Application, 2017–2026 (2/2)
Table 159: Rest of Middle East & Africa Aluminum Market Volume (Kilo Tons) and Value (US$ Mn) Forecast, by Product Form, 2017–2026
Table 160: Rest of Middle East & Africa Aluminum Market Volume (Kilo Tons) and Value (US$ Mn) Forecast, by Manufacturing Process, 2017–2026
Table 161: Rest of Middle East & Africa Aluminum Market Volume (Kilo Tons) Forecast, by Application, 2017–2026 (1/2)
Table 162: Rest of Middle East & Africa Aluminum Market Volume (Kilo Tons) Forecast, by Application, 2017–2026 (2/2)
Table 163: Rest of Middle East & Africa Aluminum Market Value (US$ Mn) Forecast, by Application, 2017–2026 (1/2)
Table 164: Rest of Middle East & Africa Aluminum Market Value (US$ Mn) Forecast, by Application, 2017–2026 (2/2)
List of Figures
Figure 01: Global Aluminum Market Snapshot
Figure 02: Global Aluminum Market Volume Share, by Form, 2017
Figure 03: Global Aluminum Market Volume Share, by Manufacturing Process, 2017
Figure 04: Global Aluminum Market Volume Share, by Application, 2017
Figure 05: Global Aluminum Market Volume Share, by Region, 2017
Figure 06: Global Aluminum Market Share Analysis, by Company, 2017
Figure 07: Global Aluminum Market, Regional Production Output, 2017
Figure 08: Automotive Sales (Million Units), 2005–2015
Figure 09: Global Large Commercial Aircraft Delivery (Aircraft Units), 2013–2020
Figure 10: Global Aluminum Market Volume (Million Tons) and Size (US$ Bn) Analysis, 2017–2026
Figure 11: Global Aluminum Market Size and Volume,
Figure 12: Corporate Average Fuel Economy (CAFE) Standards for Passenger Cars and Light Trucks (Million per Gallon Equivalent)
Figure 13: Corporate Average Fuel Economy (CAFE) Standards for Different Geographies (Grams CO2 per Kilometer), 2000–2025
Figure 14: Global Aluminum Price Comparison, by Region, 2017 (US$/Ton)
Figure 15: Global Aluminum Price Comparison, by Application, 2017 (US$/Ton)
Figure 16: Production of Aluminum at Regional Level (Million Tons), 2017
Figure 17: Global Aluminum Market Volume Share Analysis, by Product Form, 2017 and 2026
Figure 18: Global Aluminum Market Volume (Kilo Tons) and Value (US$ Mn) Analysis, by Flat Products, 2017–2026
Figure 19: Global Aluminum Market Volume (Kilo Tons) and Value (US$ Mn) Analysis, by Long Products, 2017–2026
Figure 20: Global Aluminum Market Volume (Kilo Tons) and Value (US$ Mn) Analysis, by Forged Products, 2017–2026
Figure 21: Global Aluminum Market Volume (Kilo Tons) and Value (US$ Mn) Analysis, by Cast Products, 2017–2026
Figure 22: Global Aluminum Market Volume (Kilo Tons) and Value (US$ Mn) Analysis, by Other Products, 2017–2026
Figure 23: Global Aluminum Market Attractiveness Analysis, by Product Form
Figure 24: Global Aluminum Market Volume Share Analysis, by Manufacturing Process, 2017 and 2026
Figure 25: Global Aluminum Market Volume (Kilo Tons) and Value (US$ Mn) Analysis, by Aluminum Rolling, 2017–2026
Figure 26: Global Aluminum Market Volume (Kilo Tons) and Value (US$ Mn) Analysis, by Aluminum Extrusion, 2017–2026
Figure 27: Global Aluminum Market Volume (Kilo Tons) and Value (US$ Mn) Analysis, by Aluminum Forging, 2017–2026
Figure 28: Global Aluminum Market Volume (Kilo Tons) and Value (US$ Mn) Analysis, by Aluminum Casting, 2017–2026
Figure 29: Global Aluminum Market Volume (Kilo Tons) and Value (US$ Mn) Analysis, by Other Processes, 2017–2026
Figure 30: Global Aluminum Market Attractiveness Analysis, by Manufacturing Process
Figure 31: Global Aluminum Market Volume Share Analysis, by Application, 2017 and 2026
Figure 32: Global Aluminum Market Volume (Kilo Tons) and Value (US$ Mn) Analysis, by Aerospace & Defense, 2017–2026
Figure 33: Global Aluminum Market Volume (Kilo Tons) and Value (US$ Mn) Analysis, by Automotive, 2017–2026
Figure 34: Global Aluminum Market Volume (Kilo Tons) and Value (US$ Mn) Analysis, by Building & Construction, 2017–2026
Figure 35: Global Aluminum Market Volume (Kilo Tons) and Value (US$ Mn) Analysis, by Electrical & Electronics, 2017–2026
Figure 36: Global Aluminum Market Volume (Kilo Tons) and Value (US$ Mn) Analysis, by Foils & Packaging, 2017–2026
Figure 37: Global Aluminum Market Volume (Kilo Tons) and Value (US$ Mn) Analysis, by Industrial Machinery, 2017–2026
Figure 38: Global Aluminum Market Volume (Kilo Tons) and Value (US$ Mn) Analysis, by Other Applications, 2017–2026
Figure 39: Global Aluminum Market Attractiveness Analysis, by Application
Figure 40: Global Aluminum Market Volume Share Analysis, by Region, 2017 and 2026
Figure 41: Global Aluminum Market Attractiveness Analysis, by Region
Figure 42: North America Aluminum Market Size (US$ Mn) and Volume (Kilo Tons) Forecast, 2017–2026
Figure 43: North America Aluminum Market Volume Share Analysis, by Product Form, 2017 and 2026
Figure 44: North America Aluminum Market Volume Share Analysis, by Manufacturing Process, 2017 and 2026
Figure 45: North America Aluminum Market Volume Share Analysis, by Application, 2017 and 2026
Figure 46: North America Aluminum Market Volume Share Analysis, by Country, 2017 and 2026
Figure 47: North America Aluminum Market Attractiveness Analysis, by Application
Figure 48: North America Aluminum Market Attractiveness Analysis, by Country
Figure 49: Europe Aluminum Market Size (US$ Mn) and Volume (Kilo Tons) Forecast, 2017–2026
Figure 50: Europe Aluminum Market Volume Share Analysis, by Product Form, 2017 and 2026
Figure 51: Europe Aluminum Market Volume Share Analysis, by Manufacturing Process, 2017 and 2026
Figure 52: Europe Aluminum Market Volume Share Analysis, by Application, 2017 and 2026
Figure 53: Europe Aluminum Market Volume Share, by Country/Sub-region, 2017 and 2026
Figure 54: Europe Aluminum Market Attractiveness Analysis, by Application
Figure 55: Europe Aluminum Market Attractiveness Analysis, by Country/Sub-region
Figure 56: Asia Pacific Aluminum Market Size (US$ Mn) and Volume (Kilo Tons) Forecast, 2017–2026
Figure 57: Asia Pacific Aluminum Market Volume Share Analysis, by Product Form, 2017 and 2026
Figure 58: Asia Pacific Aluminum Market Volume Share Analysis, by Manufacturing Process, 2017 and 2026
Figure 59: Asia Pacific Aluminum Market Volume Share Analysis, by Application, 2017 and 2026
Figure 60: Asia Pacific Aluminum Market Volume Share Analysis, by Country/Sub-region, 2017 and 2026
Figure 61: Asia Pacific Aluminum Market Attractiveness Analysis, by Application
Figure 62: Asia Pacific Aluminum Market Attractiveness Analysis, by Country/Sub-region
Figure 63: Latin America Aluminum Market Size (US$ Mn) and Volume (Kilo Tons) Forecast, 2017–2026
Figure 64: Latin America Aluminum Market Volume Share Analysis, by Product Form, 2017 and 2026
Figure 65: Latin America Aluminum Market Volume Share Analysis, by Manufacturing Process, 2017 and 2026
Figure 66: Latin America Aluminum Market Volume Share Analysis, by Application, 2017 and 2026
Figure 67: Latin America Aluminum Market Volume Share Analysis, by Country/Sub-region, 2017 and 2026
Figure 68: Latin America Aluminum Market Attractiveness Analysis, by Application
Figure 69: Latin America Aluminum Market Attractiveness Analysis, by Country/Sub-region
Figure 70: Middle East & Africa Aluminum Market Size (US$ Mn) and Volume (Kilo Tons) Forecast, 2017–2026
Figure 71: Middle East & Africa Aluminum Market Volume Share Analysis, by Product Form, 2017 and 2026
Figure 72: Middle East & Africa Aluminum Market Volume Share Analysis, by Manufacturing Process, 2017 and 2026
Figure 73: Middle East & Africa Aluminum Market Volume Share Analysis, by Application, 2017 and 2026
Figure 74: Middle East & Africa Aluminum Market Volume Share Analysis, by Country/Sub-region, 2017 and 2026
Figure 75: Middle East & Africa Aluminum Market Attractiveness Analysis, by Application
Figure 76: Middle East & Africa Aluminum Market Attractiveness Analysis, by Country/Sub-region
Figure 77: Global Aluminum Market Share Analysis, by Company (2017)
Copyright © Transparency Market Research, Inc. All Rights reserved
Trust Online


Aluminum Market