
Analysts’ Viewpoint on Flexible Display Market Scenario
Companies operating in the flexible display market are focusing on high-growth end-use applications such as smartphones and computers and peripherals to keep their businesses growing post the COVID-19 pandemic. Flexible displays possess properties such as lightweight, thin as plastic, good durability, and they can be curved perfectly and used in several smart devices. Manufacturers of flexible displays are also focusing on current trends in the electronics sector such as the use of advanced materials, organic electronics, and miniaturization. They should tap into incremental opportunities in the flexible display technology to broaden their revenue streams.
A flexible display is a visual output display that can be bent, folded, and twisted, as opposed to the conventional flat screen displays used in several electronic devices. Several improvements have been witnessed in smartphone and tablet displays, such as flexible displays, in the last decade. Flexible displays are undoubtedly one of the most essential propositions and one with a huge potential to change the market. The technology is still relatively new, despite several companies exploring the technology for more than a decade.
Flexible batteries are also gaining recognition due to increasing usage in smart cards, wearable electronics, flexible displays, etc. A flexible display is also a rapidly growing technology; currently, it is gaining traction in various industries such as aerospace, media, and transportation. It also has applications in medical display systems.
The global flexible display market is driven by the rise in demand for the flexible display technology for several applications such as smart wearable devices, smartphones and tablets, and digital signage. The rising popularity of quantum dot (QD) display technology also offers revenue opportunities for manufacturers.
Request a sample to get extensive insights into the Flexible Display Market
The increasing usage of flexible displays in the consumer electronics sector for wearable devices, smartphones, computers, and peripherals is estimated to drive the segment during the forecast period. The requirement for very thin and flexible displays for these applications has prompted leading manufacturers to develop displays accordingly. For instance, Nubia, which specializes in smartphones and wearable products, announced the launch of a new smart wearable with a flexible AMOLED screen. This curved smartwatch includes various features such as health and sports tracking, phone notifications, etc.
The flexible AMOLED display for the Nubia watch is expected to offer a huge 4.01" color display that provides more information, superior visuals, and stunning panoramas. Increasing demand for the flexible screen is due to its beneficial properties as compared to traditional, rigid alternatives such as smaller size, lighter weight, portability, and high energy efficiency. Flexible displays contribute to the smartening of everyday objects.
The rising usage of flexible displays in various sectors such as automotive and transportation, aerospace and defense, media and entertainment, and consumer electronics is projected to drive the market over the next few years. The growing adoption of flexible displays for the development of smart displays and mobile devices is also a key factor that is estimated to boost the flexible display market during the forecast period. Furthermore, growing investments in the development of advanced displays has fueled the flexible display market.
Automobile companies are focusing on the integration of flexible displays in vehicle interiors. A much larger proportion of the car's interior surfaces is expected to become interactive over the next few years, and the surface area devoted to displays in vehicle interiors is already rapidly increasing. Curved displays can also be used as 'digital' side-view mirrors (in conjunction with cameras), thereby increasing safety by widening the field of view as compared to external side-view mirrors.
Growing autonomous trends in vehicles and rising middle-class income of people preferring smart devices in vehicles to increase safety and entertainment are key factors that are likely to drive the market over the next few years. LCDs are frequently the only flat surfaces existing in the vehicle, interrupting the form and flow of the interior space and limiting designers' ergonomic alternatives. Replacing these flat panel displays with screens that can adjust to the contour and curves of the vehicle interior would enable seamless integration and improve the interior esthetics of the vehicle.
Flexible flat panel displays can be used for various performance art applications, advertising, and decorative purposes in the media and entertainment industry. Some market participants such as Royole Corporation provide ‘RoLight’, a smart flexible advertising device that combines a high-definition flexible screen that can be used for display advertising and lighting or simply as a decorative piece. The company also offers ‘RoFlag’, a flexible desktop display comprising two fully flexible displays that are capable of displaying dynamic video. Favorable government regulations boosting the adoption of advanced technologies and technological advancements are also propelling the automotive industry, which in turn is fueling the demand for flexible displays.
Based on type, the global flexible display market has been segregated into curved displays, bendable and foldable displays, and rollable displays. The curved display segment held a prominent share of the market during the forecast period, owing to the rise in demand for curved displays from the consumer electronics industry for the development of smartphones and TVs. A flexible display is fundamentally similar to any other display, with the exception that it is constructed on a flexible substrate.
Flexible displays are typically lightweight, thin, and nearly shatter-proof. Curved, bendable, and foldable displays are occasionally discussed, which are, in concept, the same as flexible displays. Some of the key market participants also provide curved displays and contribute to the expansion of the market; for instance, LG Electronics developed a flexible curved open frame. Features of the product include 12.4 mm of depth, supported curvature up to 1,000r, and built-in power type.
Based on technology, the global flexible display has been classified into OLED, EPD, LCD, and others. OLED is a rapidly expanding segment of the global flexible electronics market. Smartphone displays are conventionally rigid due to the glass layer used in the production of displays. However, the latest OLED-based technology has removed the need for that, replacing thin layer of the flexible glass screen. The OLED display is currently popular due to its flexibility, and it is made of organic materials that emit light when electricity is passed between them. The screen of a display is then covered with a plastic thin layer, which, unfortunately, is susceptible to scratches.
Flexible OLED display is a new display technology that provides beautiful and energy-efficient displays & lighting panels. Flexible OLED screen is being utilized in smartphones, laptops, wearables, tablets, and televisions. The OLED display technology has been evolving for the last few decades due to its advantageous properties such as advanced image quality, good contrast, higher brightness, blacker blacks, a wider color range, fuller viewing angle, much faster refresh rates, lower power consumption, and better durability to operate in a wider temperature range. Several fitness brands have also adopted flexible PMOLED displays (Passive Matrix OLED) in smart wearable devices.
In terms of value, Asia Pacific held 34% share of the global flexible display market in 2021. The significant share was majorly attributed to high demand for flexible displays in the consumer electronics industry, which held a key share of the total consumption in Asia Pacific. China accounted for a notable share of the flexible display market in Asia Pacific.
North America and Europe are also prominent markets for flexible displays, and the regions held significant shares of the global market in 2021. Increased demand for flexible displays in automotive and aerospace industries in North America drives the market in the region.
The Middle East & Africa is a larger market for flexible displays as compared to Latin America; however, the market in Latin America is estimated to expand at a rapid pace as compared to the market in Middle East & Africa.
The global flexible display market is consolidated with a small number of large-scale vendors controlling majority share of the global market. Several firms are spending significantly on comprehensive research and development, and new product development. Diversification of product portfolios and mergers & acquisitions are major strategies adopted by key players.
Delta Electronics, FlexEnable Limited, Japan Display Inc., Koninklijke Philips N.V., LG Display, Microchip Technology Inc., Panasonic Corporation, Royole Corporation, SAMSUNG DISPLAY, Sharp Corporation, Sony Corporation, UNIVERSAL DISPLAY, and Visionox Company are the prominent entities operating in this market.
Each of these players has been profiled in the flexible display market report based on parameters such as company overview, financial overview, business strategies, product portfolio, business segments, and recent developments.
Request a custom report on Flexible Display Market
|
Attribute |
Detail |
|
Market Size Value in 2021 |
US$ 14.9 Bn |
|
Market Forecast Value in 2031 |
US$ 242.6 Bn |
|
Growth Rate (CAGR) |
33.1% |
|
Forecast Period |
2022–2031 |
|
Historical Data Available for |
2017–2020 |
|
Quantitative Units |
US$ Bn for Value ad Million Units for Volume |
|
Market Analysis |
It includes cross segment analysis at global as well as regional level. Furthermore, qualitative analysis includes drivers, restraints, opportunities, key trends, Porter’s Five Forces analysis, value chain analysis, and key trend analysis. |
|
Competition Landscape |
|
|
Format |
Electronic (PDF) + Excel |
|
Market Segmentation |
|
|
Regions Covered |
|
|
Countries Covered |
|
|
Companies Profiled |
|
|
Customization Scope |
Available upon request |
|
Pricing |
Available upon request |
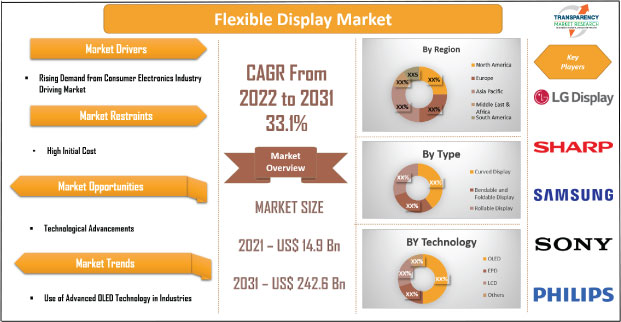
The market size of flexible displays stood at US$ 14.9 Bn in 2021
The flexible display market is expected to grow at a CAGR of 33.1% from 2022 to 2031
Growing demand from the consumer electronics industry and consumer inclination toward energy-efficient flexible gadgets are driving the flexible display market
The consumer electronics industry accounted for a key share of 29% of the flexible display market in 2021
Asia Pacific is a more attractive region for vendors in the flexible display market
Key players operating in the flexible display market include Delta Electronics, FlexEnable Limited, Japan Display Inc., Koninklijke Philips N.V., LG Display, Microchip Technology Inc., Panasonic Corporation, Royole Corporation, SAMSUNG DISPLAY, Sharp Corporation, Sony Corporation, UNIVERSAL DISPLAY, and Visionox Company
1. Preface
1.1. Market Introduction
1.2. Market and Segments Definition
1.3. Market Taxonomy
1.4. Research Methodology
1.5. Assumption and Acronyms
2. Executive Summary
2.1. Flexible Display Market Overview
2.2. Regional Outline
2.3. Industry Outline
2.4. Market Dynamics Snapshot
2.5. Competition Blueprint
3. Market Dynamics
3.1. Macro-economic Factors
3.2. Drivers
3.3. Restraints
3.4. Opportunities
3.5. Key Trends
3.6. Regulatory Framework
4. Associated Industry and Key Indicator Assessment
4.1. Parent Industry Overview – Global Sensors Industry Overview
4.2. Supply Chain Analysis
4.3. Pricing Analysis
4.4. Technology Roadmap Analysis
4.5. Industry SWOT Analysis
4.6. Porter Five Forces Analysis
4.7. Covid-19 Impact and Recovery Analysis
5. Flexible Display Market Analysis, by Type
5.1. Flexible Display Market Value (US$ Mn) and Volume (Million Units) Analysis & Forecast, by Type, 2017–2031
5.1.1. Curved Display
5.1.2. Bendable and Foldable Display
5.1.3. Rollable Display
5.2. Market Attractiveness Analysis, by Type
6. Flexible Display Market Analysis, by Technology
6.1. Flexible Display Market Value (US$ Mn) Analysis & Forecast, by Technology, 2017–2031
6.1.1. OLED
6.1.2. EPD
6.1.3. LCD
6.1.4. Others
6.2. Market Attractiveness Analysis, by Technology
7. Flexible Display Market Analysis, by Application
7.1. Flexible Display Market Value (US$ Mn) Analysis & Forecast, by Application, 2017–2031
7.1.1. Smartphone
7.1.2. Computer and Peripherals
7.1.3. Wearable Devices
7.1.4. Television
7.1.5. In Vehicle Display
7.1.6. Digital Signage
7.2. Market Attractiveness Analysis, by Application
8. Flexible Display Market Analysis, by Industry
8.1. Flexible Display Market Value (US$ Mn) Analysis & Forecast, by Industry, 2017–2031
8.1.1. Automotive and Transportation
8.1.2. Aerospace and Defense
8.1.3. Media and Entertainment
8.1.4. Consumer Electronics
8.1.5. IT and Telecommunication
8.1.6. Sports and Fashion
8.2. Market Attractiveness Analysis, by Industry
9. Flexible Display Market Analysis and Forecast, by Region
9.1. Flexible Display Market Value (US$ Mn) and Volume (Million Units) Analysis & Forecast, by Region, 2017–2031
9.1.1. North America
9.1.2. Europe
9.1.3. Asia Pacific
9.1.4. Middle East & Africa
9.1.5. South America
9.2. Market Attractiveness Analysis, by Region
10. North America Flexible Display Market Analysis and Forecast
10.1. Market Snapshot
10.2. Drivers and Restraints: Impact Analysis
10.3. Flexible Display Market Value (US$ Mn) and Volume (Million Units) Analysis & Forecast, by Type, 2017–2031
10.3.1. Curved Display
10.3.2. Bendable and Foldable Display
10.3.3. Rollable Display
10.4. Flexible Display Market Value (US$ Mn) Analysis & Forecast, by Technology, 2017–2031
10.4.1. OLED
10.4.2. EPD
10.4.3. LCD
10.4.4. Others
10.5. Flexible Display Market Value (US$ Mn) Analysis & Forecast, by Application, 2017–2031
10.5.1. Smartphone
10.5.2. Computer and Peripherals
10.5.3. Wearable Devices
10.5.4. Television
10.5.5. In Vehicle Display
10.5.6. Digital Signage
10.6. Flexible Display Market Value (US$ Mn) Analysis & Forecast, by Industry, 2017–2031
10.6.1. Automotive and Transportation
10.6.2. Aerospace and Defense
10.6.3. Media and Entertainment
10.6.4. Consumer Electronics
10.6.5. IT and Telecommunication
10.6.6. Sports and Fashion
10.7. Flexible Display Value (US$ Mn) and Volume (Million Units) Analysis & Forecast, by Country & Sub-region, 2017–2031
10.7.1. U.S.
10.7.2. Canada
10.7.3. Rest of North America
10.8. Market Attractiveness Analysis
10.8.1. By Type
10.8.2. By Technology
10.8.3. By Application
10.8.4. By Industry
10.8.5. By Country & Sub-region
11. Europe Flexible Display Market Analysis and Forecast
11.1. Market Snapshot
11.2. Drivers and Restraints: Impact Analysis
11.3. Flexible Display Market Value (US$ Mn) and Volume (Million Units) Analysis & Forecast, by Type, 2017–2031
11.3.1. Curved Display
11.3.2. Bendable and Foldable Display
11.3.3. Rollable Display
11.4. Flexible Display Market Value (US$ Mn) Analysis & Forecast, by Technology, 2017–2031
11.4.1. OLED
11.4.2. EPD
11.4.3. LCD
11.4.4. Others
11.5. Flexible Display Market Value (US$ Mn) Analysis & Forecast, by Application, 2017–2031
11.5.1. Smartphone
11.5.2. Computer and Peripherals
11.5.3. Wearable Devices
11.5.4. Television
11.5.5. In Vehicle Display
11.5.6. Digital Signage
11.6. Flexible Display Market Value (US$ Mn) Analysis & Forecast, by Industry, 2017–2031
11.6.1. Automotive and Transportation
11.6.2. Aerospace and Defense
11.6.3. Media and Entertainment
11.6.4. Consumer Electronics
11.6.5. IT and Telecommunication
11.6.6. Sports and Fashion
11.7. Flexible Display Value (US$ Mn) and Volume (Million Units) Analysis & Forecast, by Country & Sub-region, 2017–2031
11.7.1. The U.K.
11.7.2. Germany
11.7.3. France
11.7.4. Rest of Europe
11.8. Market Attractiveness Analysis
11.8.1. By Type
11.8.2. By Technology
11.8.3. By Application
11.8.4. By Industry
11.8.5. By Country & Sub-region
12. Asia Pacific Flexible Display Market Analysis and Forecast
12.1. Market Snapshot
12.2. Drivers and Restraints: Impact Analysis
12.3. Flexible Display Market Value (US$ Mn) and Volume (Million Units) Analysis & Forecast, by Type, 2017–2031
12.3.1. Curved Display
12.3.2. Bendable and Foldable Display
12.3.3. Rollable Display
12.4. Flexible Display Market Value (US$ Mn) Analysis & Forecast, by Technology, 2017–2031
12.4.1. OLED
12.4.2. EPD
12.4.3. LCD
12.4.4. Others
12.5. Flexible Display Market Value (US$ Mn) Analysis & Forecast, by Application, 2017–2031
12.5.1. Smartphone
12.5.2. Computer and Peripherals
12.5.3. Wearable Devices
12.5.4. Television
12.5.5. In Vehicle Display
12.5.6. Digital Signage
12.6. Flexible Display Market Value (US$ Mn) Analysis & Forecast, by Industry, 2017–2031
12.6.1. Automotive and Transportation
12.6.2. Aerospace and Defense
12.6.3. Media and Entertainment
12.6.4. Consumer Electronics
12.6.5. IT and Telecommunication
12.6.6. Sports and Fashion
12.7. Flexible Display Value (US$ Mn) and Volume (Million Units) Analysis & Forecast, by Country & Sub-region, 2017–2031
12.7.1. China
12.7.2. India
12.7.3. Japan
12.7.4. South Korea
12.7.5. ASEAN
12.7.6. Rest of Asia Pacific
12.8. Market Attractiveness Analysis
12.8.1. By Type
12.8.2. By Technology
12.8.3. By Application
12.8.4. By Industry
12.8.5. By Country & Sub-region
13. Middle East & Africa Flexible Display Market Analysis and Forecast
13.1. Market Snapshot
13.2. Drivers and Restraints: Impact Analysis
13.3. Flexible Display Market Value (US$ Mn) and Volume (Million Units) Analysis & Forecast, by Type, 2017–2031
13.3.1. Curved Display
13.3.2. Bendable and Foldable Display
13.3.3. Rollable Display
13.4. Flexible Display Market Value (US$ Mn) Analysis & Forecast, by Technology, 2017–2031
13.4.1. OLED
13.4.2. EPD
13.4.3. LCD
13.4.4. Others
13.5. Flexible Display Market Value (US$ Mn) Analysis & Forecast, by Application, 2017–2031
13.5.1. Smartphone
13.5.2. Computer and Peripherals
13.5.3. Wearable Devices
13.5.4. Television
13.5.5. In Vehicle Display
13.5.6. Digital Signage
13.6. Flexible Display Market Value (US$ Mn) Analysis & Forecast, by Industry, 2017–2031
13.6.1. Automotive and Transportation
13.6.2. Aerospace and Defense
13.6.3. Media and Entertainment
13.6.4. Consumer Electronics
13.6.5. IT and Telecommunication
13.6.6. Sports and Fashion
13.7. Flexible Display Value (US$ Mn) and Volume (Million Units) Analysis & Forecast, by Country & Sub-region, 2017–2031
13.7.1. GCC
13.7.2. South Africa
13.7.3. Rest of Middle East and Africa
13.8. Market Attractiveness Analysis
13.8.1. By Type
13.8.2. By Technology
13.8.3. By Application
13.8.4. By Industry
13.8.5. By Country & Sub-region
14. South America Flexible Display Market Analysis and Forecast
14.1. Market Snapshot
14.2. Drivers and Restraints: Impact Analysis
14.3. Flexible Display Market Value (US$ Mn) and Volume (Million Units) Analysis & Forecast, by Type, 2017–2031
14.3.1. Curved Display
14.3.2. Bendable and Foldable Display
14.3.3. Rollable Display
14.4. Flexible Display Market Value (US$ Mn) Analysis & Forecast, by Technology, 2017–2031
14.4.1. OLED
14.4.2. EPD
14.4.3. LCD
14.4.4. Others
14.5. Flexible Display Market Value (US$ Mn) Analysis & Forecast, by Application, 2017–2031
14.5.1. Smartphone
14.5.2. Computer and Peripherals
14.5.3. Wearable Devices
14.5.4. Television
14.5.5. In Vehicle Display
14.5.6. Digital Signage
14.6. Flexible Display Market Value (US$ Mn) Analysis & Forecast, by Industry, 2017–2031
14.6.1. Automotive and Transportation
14.6.2. Aerospace and Defense
14.6.3. Media and Entertainment
14.6.4. Consumer Electronics
14.6.5. IT and Telecommunication
14.6.6. Sports and Fashion
14.7. Flexible Display Value (US$ Mn) and Volume (Million Units) Analysis & Forecast, by Country & Sub-region, 2017–2031
14.7.1. Brazil
14.7.2. Rest of South America
14.8. Market Attractiveness Analysis
14.8.1. By Type
14.8.2. By Technology
14.8.3. By Application
14.8.4. By Industry
14.8.5. By Country & Sub-region
15. Competition Assessment
15.1. Global Flexible Display Market Competition Matrix - a Dashboard View
15.1.1. Global Flexible Display Market Company Share Analysis, by Value (2021)
15.1.2. Technological Differentiator
16. Company Profiles (Global Manufacturers/Suppliers)
16.1. Delta Electronics
16.1.1. Overview
16.1.2. Product Portfolio
16.1.3. Sales Footprint
16.1.4. Key Subsidiaries or Distributors
16.1.5. Strategy and Recent Developments
16.1.6. Key Financials
16.2. FlexEnable Limited
16.2.1. Overview
16.2.2. Product Portfolio
16.2.3. Sales Footprint
16.2.4. Key Subsidiaries or Distributors
16.2.5. Strategy and Recent Developments
16.2.6. Key Financials
16.3. Japan Display Inc.
16.3.1. Overview
16.3.2. Product Portfolio
16.3.3. Sales Footprint
16.3.4. Key Subsidiaries or Distributors
16.3.5. Strategy and Recent Developments
16.3.6. Key Financials
16.4. Koninklijke Philips N.V.
16.4.1. Overview
16.4.2. Product Portfolio
16.4.3. Sales Footprint
16.4.4. Key Subsidiaries or Distributors
16.4.5. Strategy and Recent Developments
16.4.6. Key Financials
16.5. LG Display
16.5.1. Overview
16.5.2. Product Portfolio
16.5.3. Sales Footprint
16.5.4. Key Subsidiaries or Distributors
16.5.5. Strategy and Recent Developments
16.5.6. Key Financials
16.6. Microchip Technology Inc.
16.6.1. Overview
16.6.2. Product Portfolio
16.6.3. Sales Footprint
16.6.4. Key Subsidiaries or Distributors
16.6.5. Strategy and Recent Developments
16.6.6. Key Financials
16.7. Panasonic Corporation
16.7.1. Overview
16.7.2. Product Portfolio
16.7.3. Sales Footprint
16.7.4. Key Subsidiaries or Distributors
16.7.5. Strategy and Recent Developments
16.7.6. Key Financials
16.8. Royole Corporation
16.8.1. Overview
16.8.2. Product Portfolio
16.8.3. Sales Footprint
16.8.4. Key Subsidiaries or Distributors
16.8.5. Strategy and Recent Developments
16.8.6. Key Financials
16.9. SAMSUNG DISPLAY
16.9.1. Overview
16.9.2. Product Portfolio
16.9.3. Sales Footprint
16.9.4. Key Subsidiaries or Distributors
16.9.5. Strategy and Recent Developments
16.9.6. Key Financials
16.10. Sharp Corporation
16.10.1. Overview
16.10.2. Product Portfolio
16.10.3. Sales Footprint
16.10.4. Key Subsidiaries or Distributors
16.10.5. Strategy and Recent Developments
16.10.6. Key Financials
16.11. Sony Corporation
16.11.1. Overview
16.11.2. Product Portfolio
16.11.3. Sales Footprint
16.11.4. Key Subsidiaries or Distributors
16.11.5. Strategy and Recent Developments
16.11.6. Key Financials
16.12. UNIVERSAL DISPLAY
16.12.1. Overview
16.12.2. Product Portfolio
16.12.3. Sales Footprint
16.12.4. Key Subsidiaries or Distributors
16.12.5. Strategy and Recent Developments
16.12.6. Key Financials
16.13. Visionox Company
16.13.1. Overview
16.13.2. Product Portfolio
16.13.3. Sales Footprint
16.13.4. Key Subsidiaries or Distributors
16.13.5. Strategy and Recent Developments
16.13.6. Key Financials
17. Recommendation
17.1. Opportunity Assessment
17.1.1. By Type
17.1.2. By Technology
17.1.3. By Application
17.1.4. By Industry
17.1.5. By Region
List of Tables
Table 1: Global Flexible Display Market Value (US$ Mn) & Forecast, by Type, 2017‒2031
Table 2: Global Flexible Display Market Volume (Million Units) & Forecast, by Type, 2017‒2031
Table 3: Global Flexible Display Market Value (US$ Mn) & Forecast, by Technology, 2017‒2031
Table 4: Global Flexible Display Market Volume (Million Units) & Forecast, by Technology 2017‒2031
Table 5: Global Flexible Display Market Value (US$ Mn) & Forecast, by Application 2017‒2031
Table 6: Global Flexible Display Market Volume (Million Units) & Forecast, by Application, 2017‒2031
Table 7: Global Flexible Display Market Value (US$ Mn) & Forecast, by Industry, 2017‒2033
Table 8: Global Flexible Display Market Value (US$ Mn) & Forecast, by Region, 2017‒2031
Table 9: Global Flexible Display Market Volume (Million Units) & Forecast, by Region, 2017‒2031
Table 10: North America Flexible Display Market Value (US$ Mn) & Forecast, by Type, 2017‒2031
Table 11: North America Flexible Display Market Volume (Million Units) & Forecast, by Type, 2017‒2031
Table 12: North America Flexible Display Market Value (US$ Mn) & Forecast, by Technology, 2017‒2031
Table 13: North America Flexible Display Market Volume (Million Units) & Forecast, by Technology 2017‒2031
Table 14: North America Flexible Display Market Value (US$ Mn) & Forecast, by Application 2017‒2031
Table 15: North America Flexible Display Market Volume (Million Units) & Forecast, by Application, 2017‒2031
Table 16: North America Flexible Display Market Value (US$ Mn) & Forecast, by Industry, 2017‒2033
Table 17: North America Flexible Display Market Value (US$ Mn) & Forecast, by Region, 2017‒2031
Table 18: North America Flexible Display Market Volume (Million Units) & Forecast, by Region, 2017‒2031
Table 19: Europe Flexible Display Market Value (US$ Mn) & Forecast, by Type, 2017‒2031
Table 20: Europe Flexible Display Market Volume (Million Units) & Forecast, by Type, 2017‒2031
Table 21: Europe Flexible Display Market Value (US$ Mn) & Forecast, by Technology, 2017‒2031
Table 22: Europe Flexible Display Market Volume (Million Units) & Forecast, by Technology 2017‒2031
Table 23: Europe Flexible Display Market Value (US$ Mn) & Forecast, by Application 2017‒2031
Table 24: Europe Flexible Display Market Volume (Million Units) & Forecast, by Application, 2017‒2031
Table 25: Europe Flexible Display Market Value (US$ Mn) & Forecast, by Industry, 2017‒2033
Table 26: Europe Flexible Display Market Value (US$ Mn) & Forecast, by Country & Sub-region, 2017‒2031
Table 27: Europe Flexible Display Market Volume (Million Units) & Forecast, by Country & Sub-region, 2017‒2031
Table 28: Asia Pacific Flexible Display Market Value (US$ Mn) & Forecast, by Type, 2017‒2031
Table 29: Asia Pacific Flexible Display Market Volume (Million Units) & Forecast, by Type, 2017‒2031
Table 30: Asia Pacific Flexible Display Market Value (US$ Mn) & Forecast, by Technology, 2017‒2031
Table 31: Asia Pacific Flexible Display Market Volume (Million Units) & Forecast, by Technology 2017‒2031
Table 32: Asia Pacific Flexible Display Market Value (US$ Mn) & Forecast, by Application 2017‒2031
Table 33: Asia Pacific Flexible Display Market Volume (Million Units) & Forecast, by Application, 2017‒2031
Table 34: Asia Pacific Flexible Display Market Value (US$ Mn) & Forecast, by Industry, 2017‒2033
Table 35: Asia Pacific Flexible Display Market Value (US$ Mn) & Forecast, by Country & Sub-region, 2017‒2031
Table 36: Asia Pacific Flexible Display Market Volume (Million Units) & Forecast, by Country & Sub-region, 2017‒2031
Table 37: MEA Flexible Display Market Value (US$ Mn) & Forecast, by Type, 2017‒2031
Table 38: MEA Flexible Display Market Volume (Million Units) & Forecast, by Type, 2017‒2031
Table 39: MEA Flexible Display Market Value (US$ Mn) & Forecast, by Technology, 2017‒2031
Table 40: MEA Flexible Display Market Volume (Million Units) & Forecast, by Technology 2017‒2031
Table 41: MEA Flexible Display Market Value (US$ Mn) & Forecast, by Application 2017‒2031
Table 42: MEA Flexible Display Market Volume (Million Units) & Forecast, by Application, 2017‒2031
Table 43: MEA Flexible Display Market Value (US$ Mn) & Forecast, by Industry, 2017‒2033
Table 44: MEA Flexible Display Market Value (US$ Mn) & Forecast, by Country & Sub-region, 2017‒2031
Table 45: MEA Flexible Display Market Volume (Million Units) & Forecast, by Country & Sub-region, 2017‒2031
Table 46: South America Flexible Display Market Value (US$ Mn) & Forecast, by Type, 2017‒2031
Table 47: South America Flexible Display Market Volume (Million Units) & Forecast, by Type, 2017‒2031
Table 48: South America Flexible Display Market Value (US$ Mn) & Forecast, by Technology, 2017‒2031
Table 49: South America Flexible Display Market Volume (Million Units) & Forecast, by Technology 2017‒2031
Table 50: South America Flexible Display Market Value (US$ Mn) & Forecast, by Application 2017‒2031
Table 51: South America Flexible Display Market Volume (Million Units) & Forecast, by Application, 2017‒2031
Table 52: South America Flexible Display Market Value (US$ Mn) & Forecast, by Industry, 2017‒2033
Table 53: South America Flexible Display Market Value (US$ Mn) & Forecast, by Country & Sub-region, 2017‒2031
Table 54: South America Flexible Display Market Volume (Million Units) & Forecast, by Country & Sub-region, 2017‒2031
List of Figures
Figure 01: Global Flexible Display Market Size & Forecast, Value (US$ Mn), 2017‒2031
Figure 02: Global Flexible Display Market Size & Forecast, Y-O-Y, Value (US$ Mn), 2017‒2031
Figure 03: Global Flexible Display Market Size & Forecast, Volume (Million Units), 2017‒2031
Figure 04: Global Flexible Display Market Size & Forecast, Y-O-Y, Volume (Million Units), 2017‒2031
Figure 05: Global Flexible Display Market Projections by Type, Value (US$ Mn), 2017‒2031
Figure 06: Global Flexible Display Market Share Analysis, by Type, 2021 and 2031
Figure 07: Global Flexible Display Market, Incremental Opportunity, by Type, 2022‒2031
Figure 08: Global Flexible Display Market Projections by Technology, Value (US$ Mn), 2017‒2031
Figure 09: Global Flexible Display Market Share Analysis, by Technology, 2021 and 2031
Figure 10: Global Flexible Display Market, Incremental Opportunity, by Technology, 2022‒2031
Figure 11: Global Flexible Display Market Projections by Application, Value (US$ Mn), 2017‒2031
Figure 12: Global Flexible Display Market Share Analysis, by Application, 2021 and 2031
Figure 13: Global Flexible Display Market, Incremental Opportunity, by Application, 2022‒2031
Figure 14: Global Flexible Display Market Projections by Industry, Value (US$ Mn), 2017‒2031
Figure 15: Global Flexible Display Market Share Analysis, by Industry, 2021 and 2031
Figure 16: Global Flexible Display Market, Incremental Opportunity, by Industry, 2022‒2031
Figure 17: Global Flexible Display Market Projections by Country & Sub-region, Value (US$ Mn), 2017‒2031
Figure 18: Global Flexible Display Market Share Analysis, by Country & Sub-region, 2021 and 2031
Figure 19: Global Flexible Display Market, Incremental Opportunity, by Country & Sub-region, 2022‒2031
Figure 20: North America Flexible Display Market Size & Forecast, Value (US$ Mn), 2017‒2031
Figure 21: North America Flexible Display Market Size & Forecast, Y-O-Y, Value (US$ Mn), 2017‒2031
Figure 22: North America Flexible Display Market Size & Forecast, Volume (Million Units), 2017‒2031
Figure 23: North America Flexible Display Market Size & Forecast, Y-O-Y, Volume (Million Units), 2017‒2031
Figure 24: North America Flexible Display Market Projections by Type, Value (US$ Mn), 2017‒2031
Figure 25: North America Flexible Display Market Share Analysis, by Type, 2021 and 2031
Figure 26: North America Flexible Display Market, Incremental Opportunity, by Type, 2022‒2031
Figure 27: North America Flexible Display Market Projections by Technology, Value (US$ Mn), 2017‒2031
Figure 28: North America Flexible Display Market Share Analysis, by Technology, 2021 and 2031
Figure 29: North America Flexible Display Market, Incremental Opportunity, by Technology, 2022‒2031
Figure 30: North America Flexible Display Market Projections by Application, Value (US$ Mn), 2017‒2031
Figure 31: North America Flexible Display Market Share Analysis, by Application, 2021 and 2031
Figure 32: North America Flexible Display Market, Incremental Opportunity, by Application, 2022‒2031
Figure 33: North America Flexible Display Market Projections by Industry, Value (US$ Mn), 2017‒2031
Figure 34: North America Flexible Display Market Share Analysis, by Industry, 2021 and 2031
Figure 35: North America Flexible Display Market, Incremental Opportunity, by Industry, 2022‒2031
Figure 36: North America Flexible Display Market Projections by Country & Sub-region, Value (US$ Mn), 2017‒2031
Figure 37: North America Flexible Display Market Share Analysis, by Country & Sub-region, 2021 and 2031
Figure 38: North America Flexible Display Market, Incremental Opportunity, by Country & Sub-region, 2022‒2031
Figure 39: Europe Flexible Display Market Size & Forecast, Value (US$ Mn), 2017‒2031
Figure 40: Europe Flexible Display Market Size & Forecast, Y-O-Y, Value (US$ Mn), 2017‒2031
Figure 41: Europe Flexible Display Market Size & Forecast, Volume (Million Units), 2017‒2031
Figure 42: Europe Flexible Display Market Size & Forecast, Y-O-Y, Volume (Million Units), 2017‒2031
Figure 43: Europe Flexible Display Market Projections by Type, Value (US$ Mn), 2017‒2031
Figure 44: Europe Flexible Display Market Share Analysis, by Type, 2021 and 2031
Figure 45: Europe Flexible Display Market, Incremental Opportunity, by Type, 2022‒2031
Figure 46: Europe Flexible Display Market Projections by Technology, Value (US$ Mn), 2017‒2031
Figure 47: Europe Flexible Display Market Share Analysis, by Technology, 2021 and 2031
Figure 48: Europe Flexible Display Market, Incremental Opportunity, by Technology, 2022‒2031
Figure 49: Europe Flexible Display Market Projections by Application, Value (US$ Mn), 2017‒2031
Figure 50: Europe Flexible Display Market Share Analysis, by Application, 2021 and 2031
Figure 51: Europe Flexible Display Market, Incremental Opportunity, by Application, 2022‒2031
Figure 52: Europe Flexible Display Market Projections by Industry, Value (US$ Mn), 2017‒2031
Figure 53: Europe Flexible Display Market Share Analysis, by Industry, 2021 and 2031
Figure 54: Europe Flexible Display Market, Incremental Opportunity, by Industry, 2022‒2031
Figure 55: Europe Flexible Display Market Projections by Country & Sub-region, Value (US$ Mn), 2017‒2031
Figure 56: Europe Flexible Display Market Share Analysis, by Country & Sub-region, 2021 and 2031
Figure 57: Europe Flexible Display Market, Incremental Opportunity, by Country & Sub-region, 2022‒2031
Figure 58: Asia Pacific Flexible Display Market Size & Forecast, Value (US$ Mn), 2017‒2031
Figure 59: Asia Pacific Flexible Display Market Size & Forecast, Y-O-Y, Value (US$ Mn), 2017‒2031
Figure 60: Asia Pacific Flexible Display Market Size & Forecast, Volume (Million Units), 2017‒2031
Figure 61: Asia Pacific Flexible Display Market Size & Forecast, Y-O-Y, Volume (Million Units), 2017‒2031
Figure 62: Asia Pacific Flexible Display Market Projections by Type, Value (US$ Mn), 2017‒2031
Figure 63: Asia Pacific Flexible Display Market Share Analysis, by Type, 2021 and 2031
Figure 64: Asia Pacific Flexible Display Market, Incremental Opportunity, by Type, 2022‒2031
Figure 65: Asia Pacific Flexible Display Market Projections by Technology, Value (US$ Mn), 2017‒2031
Figure 66: Asia Pacific Flexible Display Market Share Analysis, by Technology, 2021 and 2031
Figure 67: Asia Pacific Flexible Display Market, Incremental Opportunity, by Technology, 2022‒2031
Figure 68: Asia Pacific Flexible Display Market Projections by Application, Value (US$ Mn), 2017‒2031
Figure 69: Asia Pacific Flexible Display Market Share Analysis, by Application, 2021 and 2031
Figure 70: Asia Pacific Flexible Display Market, Incremental Opportunity, by Application, 2022‒2031
Figure 71: Asia Pacific Flexible Display Market Projections by Industry, Value (US$ Mn), 2017‒2031
Figure 72: Asia Pacific Flexible Display Market Share Analysis, by Industry, 2021 and 2031
Figure 73: Asia Pacific Flexible Display Market, Incremental Opportunity, by Industry, 2022‒2031
Figure 74: Asia Pacific Flexible Display Market Projections by Country & Sub-region, Value (US$ Mn), 2017‒2031
Figure 75: Asia Pacific Flexible Display Market Share Analysis, by Country & Sub-region, 2021 and 2031
Figure 76: Asia Pacific Flexible Display Market, Incremental Opportunity, by Country & Sub-region, 2022‒2031
Figure 77: MEA Flexible Display Market Size & Forecast, Value (US$ Mn), 2017‒2031
Figure 78: MEA Flexible Display Market Size & Forecast, Y-O-Y, Value (US$ Mn), 2017‒2031
Figure 79: MEA Flexible Display Market Size & Forecast, Volume (Million Units), 2017‒2031
Figure 80: MEA Flexible Display Market Size & Forecast, Y-O-Y, Volume (Million Units), 2017‒2031
Figure 81: MEA Flexible Display Market Projections by Type, Value (US$ Mn), 2017‒2031
Figure 82: MEA Flexible Display Market Share Analysis, by Type, 2021 and 2031
Figure 83: MEA Flexible Display Market, Incremental Opportunity, by Type, 2022‒2031
Figure 84: MEA Flexible Display Market Projections by Technology, Value (US$ Mn), 2017‒2031
Figure 85: MEA Flexible Display Market Share Analysis, by Technology, 2021 and 2031
Figure 86: MEA Flexible Display Market, Incremental Opportunity, by Technology, 2022‒2031
Figure 87: MEA Flexible Display Market Projections by Application, Value (US$ Mn), 2017‒2031
Figure 88: MEA Flexible Display Market Share Analysis, by Application, 2021 and 2031
Figure 89: MEA Flexible Display Market, Incremental Opportunity, by Application, 2022‒2031
Figure 90: MEA Flexible Display Market Projections by Industry, Value (US$ Mn), 2017‒2031
Figure 91: MEA Flexible Display Market Share Analysis, by Industry, 2021 and 2031
Figure 92: MEA Flexible Display Market, Incremental Opportunity, by Industry, 2022‒2031
Figure 93: MEA Flexible Display Market Projections by Country & Sub-region, Value (US$ Mn), 2017‒2031
Figure 94: MEA Flexible Display Market Share Analysis, by Country & Sub-region, 2021 and 2031
Figure 95: MEA Flexible Display Market, Incremental Opportunity, by Country & Sub-region, 2022‒2031
Figure 96: South America Flexible Display Market Size & Forecast, Value (US$ Mn), 2017‒2031
Figure 97: South America Flexible Display Market Size & Forecast, Y-O-Y, Value (US$ Mn), 2017‒2031
Figure 98: South America Flexible Display Market Size & Forecast, Volume (Million Units), 2017‒2031
Figure 99: South America Flexible Display Market Size & Forecast, Y-O-Y, Volume (Million Units), 2017‒2031
Figure 100: South America Flexible Display Market Projections by Type, Value (US$ Mn), 2017‒2031
Figure 101: South America Flexible Display Market Share Analysis, by Type, 2021 and 2031
Figure 102: South America Flexible Display Market, Incremental Opportunity, by Type, 2022‒2031
Figure 103: South America Flexible Display Market Projections by Technology, Value (US$ Mn), 2017‒2031
Figure 104: South America Flexible Display Market Share Analysis, by Technology, 2021 and 2031
Figure 105: South America Flexible Display Market, Incremental Opportunity, by Technology, 2022‒2031
Figure 106: South America Flexible Display Market Projections by Application, Value (US$ Mn), 2017‒2031
Figure 107: South America Flexible Display Market Share Analysis, by Application, 2021 and 2031
Figure 108: South America Flexible Display Market, Incremental Opportunity, by Application, 2022‒2031
Figure 109: South America Flexible Display Market Projections by Industry, Value (US$ Mn), 2017‒2031
Figure 110: South America Flexible Display Market Share Analysis, by Industry, 2021 and 2031
Figure 111: South America Flexible Display Market, Incremental Opportunity, by Industry, 2022‒2031
Figure 112: South America Flexible Display Market Projections by Country & Sub-region, Value (US$ Mn), 2017‒2031
Figure 113: South America Flexible Display Market Share Analysis, by Country & Sub-region, 2021 and 2031
Figure 114: South America Flexible Display Market, Incremental Opportunity, by Country & Sub-region, 2022‒2031
Copyright © Transparency Market Research, Inc. All Rights reserved
Trust Online


Flexible Display Market