
The global tall oil fatty acid market is likely to rise due to steadily increasing demand for lubricants and drilling fluids, as well as an increase in demand for rubber goods in the region's automotive industry. In the forthcoming years, the global tall oil fatty acid market is likely to benefit from increasing product demand as a corrosion inhibitor, viscosity modifier, and lubricant in the oilfield industry. Iraq, the United Arab Emirates, Iran, Kuwait, and Saudi Arabia account for more than a quarter of world petroleum output, which is expected to expand by several times in the near future. In the coming years, there is an increasing preference for plant-derived chemicals over animal-derived ones is estimated to boost overall demand in the market.
Low penetration of the market and substantial lack of knowledge in the Asia Pacific region is estimated to stymie global tall oil fatty acid market in the foreseeable period. The presence of replacement goods such as coconut oil-based fatty acids and palm oil in the region, as well as a lack of quality in raw materials, is likely to have a detrimental influence on the global market.
Dimer acids are expected to create considerable income and its use is estimated to rise at a rapid rate in the next few years to come. It is basically an intermediate chemical that is widely used as a fuel additive in lubricants and oilfields. In the forthcoming years, the oilfield industry in North America is estimated to be an important factor for the expansion of this application area.
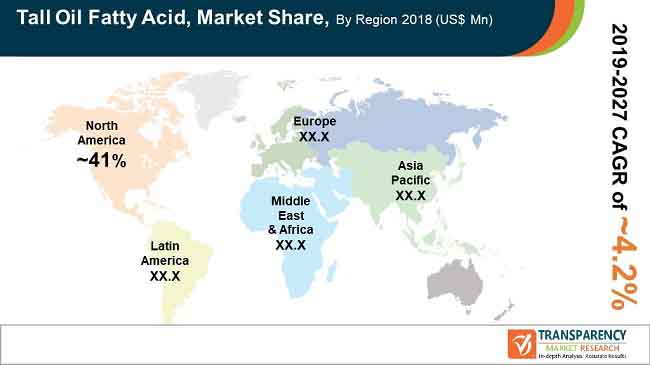
The regional industrial developments are likely to be characterized by the easy availability of raw resources and the lack of replacements in this region. Increasing production of crude oil in the Gulf of Mexico, as well as shale gas development in the US, is estimated to boost the regional market in the coming years.
Due to rising awareness in the country, the Asia Pacific tall oil fatty acid market is expected to develop at a substantial rate. Other plant-extracted fatty acid alternatives may compete with the regional sector, but a growing desire for plant-derived goods is expected open up new market opportunities.
To gauge the scope of customization in our reports Ask for a Sample
Get an idea about the offerings of our report from Report Brochure
Looking for Regional Analysis or Competitive Landscape in Tall Oil Fatty Acid Market, ask for a customized report
Global Tall Oil Fatty Acid Market – Segmentation
TMR’s research study segments the global tall oil fatty acid market in terms of product, application, end user, and region. This report presents extensive market dynamics and growth trends associated with different segments and explains how they are influencing the growth of the global tall oil fatty acid market.
|
Type |
Oleic acid Linoleic acid Others (Including linoleic acid, maleic acid, and stearic acid) |
|
Application |
Dimer acid Alkyd resin Fatty acid ester Others (Including dimer acid and fatty acid soaps) |
|
End User |
Soap & detergents Coatings Lubricants Plastics Fuel additives Metal working fluid Others (Including adhesives, asphalt additives, and biofuel) |
|
Region |
North America Europe Asia Pacific Latin America Middle East & Africa |
Chapter 1. Preface
1.1. Research Description
1.2. Market Segmentation
1.2.1. Global Tall Oil Fatty Acid Market, Segmentation by Product Segments, Applications, End-users, and Regions
1.3. Research Scope
1.3.1. Assumptions
1.4. Research Methodology
1.4.1. Abbreviations
Chapter 2. Executive Summary
2.1. Global Tall Oil Fatty Acid Market, 2018 – 2027 (Kilo Tons) (US$ Mn)
Chapter 3. Tall Oil Fatty Acid Market - Industry Analysis
3.1. Introduction
3.2. Value Chain Analysis
3.3. Market Drivers
3.3.1. Demand for Oleic Acid in North America Shapes Demand for TOFA
3.3.1.1. U.S. Crude Oil Production per Day (2015-2018)
3.3.2. Demand Generated by Soaps & Detergents and Coatings Applications has Traditionally Buoyed TOFA Market
3.3.2.1. Global Cleaning Products Industry Revenue (US$ Bn) (2018 – 2027)
3.3.2.2. Global Paints & Coatings Industry Revenue (US$ Bn) (2018 – 2027)
3.4. Market Restraints
3.4.1. Low Market Penetration in Asia Pacific Region
3.5. Market Opportunities
3.5.1. Biodiesel production from TOFA based feedstock offers opportunities to TOFA Market
3.5.2. Shifting market preference for tall oil fatty acid from tallow oil fatty acid in North America and Europe
3.6. Porter’s Five Forces Analysis
3.6.1. Bargaining Power of Suppliers
3.6.2. Bargaining Power of Buyers
3.6.3. Threat of New Entrants
3.6.4. Threat of Substitutes
3.6.5. Degree of Competition
3.7. Global Tall Oil Fatty Acid - Market Attractiveness Analysis
3.7.1. Global Tall Oil Fatty Acid - Market Attractiveness Analysis, 2018
3.8. Global Tall Oil Fatty Acid Market - Company Market Share Analysis
3.8.1. Global TOFA Market: Company Market Share Analysis, 2018
3.9. Integration in TOFA Industry
Chapter 4. Tall Oil Fatty Acid Market – Raw Material & Price Analysis
4.1. Global Tall Oil Fatty Acid Market: Technical Overview
4.2. Tall Oil Formulations in Alkyd Resins
4.3. Tall Oil Formulations in Dimer Acid
4.4. Tall Oil Formulations in Fatty Acid Esters
4.5. Global Tall Oil Fatty Acid Market: Raw Material Price Trend Analysis
Chapter 5. Tall Oil Fatty Acid Market – Product Segment Analysis
5.1. Global Tall Oil Fatty Acid Market: Product Overview
5.1.1. Global Tall Oil Fatty Acid Market, Volume Share, by Product Segment, 2018 – 2027
5.2. Oleic Acid
5.2.1. Global Market of Tall Oil Fatty Acid for Oleic Acid, 2018 – 2027 (Kilo Tons) (US$ Mn)
5.3. Linoleic Acid
5.3.1. Global Market of Tall Oil Fatty Acid for Linoleic Acid, 2018 – 2027 (Kilo Tons) (US$ Mn)
5.4. Others
5.4.1. Global Market of Tall Oil Fatty Acid for Others, 2018 – 2027 (Kilo Tons) (US$ Mn)
Chapter 6. Tall Oil Fatty Acid Market – Application Analysis
6.1. Global Tall Oil Fatty Acid Market: Application Overview
6.1.1. Global Tall Oil Fatty Acid Market, Volume Share, by Application, 2018 – 2027
6.2. Dimer Acids
6.2.1. Global Market of Tall Oil Fatty Acid for Dimer Acids, 2018 – 2027 (Kilo Tons) (US$ Mn)
6.3. Alkyd Resins
6.3.1. Global Market of Tall Oil Fatty Acid for Alkyd Resins, 2018 – 2027 (Kilo Tons) (US$ Mn)
6.4. Fatty Acid Esters
6.4.1. Global Market of Tall Oil Fatty Acid for Fatty Acid Esters, 2018 – 2027 (Kilo Tons) (US$ Mn)
6.5. Others
6.5.1. Global Market of Tall Oil Fatty Acid for Other Applications, 2018 – 2027 (Kilo Tons) (US$ Mn)
Chapter 7. Tall Oil Fatty Acid Market – End-user Analysis
7.1. Global Tall Oil Fatty Acid Market: End-user Overview
7.1.1. Global Tall Oil Fatty Acid Market, Volume Share, by End-user, 2018 – 2027
7.2. Soaps & detergents
7.2.1. Global Market for Tall Oil Fatty Acid for Soaps & detergents, 2018 – 2027 (Kilo Tons) (US$ Mn)
7.3. Coatings
7.3.1. Global Market for Tall Oil Fatty Acid for Coatings, 2018 – 2027 (Kilo Tons) (US$ Mn)
7.4. Lubricants
7.4.1. Global Market for Tall Oil Fatty Acid for Lubricants, 2018 – 2027 (Kilo Tons) (US$ Mn)
7.5. Plastics
7.5.1. Global Market for Tall Oil Fatty Acid for Plastics, 2018 – 2027 (Kilo Tons) (US$ Mn)
7.6. Fuel Additives
7.6.1. Global Market for Tall Oil Fatty Acid for Fuel Additives, 2018 – 2027 (Kilo Tons) (US$ Mn
7.7. Metal Working Fluid
7.7.1. Global Market for Tall Oil Fatty Acid for Metal Working Fluid, 2018 – 2027 (Kilo Tons) (US$ Mn)
7.8. Others
7.8.1. Global Market for Tall Oil Fatty Acid for Other Applications, 2018 – 2027 (Kilo Tons) (US$ Mn)
Chapter 8. Tall Oil Fatty Acid Market – Regional Analysis
8.1. Global Tall Oil Fatty Acid Market: Regional Overview
8.1.1. Global Tall Oil Fatty Acid Market, Volume Share, by Region, 2018 – 2027
8.2. Industry Operating Rate
8.3. North America
8.3.1. North America Tall Oil Fatty Acid Market, Volume by Application, 2018 – 2027 (Kilo Tons)
8.3.2. North America Tall Oil Fatty Acid Market, Revenue by Application, 2018 – 2027 (US$ Mn)
8.3.3. North America Tall Oil Fatty Acid Market, Volume by Product Segment, 2018 – 2027 (Kilo Tons)
8.3.4. North America Tall Oil Fatty Acid Market, Revenue by Product Segment, 2018 – 2027 (US$ Mn)
8.3.5. North America Tall Oil Fatty Acid Market, Volume by End User, 2018 – 2027 (Kilo Tons)
8.3.6. North America Tall Oil Fatty Acid Market, Revenue by End User, 2018 – 2027 (US$ Mn)
8.3.7. U.S.
8.3.7.1. U.S. Tall Oil Fatty Acid Market, Volume by Application, 2018 – 2027 (Kilo Tons)
8.3.7.2. U.S. Tall Oil Fatty Acid Market, Revenue by Application, 2018 – 2027 (US$ Mn)
8.3.7.3. U.S. Tall Oil Fatty Acid Market, Volume by Product Segment, 2018 – 2027 (Kilo Tons)
8.3.7.4. U.S. Tall Oil Fatty Acid Market, Revenue by Product Segment, 2018 – 2027 (US$ Mn)
8.3.7.5. U.S. Tall Oil Fatty Acid Market, Volume by End User, 2018 – 2027 (Kilo Tons)
8.3.7.6. U.S. Tall Oil Fatty Acid Market, Revenue by End User, 2018 – 2027 (US$ Mn)
8.3.8. Rest of North America
8.3.8.1. Rest of North America Tall Oil Fatty Acid Market, Volume by Application, 2018 – 2027 (Kilo Tons)
8.3.8.2. Rest of North America Tall Oil Fatty Acid Market, Revenue by Application, 2018 – 2027 (US$ Mn)
8.3.8.3. Rest of North America Tall Oil Fatty Acid Market, Volume by Product Segment, 2018 – 2027 (Kilo Tons)
8.3.8.4. Rest of North America Tall Oil Fatty Acid Market, Revenue by Product Segment, 2018 – 2027 (US$ Mn)
8.3.8.5. Rest of North America Tall Oil Fatty Acid Market, Volume by End User, 2018 – 2027 (Kilo Tons)
8.3.8.6. Rest of North America Tall Oil Fatty Acid Market, Revenue by End User, 2018 – 2027 (US$ Mn)
8.4. Europe
8.4.1. Europe Tall Oil Fatty Acid Market, Volume by Application, 2018 – 2027 (Kilo Tons)
8.4.2. Europe Tall Oil Fatty Acid Market, Revenue by Application, 2018 – 2027 (US$ Mn)
8.4.3. Europe Tall Oil Fatty Acid Market, Volume by Product Segment, 2018 – 2027 (Kilo Tons)
8.4.4. Europe Tall Oil Fatty Acid Market, Revenue by Product Segment, 2018 – 2027 (US$ Mn)
8.4.5. Europe Tall Oil Fatty Acid Market, Volume by End User, 2018 – 2027 (Kilo Tons)
8.4.6. Europe Tall Oil Fatty Acid Market, Revenue by End User, 2018 – 2027 (US$ Mn)
8.4.7. Sweden
8.4.7.1. Sweden Tall Oil Fatty Acid Market, Volume by Application, 2018 – 2027 (Kilo Tons)
8.4.7.2. Sweden Tall Oil Fatty Acid Market, Revenue by Application, 2018 – 2027 (US$ Mn)
8.4.7.3. Sweden Tall Oil Fatty Acid Market, Volume by Product Segment, 2018 – 2027 (Kilo Tons)
8.4.7.4. Sweden Tall Oil Fatty Acid Market, Revenue by Product Segment, 2018 – 2027 (US$ Mn)
8.4.7.5. Sweden Tall Oil Fatty Acid Market, Volume by End User, 2018 – 2027 (Kilo Tons)
8.4.7.6. Sweden Tall Oil Fatty Acid Market, Revenue by End User, 2018 – 2027 (US$ Mn)
8.4.8. Finland
8.4.8.1. Finland Tall Oil Fatty Acid Market, Volume by Application, 2018 – 2027 (Kilo Tons)
8.4.8.2. Finland Tall Oil Fatty Acid Market, Revenue by Application, 2018 – 2027 (US$ Mn)
8.4.8.3. Finland Tall Oil Fatty Acid Market, Volume by Product Segment, 2018 – 2027 (Kilo Tons)
8.4.8.4. Finland Tall Oil Fatty Acid Market, Revenue by Product Segment, 2018 – 2027 (US$ Mn)
8.4.8.5. Finland Tall Oil Fatty Acid Market, Volume by End User, 2018 – 2027 (Kilo Tons)
8.4.8.6. Finland Tall Oil Fatty Acid Market, Revenue by End User, 2018 – 2027 (US$ Mn)
8.4.9. Germany
8.4.9.1. Germany Tall Oil Fatty Acid Market, Volume by Application, 2018 – 2027 (Kilo Tons)
8.4.9.2. Germany Tall Oil Fatty Acid Market, Revenue by Application, 2018 – 2027 (US$ Mn)
8.4.9.3. Germany Tall Oil Fatty Acid Market, Volume by Product Segment, 2018 – 2027 (Kilo Tons)
8.4.9.4. Germany Tall Oil Fatty Acid Market, Revenue by Product Segment, 2018 – 2027 (US$ Mn)
8.4.9.5. Germany Tall Oil Fatty Acid Market, Volume by End User, 2018 – 2027 (Kilo Tons)
8.4.9.6. Germany Tall Oil Fatty Acid Market, Revenue by End User, 2018 – 2027 (US$ Mn)
8.4.10. U.K.
8.4.10.1. U.K. Tall Oil Fatty Acid Market, Volume by Application, 2018 – 2027 (Kilo Tons)
8.4.10.2. U.K. Tall Oil Fatty Acid Market, Revenue by Application, 2018 – 2027 (US$ Mn)
8.4.10.3. U.K. Tall Oil Fatty Acid Market, Volume by Product Segment, 2018 – 2027 (Kilo Tons)
8.4.10.4. U.K. Tall Oil Fatty Acid Market, Revenue by Product Segment, 2018 – 2027 (US$ Mn)
8.4.10.5. U.K. Tall Oil Fatty Acid Market, Volume by End User, 2018 – 2027 (Kilo Tons)
8.4.10.6. U.K. Tall Oil Fatty Acid Market, Revenue by End User, 2018 – 2027 (US$ Mn)
8.4.11. France
8.4.11.1. France Tall Oil Fatty Acid Market, Volume by Application, 2018 – 2027 (Kilo Tons)
8.4.11.2. France Tall Oil Fatty Acid Market, Revenue by Application, 2018 – 2027 (US$ Mn)
8.4.11.3. France Tall Oil Fatty Acid Market, Volume by Product Segment, 2018 – 2027 (Kilo Tons)
8.4.11.4. France Tall Oil Fatty Acid Market, Revenue by Product Segment, 2018 – 2027 (US$ Mn)
8.4.11.5. France Tall Oil Fatty Acid Market, Volume by End User, 2018 – 2027 (Kilo Tons)
8.4.11.6. France Tall Oil Fatty Acid Market, Revenue by End User, 2018 – 2027 (US$ Mn)
8.4.12. Italy
8.4.12.1. Italy Tall Oil Fatty Acid Market, Volume by Application, 2018 – 2027 (Kilo Tons)
8.4.12.2. Italy Tall Oil Fatty Acid Market, Revenue by Application, 2018 – 2027 (US$ Mn)
8.4.12.3. Italy Tall Oil Fatty Acid Market, Volume by Product Segment, 2018 – 2027 (Kilo Tons)
8.4.12.4. Italy Tall Oil Fatty Acid Market, Revenue by Product Segment, 2018 – 2027 (US$ Mn)
8.4.12.5. Italy Tall Oil Fatty Acid Market, Volume by End User, 2018 – 2027 (Kilo Tons)
8.4.12.6. Italy Tall Oil Fatty Acid Market, Revenue by End User, 2018 – 2027 (US$ Mn)
8.4.13. Spain
8.4.13.1. Spain Tall Oil Fatty Acid Market, Volume by Application, 2018 – 2027 (Kilo Tons)
8.4.13.2. Spain Tall Oil Fatty Acid Market, Revenue by Application, 2018 – 2027 (US$ Mn)
8.4.13.3. Spain Tall Oil Fatty Acid Market, Volume by Product Segment, 2018 – 2027 (Kilo Tons)
8.4.13.4. Spain Tall Oil Fatty Acid Market, Revenue by Product Segment, 2018 – 2027 (US$ Mn)
8.4.13.5. Spain Tall Oil Fatty Acid Market, Volume by End User, 2018 – 2027 (Kilo Tons)
8.4.13.6. Spain Tall Oil Fatty Acid Market, Revenue by End User, 2018 – 2027 (US$ Mn)
8.4.14. Rest of Europe
8.4.14.1. Rest of Europe Tall Oil Fatty Acid Market, Volume by Application, 2018 – 2027 (Kilo Tons)
8.4.14.2. Rest of Europe Tall Oil Fatty Acid Market, Revenue by Application, 2018 – 2027 (US$ Mn)
8.4.14.3. Rest of Europe Tall Oil Fatty Acid Market, Volume by Product Segment, 2018 – 2027 (Kilo Tons)
8.4.14.4. Rest of Europe Tall Oil Fatty Acid Market, Revenue by Product Segment, 2018 – 2027 (US$ Mn)
8.4.14.5. Rest of Europe Tall Oil Fatty Acid Market, Volume by End User, 2018 – 2027 (Kilo Tons)
8.4.14.6. Rest of Europe Tall Oil Fatty Acid Market, Revenue by End User, 2018 – 2027 (US$ Mn)
8.5. Asia Pacific
8.5.1. Asia Pacific Tall Oil Fatty Acid Market, Volume by Application, 2018 – 2027 (Kilo Tons)
8.5.2. Asia Pacific Tall Oil Fatty Acid Market, Revenue by Application, 2018 – 2027 (US$ Mn)
8.5.3. Asia Pacific Tall Oil Fatty Acid Market, Volume by Product Segment, 2018 – 2027 (Kilo Tons)
8.5.4. Asia Pacific Tall Oil Fatty Acid Market, Revenue by Product Segment, 2018 – 2027 (US$ Mn)
8.5.5. Asia Pacific Tall Oil Fatty Acid Market, Volume by End User, 2018 – 2027 (Kilo Tons)
8.5.6. Asia Pacific Tall Oil Fatty Acid Market, Revenue by End User, 2018 – 2027 (US$ Mn)
8.5.7. China
8.5.7.1. China Tall Oil Fatty Acid Market, Volume by Application, 2018 – 2027 (Kilo Tons)
8.5.7.2. China Tall Oil Fatty Acid Market, Revenue by Application, 2018 – 2027 (US$ Mn)
8.5.7.3. China Tall Oil Fatty Acid Market, Volume by Product Segment, 2018 – 2027 (Kilo Tons)
8.5.7.4. China Tall Oil Fatty Acid Market, Revenue by Product Segment, 2018 – 2027 (US$ Mn)
8.5.7.5. China Tall Oil Fatty Acid Market, Volume by End User, 2018 – 2027 (Kilo Tons)
8.5.7.6. China Tall Oil Fatty Acid Market, Revenue by End User, 2018 – 2027 (US$ Mn)
8.5.8. Japan
8.5.8.1. Japan Tall Oil Fatty Acid Market, Volume by Application, 2018 – 2027 (Kilo Tons)
8.5.8.2. Japan Tall Oil Fatty Acid Market, Revenue by Application, 2018 – 2027 (US$ Mn)
8.5.8.3. Japan Tall Oil Fatty Acid Market, Volume by Product Segment, 2018 – 2027 (Kilo Tons)
8.5.8.4. Japan Tall Oil Fatty Acid Market, Revenue by Product Segment, 2018 – 2027 (US$ Mn)
8.5.8.5. Japan Tall Oil Fatty Acid Market, Volume by End User, 2018 – 2027 (Kilo Tons)
8.5.8.6. Japan Tall Oil Fatty Acid Market, Revenue by End User, 2018 – 2027 (US$ Mn)
8.5.9. ASEAN
8.5.9.1. ASEAN Tall Oil Fatty Acid Market, Volume by Application, 2018 – 2027 (Kilo Tons)
8.5.9.2. ASEAN Tall Oil Fatty Acid Market, Revenue by Application, 2018 – 2027 (US$ Mn)
8.5.9.3. ASEAN Tall Oil Fatty Acid Market, Volume by Product Segment, 2018 – 2027 (Kilo Tons)
8.5.9.4. ASEAN Tall Oil Fatty Acid Market, Revenue by Product Segment, 2018 – 2027 (US$ Mn)
8.5.9.5. ASEAN Tall Oil Fatty Acid Market, Volume by End User, 2018 – 2027 (Kilo Tons)
8.5.9.6. ASEAN Tall Oil Fatty Acid Market, Revenue by End User, 2018 – 2027 (US$ Mn)
8.5.10. Rest of APAC
8.5.10.1. Rest of APAC Tall Oil Fatty Acid Market, Volume by Application, 2018 – 2027 (Kilo Tons)
8.5.10.2. Rest of APAC Tall Oil Fatty Acid Market, Revenue by Application, 2018 – 2027 (US$ Mn)
8.5.10.3. Rest of APAC Tall Oil Fatty Acid Market, Volume by Product Segment, 2018 – 2027 (Kilo Tons)
8.5.10.4. Rest of APAC Tall Oil Fatty Acid Market, Revenue by Product Segment, 2018 – 2027 (US$ Mn)
8.5.10.5. Rest of APAC Tall Oil Fatty Acid Market, Volume by End User, 2018 – 2027 (Kilo Tons)
8.5.10.6. Rest of APAC Tall Oil Fatty Acid Market, Revenue by End User, 2018 – 2027 (US$ Mn)
8.6. Middle East & Africa (MEA)
8.6.1. MEA Tall Oil Fatty Acid Market, Volume by Application, 2018 – 2027 (Kilo Tons)
8.6.2. MEA Tall Oil Fatty Acid Market, Revenue by Application, 2018 – 2027 (US$ Mn)
8.6.3. MEA Tall Oil Fatty Acid Market, Volume by Product Segment, 2018 – 2027 (Kilo Tons)
8.6.4. MEA Tall Oil Fatty Acid Market, Revenue by Product Segment, 2018 – 2027 (US$ Mn)
8.6.5. MEA Tall Oil Fatty Acid Market, Volume by End User, 2018 – 2027 (Kilo Tons)
8.6.6. MEA Tall Oil Fatty Acid Market, Revenue by End User, 2018 – 2027 (US$ Mn)
8.6.7. GCC
8.6.7.1. GCC Tall Oil Fatty Acid Market, Volume by Application, 2018 – 2027 (Kilo Tons)
8.6.7.2. GCC Tall Oil Fatty Acid Market, Revenue by Application, 2018 – 2027 (US$ Mn)
8.6.7.3. GCC Tall Oil Fatty Acid Market, Volume by Product Segment, 2018 – 2027 (Kilo Tons)
8.6.7.4. GCC Tall Oil Fatty Acid Market, Revenue by Product Segment, 2018 – 2027 (US$ Mn)
8.6.7.5. GCC Tall Oil Fatty Acid Market, Volume by End User, 2018 – 2027 (Kilo Tons)
8.6.7.6. GCC Tall Oil Fatty Acid Market, Revenue by End User, 2018 – 2027 (US$ Mn)
8.6.8. South Africa
8.6.8.1. South Africa Tall Oil Fatty Acid Market, Volume by Application, 2018 – 2027 (Kilo Tons)
8.6.8.2. South Africa Tall Oil Fatty Acid Market, Revenue by Application, 2018 – 2027 (US$ Mn)
8.6.8.3. South Africa Tall Oil Fatty Acid Market, Volume by Product Segment, 2018 – 2027 (Kilo Tons)
8.6.8.4. South Africa Tall Oil Fatty Acid Market, Revenue by Product Segment, 2018 – 2027 (US$ Mn)
8.6.8.5. South Africa Tall Oil Fatty Acid Market, Volume by End User, 2018 – 2027 (Kilo Tons)
8.6.8.6. South Africa Tall Oil Fatty Acid Market, Revenue by End User, 2018 – 2027 (US$ Mn)
8.6.9. Rest of MEA
8.6.9.1. Rest of MEA Tall Oil Fatty Acid Market, Volume by Application, 2018 – 2027 (Kilo Tons)
8.6.9.2. Rest of MEA Tall Oil Fatty Acid Market, Revenue by Application, 2018 – 2027 (US$ Mn)
8.6.9.3. Rest of MEA Tall Oil Fatty Acid Market, Volume by Product Segment, 2018 – 2027 (Kilo Tons)
8.6.9.4. Rest of MEA Tall Oil Fatty Acid Market, Revenue by Product Segment, 2018 – 2027 (US$ Mn)
8.6.9.5. Rest of MEA Tall Oil Fatty Acid Market, Volume by End User, 2018 – 2027 (Kilo Tons)
8.6.9.6. Rest of MEA Tall Oil Fatty Acid Market, Revenue by End User, 2018 – 2027 (US$ Mn)
8.7. Latin America
8.7.1. Latin America Tall Oil Fatty Acid Market, Volume by Application, 2018 – 2027 (Kilo Tons)
8.7.2. Latin America Tall Oil Fatty Acid Market, Revenue by Application, 2018 – 2027 (US$ Mn)
8.7.3. Latin America Tall Oil Fatty Acid Market, Volume by Product Segment, 2018 – 2027 (Kilo Tons)
8.7.4. Latin America Tall Oil Fatty Acid Market, Revenue by Product Segment, 2018 – 2027 (US$ Mn)
8.7.5. Latin America Tall Oil Fatty Acid Market, Volume by End User, 2018 – 2027 (Kilo Tons)
8.7.6. Latin America Tall Oil Fatty Acid Market, Revenue by End User, 2018 – 2027 (US$ Mn)
8.7.7. Brazil
8.7.7.1. Brazil Tall Oil Fatty Acid Market, Volume by Application, 2018 – 2027 (Kilo Tons)
8.7.7.2. Brazil Tall Oil Fatty Acid Market, Revenue by Application, 2018 – 2027 (US$ Mn)
8.7.7.3. Brazil Tall Oil Fatty Acid Market, Volume by Product Segment, 2018 – 2027 (Kilo Tons)
8.7.7.4. Brazil Tall Oil Fatty Acid Market, Revenue by Product Segment, 2018 – 2027 (US$ Mn)
8.7.7.5. Brazil Tall Oil Fatty Acid Market, Volume by End User, 2018 – 2027 (Kilo Tons)
8.7.7.6. Brazil Tall Oil Fatty Acid Market, Revenue by End User, 2018 – 2027 (US$ Mn)
8.7.8. Rest of Latin America
8.7.8.1. Rest of Latin America Tall Oil Fatty Acid Market, Volume by Application, 2018 – 2027 (Kilo Tons)
8.7.8.2. Rest of Latin America Tall Oil Fatty Acid Market, Revenue by Application, 2018 – 2027 (US$ Mn)
8.7.8.3. Rest of Latin America Tall Oil Fatty Acid Market, Volume by Product Segment, 2018 – 2027 (Kilo Tons)
8.7.8.4. Rest of Latin America Tall Oil Fatty Acid Market, Revenue by Product Segment, 2018 – 2027 (US$ Mn)
8.7.8.5. Rest of Latin America Tall Oil Fatty Acid Market, Volume by End User, 2018 – 2027 (Kilo Tons)
8.7.8.6. Rest of Latin America Tall Oil Fatty Acid Market, Revenue by End User, 2018 – 2027 (US$ Mn)
Chapter 9. Company Profiles
9.1. Arizona Chemical Company LLC
9.2. Chemical Associates Inc.
9.3. Eastman Chemical Company
9.4. Georgia-Pacific Chemicals LLC
9.5. Florachem Corporation
9.6. MeadWestvaco Corporation
9.7. Harima Chemicals Group, Inc.
9.8. Forchem Oy
9.9. Segezha Pulp and Paper Mill
9.10. Torgoviy Dom Lesokhimik
9.11. Coral Chemical Company
9.12. Henkel AG & Co. KGaA
9.13. Procter & Gamble Company
9.14. QualiChem, Inc.
9.15. Colgate-Palmolive Company
9.16. Unilever NV
9.17. Ashburn Chemical Technologies
9.18. Cray Valley USA, LLC
9.19. Ashland Inc.
9.20. UPM-Kymmene Corporation
9.21. Akzo Nobel N.V.
9.22. BASF SE
9.23. Nalco Holding Company
9.24. Umicore N.V.
List of Tables
TABLE 1 Global Tall Oil Fatty Acid Market, Snapshot
TABLE 2 Drivers for TOFA Market - Impact Analysis
TABLE 3 Restraints for TOFA Market - Impact Analysis
TABLE 4 Level of Integration among Leading TOFA Manufacturers
TABLE 5 Short Oil Alkyd Solvent Process
TABLE 6 Short Oil Alkyd Fusion Process
TABLE 7 Medium Oil Alkyd Fusion Process
TABLE 8 Long Oil Alkyd Fusion Process
TABLE 9 North America Tall Oil Fatty Acid Market, Volume by Application, 2018 – 2027 (Kilo Tons)
TABLE 10 North America Tall Oil Fatty Acid Market, Revenue by Application, 2018 – 2027 (US$ Mn)
TABLE 11 North America Tall Oil Fatty Acid Market, Volume by Product Segment, 2018 – 2027 (Kilo Tons)
TABLE 12 North America Tall Oil Fatty Acid Market, Revenue by Product Segment, 2018 – 2027 (US$ Mn)
TABLE 13 North America Tall Oil Fatty Acid Market, Volume by End User, 2018 – 2027 (Kilo Tons)
TABLE 14 North America Tall Oil Fatty Acid Market, Revenue by End User, 2018 – 2027 (US$ Mn)
TABLE 15 U.S. Tall Oil Fatty Acid Market, Volume by Application, 2018 – 2027 (Kilo Tons)
TABLE 16 U.S. Tall Oil Fatty Acid Market, Revenue by Application, 2018 – 2027 (US$ Mn)
TABLE 17 U.S. Tall Oil Fatty Acid Market, Volume by Product Segment, 2018 – 2027 (Kilo Tons)
TABLE 18 U.S. Tall Oil Fatty Acid Market, Revenue by Product Segment, 2018 – 2027 (US$ Mn)
TABLE 19 U.S. Tall Oil Fatty Acid Market, Volume by End User, 2018 – 2027 (Kilo Tons)
TABLE 20 U.S. Tall Oil Fatty Acid Market, Revenue by End User, 2018 – 2027 (US$ Mn)
TABLE 21 Rest of North America Tall Oil Fatty Acid Market, Volume by Application, 2018 – 2027 (Kilo Tons)
TABLE 22 Rest of North America Tall Oil Fatty Acid Market, Revenue by Application, 2018 – 2027 (US$ Mn)
TABLE 23 Rest of North America Tall Oil Fatty Acid Market, Volume by Product Segment, 2018 – 2027 (Kilo Tons)
TABLE 24 Rest of North America Tall Oil Fatty Acid Market, Revenue by Product Segment, 2018 – 2027 (US$ Mn)
TABLE 25 Rest of North America Tall Oil Fatty Acid Market, Volume by End User, 2018 – 2027 (Kilo Tons)
TABLE 26 Rest of North America Tall Oil Fatty Acid Market, Revenue by End User, 2018 – 2027 (US$ Mn)
TABLE 27 Europe Tall Oil Fatty Acid Market, Volume by Application, 2018 – 2027 (Kilo Tons)
TABLE 28 Europe Tall Oil Fatty Acid Market, Revenue by Application, 2018 – 2027 (US$ Mn)
TABLE 29 Europe Tall Oil Fatty Acid Market, Volume by Product Segment, 2018 – 2027 (Kilo Tons)
TABLE 30 Europe Tall Oil Fatty Acid Market, Revenue by Product Segment, 2018 - 2027 (US$ Mn)
TABLE 31 Europe Tall Oil Fatty Acid Market, Volume by End User, 2018 – 2027 (Kilo Tons)
TABLE 32 Europe Tall Oil Fatty Acid Market, Revenue by End User, 2018 – 2027 (US$ Mn)
TABLE 33 Sweden Tall Oil Fatty Acid Market, Volume by Application, 2018 – 2027 (Kilo Tons)
TABLE 34 Sweden Tall Oil Fatty Acid Market, Revenue by Application, 2018 – 2027 (US$ Mn)
TABLE 35 Sweden Tall Oil Fatty Acid Market, Volume by Product Segment, 2018 – 2027 (Kilo Tons)
TABLE 36 Sweden Tall Oil Fatty Acid Market, Revenue by Product Segment, 2018 – 2027 (US$ Mn)
TABLE 37 Sweden Tall Oil Fatty Acid Market, Volume by End User, 2018 – 2027 (Kilo Tons)
TABLE 38 Sweden Tall Oil Fatty Acid Market, Revenue by End User, 2018 – 2027 (US$ Mn)
TABLE 39 Finland Tall Oil Fatty Acid Market, Volume by Application, 2018 – 2027 (Kilo Tons)
TABLE 40 Finland Tall Oil Fatty Acid Market, Revenue by Application, 2018 – 2027 (US$ Mn)
TABLE 41 Finland Tall Oil Fatty Acid Market, Volume by Product Segment, 2018 – 2027 (Kilo Tons)
TABLE 42 Finland Tall Oil Fatty Acid Market, Revenue by Product Segment, 2018 – 2027 (US$ Mn)
TABLE 43 Finland Tall Oil Fatty Acid Market, Volume by End User, 2018 – 2027 (Kilo Tons)
TABLE 44 Finland Tall Oil Fatty Acid Market, Revenue by End User, 2018 – 2027 (US$ Mn)
TABLE 45 Germany Tall Oil Fatty Acid Market, Volume by Application, 2018 – 2027 (Kilo Tons)
TABLE 46 Germany Tall Oil Fatty Acid Market, Revenue by Application, 2018 – 2027 (US$ Mn)
TABLE 47 Germany Tall Oil Fatty Acid Market, Volume by Product Segment, 2018 – 2027 (Kilo Tons)
TABLE 48 Germany Tall Oil Fatty Acid Market, Revenue by Product Segment, 2018 – 2027 (US$ Mn)
TABLE 49 Germany Tall Oil Fatty Acid Market, Volume by End User, 2018 – 2027 (Kilo Tons)
TABLE 50 Germany Tall Oil Fatty Acid Market, Revenue by End User, 2018 – 2027 (US$ Mn)
TABLE 51 U.K. Tall Oil Fatty Acid Market, Volume by Application, 2018 – 2027 (Kilo Tons)
TABLE 52 U.K. Tall Oil Fatty Acid Market, Revenue by Application, 2018 – 2027 (US$ Mn)
TABLE 53 U.K. Tall Oil Fatty Acid Market, Volume by Product Segment, 2018 – 2027 (Kilo Tons)
TABLE 54 U.K. Tall Oil Fatty Acid Market, Revenue by Product Segment, 2018 – 2027 (US$ Mn)
TABLE 55 U.K. Tall Oil Fatty Acid Market, Volume by End User, 2018 – 2027 (Kilo Tons)
TABLE 56 U.K. Tall Oil Fatty Acid Market, Revenue by End User, 2018 – 2027 (US$ Mn)
TABLE 57 France Tall Oil Fatty Acid Market, Volume by Application, 2018 – 2027 (Kilo Tons)
TABLE 58 France Tall Oil Fatty Acid Market, Revenue by Application, 2018 – 2027 (US$ Mn)
TABLE 59 France Tall Oil Fatty Acid Market, Volume by Product Segment, 2018 – 2027 (Kilo Tons)
TABLE 60 France Tall Oil Fatty Acid Market, Revenue by Product Segment, 2018 – 2027 (US$ Mn)
TABLE 61 France Tall Oil Fatty Acid Market, Volume by End User, 2018 – 2027 (Kilo Tons)
TABLE 62 France Tall Oil Fatty Acid Market, Revenue by End User, 2018 – 2027 (US$ Mn)
TABLE 63 Italy Tall Oil Fatty Acid Market, Volume by Application, 2018 – 2027 (Kilo Tons)
TABLE 64 Italy Tall Oil Fatty Acid Market, Revenue by Application, 2018 – 2027 (US$ Mn)
TABLE 65 Italy Tall Oil Fatty Acid Market, Volume by Product Segment, 2018 – 2027 (Kilo Tons)
TABLE 66 Italy Tall Oil Fatty Acid Market, Revenue by Product Segment, 2018 – 2027 (US$ Mn)
TABLE 67 Italy Tall Oil Fatty Acid Market, Volume by End User, 2018 – 2027 (Kilo Tons)
TABLE 68 Italy Tall Oil Fatty Acid Market, Revenue by End User, 2018 – 2027 (US$ Mn)
TABLE 69 Spain Tall Oil Fatty Acid Market, Volume by Application, 2018 – 2027 (Kilo Tons)
TABLE 70 Spain Tall Oil Fatty Acid Market, Revenue by Application, 2018 – 2027 (US$ Mn)
TABLE 71 Spain Tall Oil Fatty Acid Market, Volume by Product Segment, 2018 – 2027 (Kilo Tons)
TABLE 72 Spain Tall Oil Fatty Acid Market, Revenue by Product Segment, 2018 – 2027 (US$ Mn)
TABLE 73 Spain Tall Oil Fatty Acid Market, Volume by End User, 2018 – 2027 (Kilo Tons)
TABLE 74 Spain Tall Oil Fatty Acid Market, Revenue by End User, 2018 – 2027 (US$ Mn)
TABLE 75 Rest of Europe Tall Oil Fatty Acid Market, Volume by Application, 2018 – 2027 (Kilo Tons)
TABLE 76 Rest of Europe Tall Oil Fatty Acid Market, Revenue by Application, 2018 – 2027 (US$ Mn)
TABLE 77 Rest of Europe Tall Oil Fatty Acid Market, Volume by Product Segment, 2018 – 2027 (Kilo Tons)
TABLE 78 Rest of Europe Tall Oil Fatty Acid Market, Revenue by Product Segment, 2018 – 2027 (US$ Mn)
TABLE 79 Rest of Europe Tall Oil Fatty Acid Market, Volume by End User, 2018 – 2027 (Kilo Tons)
TABLE 80 Rest of Europe Tall Oil Fatty Acid Market, Revenue by End User, 2018 – 2027 (US$ Mn)
TABLE 81 Asia Pacific Tall Oil Fatty Acid Market, Volume by Application, 2018 – 2027 (Kilo Tons)
TABLE 82 Asia Pacific Tall Oil Fatty Acid Market, Revenue by Application, 2018 – 2027 (US$ Mn)
TABLE 83 Asia Pacific Tall Oil Fatty Acid Market, Volume by Product Segment, 2018 – 2027 (Kilo Tons)
TABLE 84 Asia Pacific Tall Oil Fatty Acid Market, Revenue by Product Segment, 2018 - 2027 (US$ Mn)
TABLE 85 Asia Pacific Tall Oil Fatty Acid Market, Volume by End User, 2018 – 2027 (Kilo Tons)
TABLE 86 Asia Pacific Tall Oil Fatty Acid Market, Revenue by End User, 2018 – 2027 (US$ Mn)
TABLE 87 China Tall Oil Fatty Acid Market, Volume by Application, 2018 – 2027 (Kilo Tons)
TABLE 88 China Tall Oil Fatty Acid Market, Revenue by Application, 2018 – 2027 (US$ Mn)
TABLE 89 China Tall Oil Fatty Acid Market, Volume by Product Segment, 2018 – 2027 (Kilo Tons)
TABLE 90 China Tall Oil Fatty Acid Market, Revenue by Product Segment, 2018 – 2027 (US$ Mn)
TABLE 91 China Tall Oil Fatty Acid Market, Volume by End User, 2018 – 2027 (Kilo Tons)
TABLE 92 China Tall Oil Fatty Acid Market, Revenue by End User, 2018 – 2027 (US$ Mn)
TABLE 93 Japan Tall Oil Fatty Acid Market, Volume by Application, 2018 – 2027 (Kilo Tons)
TABLE 94 Japan Tall Oil Fatty Acid Market, Revenue by Application, 2018 – 2027 (US$ Mn)
TABLE 95 Japan Tall Oil Fatty Acid Market, Volume by Product Segment, 2018 – 2027 (Kilo Tons)
TABLE 96 Japan Tall Oil Fatty Acid Market, Revenue by Product Segment, 2018 – 2027 (US$ Mn)
TABLE 97 Japan Tall Oil Fatty Acid Market, Volume by End User, 2018 – 2027 (Kilo Tons)
TABLE 98 Japan Tall Oil Fatty Acid Market, Revenue by End User, 2018 – 2027 (US$ Mn)
TABLE 99 ASEAN Tall Oil Fatty Acid Market, Volume by Application, 2018 – 2027 (Kilo Tons)
TABLE 100 ASEAN Tall Oil Fatty Acid Market, Revenue by Application, 2018 – 2027 (US$ Mn)
TABLE 101 ASEAN Tall Oil Fatty Acid Market, Volume by Product Segment, 2018 – 2027 (Kilo Tons)
TABLE 102 ASEAN Tall Oil Fatty Acid Market, Revenue by Product Segment, 2018 – 2027 (US$ Mn)
TABLE 103 ASEAN Tall Oil Fatty Acid Market, Volume by End User, 2018 – 2027 (Kilo Tons)
TABLE 104 ASEAN Tall Oil Fatty Acid Market, Revenue by End User, 2018 – 2027 (US$ Mn)
TABLE 105 Rest of APAC Tall Oil Fatty Acid Market, Volume by Application, 2018 – 2027 (Kilo Tons)
TABLE 106 Rest of APAC Tall Oil Fatty Acid Market, Revenue by Application, 2018 – 2027 (US$ Mn)
TABLE 107 Rest of APAC Tall Oil Fatty Acid Market, Volume by Product Segment, 2018 – 2027 (Kilo Tons)
TABLE 108 Rest of APAC Tall Oil Fatty Acid Market, Revenue by Product Segment, 2018 – 2027 (US$ Mn)
TABLE 109 Rest of APAC Tall Oil Fatty Acid Market, Volume by End User, 2018 – 2027 (Kilo Tons)
TABLE 110 Rest of APAC Tall Oil Fatty Acid Market, Revenue by End User, 2018 – 2027 (US$ Mn)
TABLE 111 MEA Tall Oil Fatty Acid Market, Volume by Application, 2018 – 2027 (Kilo Tons)
TABLE 112 MEA Tall Oil Fatty Acid Market, Revenue by Application, 2018 – 2027 (US$ Mn)
TABLE 113 MEA Tall Oil Fatty Acid Market, Volume by Product Segment, 2018 – 2027 (Kilo Tons)
TABLE 114 MEA Tall Oil Fatty Acid Market, Revenue by Product Segment, 2018 - 2027 (US$ Mn)
TABLE 115 MEA Tall Oil Fatty Acid Market, Volume by End User, 2018 – 2027 (Kilo Tons)
TABLE 116 MEA Tall Oil Fatty Acid Market, Revenue by End User, 2018 – 2027 (US$ Mn)
TABLE 117 GCC Tall Oil Fatty Acid Market, Volume by Application, 2018 – 2027 (Kilo Tons)
TABLE 118 GCC Tall Oil Fatty Acid Market, Revenue by Application, 2018 – 2027 (US$ Mn)
TABLE 119 GCC Tall Oil Fatty Acid Market, Volume by Product Segment, 2018 – 2027 (Kilo Tons)
TABLE 120 GCC Tall Oil Fatty Acid Market, Revenue by Product Segment, 2018 – 2027 (US$ Mn)
TABLE 121 GCC Tall Oil Fatty Acid Market, Volume by End User, 2018 – 2027 (Kilo Tons)
TABLE 122 GCC Tall Oil Fatty Acid Market, Revenue by End User, 2018 – 2027 (US$ Mn)
TABLE 123 South Africa Tall Oil Fatty Acid Market, Volume by Application, 2018 – 2027 (Kilo Tons)
TABLE 124 South Africa Tall Oil Fatty Acid Market, Revenue by Application, 2018 – 2027 (US$ Mn)
TABLE 125 South Africa Tall Oil Fatty Acid Market, Volume by Product Segment, 2018 – 2027 (Kilo Tons)
TABLE 126 South Africa Tall Oil Fatty Acid Market, Revenue by Product Segment, 2018 – 2027 (US$ Mn)
TABLE 127 South Africa Tall Oil Fatty Acid Market, Volume by End User, 2018 – 2027 (Kilo Tons)
TABLE 128 South Africa Tall Oil Fatty Acid Market, Revenue by End User, 2018 – 2027 (US$ Mn)
TABLE 129 Rest of MEA Tall Oil Fatty Acid Market, Volume by Application, 2018 – 2027 (Kilo Tons)
TABLE 130 Rest of MEA Tall Oil Fatty Acid Market, Revenue by Application, 2018 – 2027 (US$ Mn)
TABLE 131 Rest of MEA Tall Oil Fatty Acid Market, Volume by Product Segment, 2018 – 2027 (Kilo Tons)
TABLE 132 Rest of MEA Tall Oil Fatty Acid Market, Revenue by Product Segment, 2018 – 2027 (US$ Mn)
TABLE 133 Rest of MEA Tall Oil Fatty Acid Market, Volume by End User, 2018 – 2027 (Kilo Tons)
TABLE 134 Rest of MEA Tall Oil Fatty Acid Market, Revenue by End User, 2018 – 2027 (US$ Mn)
TABLE 135 Latin America Tall Oil Fatty Acid Market, Volume by Application, 2018 – 2027 (Kilo Tons)
TABLE 136 Latin America Tall Oil Fatty Acid Market, Revenue by Application, 2018 – 2027 (US$ Mn)
TABLE 137 Latin America Tall Oil Fatty Acid Market, Volume by Product Segment, 2018 – 2027 (Kilo Tons)
TABLE 138 Latin America Tall Oil Fatty Acid Market, Revenue by Product Segment, 2018 - 2027 (US$ Mn)
TABLE 139 Latin America Tall Oil Fatty Acid Market, Volume by End User, 2018 – 2027 (Kilo Tons)
TABLE 140 Latin America Tall Oil Fatty Acid Market, Revenue by End User, 2018 – 2027 (US$ Mn)
TABLE 141 Brazil Tall Oil Fatty Acid Market, Volume by Application, 2018 – 2027 (Kilo Tons)
TABLE 142 Brazil Tall Oil Fatty Acid Market, Revenue by Application, 2018 – 2027 (US$ Mn)
TABLE 143 Brazil Tall Oil Fatty Acid Market, Volume by Product Segment, 2018 – 2027 (Kilo Tons)
TABLE 144 Brazil Tall Oil Fatty Acid Market, Revenue by Product Segment, 2018 – 2027 (US$ Mn)
TABLE 145 Brazil Tall Oil Fatty Acid Market, Volume by End User, 2018 – 2027 (Kilo Tons)
TABLE 146 Brazil Tall Oil Fatty Acid Market, Revenue by End User, 2018 – 2027 (US$ Mn)
TABLE 147 Rest of Latin America Tall Oil Fatty Acid Market, Volume by Application, 2018 – 2027 (Kilo Tons)
TABLE 148 Rest of Latin America Tall Oil Fatty Acid Market, Revenue by Application, 2018 – 2027 (US$ Mn)
TABLE 149 Rest of Latin America Tall Oil Fatty Acid Market, Volume by Product Segment, 2018 – 2027 (Kilo Tons)
TABLE 150 Rest of Latin America Tall Oil Fatty Acid Market, Revenue by Product Segment, 2018 – 2027 (US$ Mn)
TABLE 151 Rest of Latin America Tall Oil Fatty Acid Market, Volume by End User, 2018 – 2027 (Kilo Tons)
TABLE 152 Rest of Latin America Tall Oil Fatty Acid Market, Revenue by End User, 2018 – 2027 (US$ Mn)
List of Figures
FIG. 1 Global Tall Oil Fatty Acid Market, Segmentation by Product Segments, Applications, End-users and Regions
FIG. 2 Global Tall Oil Fatty Acid Market, 2018 – 2027 (Kilo Tons) (US$ Mn)
FIG. 3 Global Tall Oil Fatty Acid Market - Value Chain Analysis
FIG. 4 U.S. Crude Oil Production per Day (2018-2027)
FIG. 5 Global Cleaning Products Industry Revenue (US$ Bn) (2015 - 2018)
FIG. 6 Global Paints & Coatings Industry Revenue (US$ Bn) (2018 – 2027)
FIG. 7 Porter’s Five Forces Analysis
FIG. 8 Global Tall Oil Fatty Acid - Market Attractiveness Analysis
FIG. 9 Global TOFA Market: Company Market Share Analysis, 2018
FIG. 10 Process Flow-Chart of Dimerization of TOFA
FIG. 11 Global Wood Pulp Price, 2018-2027 (US$/Ton)
FIG. 12 Global Tall Oil Fatty Acid Market, Volume Share, by Product Segment, 2018 – 2027
FIG. 13 Global Market of Tall Oil Fatty Acid for Oleic Acid, 2018 – 2027 (Kilo Tons) (US$ Mn)
FIG. 14 Global Market of Tall Oil Fatty Acid for Linoleic Acid, 2018 – 2027 (Kilo Tons) (US$ Mn)
FIG. 15 Global Market of Tall Oil Fatty Acid for Others, 2018 – 2027 (Kilo Tons) (US$ Mn)
FIG. 16 Global Tall Oil Fatty Acid Market, Volume Share, by Application, 2018 – 2027
FIG. 17 Global Market of Tall Oil Fatty Acid for Dimer Acids, 2018 – 2027 (Kilo Tons) (US$ Mn)
FIG. 18 Global Market of Tall Oil Fatty Acid for Alkyd Resins, 2018 – 2027 (Kilo Tons) (US$ Mn)
FIG. 19 Global Market of Tall Oil Fatty Acid for Fatty Acid Esters, 2018 – 2027 (Kilo Tons) (US$ Mn)
FIG. 20 Global Market of Tall Oil Fatty Acid for Other Applications, 2018 – 2027 (Kilo Tons) (US$ Mn)
FIG. 21 Global Tall Oil Fatty Acid Market, Volume Share, by End-user, 2018 – 2027
FIG. 22 Global Market for Tall Oil Fatty Acid for Soaps & detergents, 2018 – 2027 (Kilo Tons) (US$ Mn)
FIG. 23 Global Market for Tall Oil Fatty Acid for Coatings, 2018 – 2027 (Kilo Tons) (US$ Mn)
FIG. 24 Global Market for Tall Oil Fatty Acid for Lubricants, 2018 – 2027 (Kilo Tons) (US$ Mn)
FIG. 25 Global Market for Tall Oil Fatty Acid for Plastics, 2018 – 2027 (Kilo Tons) (US$ Mn)
FIG. 26 Global Market for Tall Oil Fatty Acid for Fuel Additives, 2018 – 2027 (Kilo Tons) (US$ Mn
FIG. 27 Global Market for Tall Oil Fatty Acid for Metal Working Fluid, 2018 – 2027 (Kilo Tons) (US$ Mn)
FIG. 28 Global Market for Tall Oil Fatty Acid for Other Applications, 2018 – 2027 (Kilo Tons) (US$ Mn)
FIG. 29 Global Tall Oil Fatty Acid Market, Volume Share, by Region, 2018 – 2027
Copyright © Transparency Market Research, Inc. All Rights reserved
Trust Online


Tall Oil Fatty Acid Market