Visiongain has calculated that the global subsea umbilicals, risers and flowlines (SURF) market will see a capital expenditure (CAPEX) of $6,883 mn in 2019. Read on to discover the potential business opportunities available.
The oil price fall in 2014 has changed the dynamics of the SURF market, and future oil price levels will strongly influence SURF expenditure. This is the case even for natural gas projects, as natural gas is tied to the price of oil in most regions.
CAPEX is expected to hold up in the immediate term as existing spending on under-construction projects is maintained, and projects continue to go ahead where investment has already been committed. Increased investment towards the development of fields in deeper and more remote areas along with the development of fixed and floating hubs and marginal fields are likely to boost the SURF market in the long run.
As oil and gas production enters increasingly deeper and harsher environments, the challenges for subsea engineering, installation and maintenance become even tougher. When considering that the typical lifespan of a subsea system can be as much as 20 years, with hopes to extend this considerably, the demands on SURF systems are intensified.
Visiongain’s global Oil & Gas Subsea Umbilicals, Risers & Flowlines (SURF) market report can keep you informed and up to date with the developments in the market, across six different regions: North America, Western Europe, Eurasia/Middle East, Africa, Asia Pacific and South America.
With reference to this report, it details the key investments trend in the global market, subdivided by regions, capital and operational expenditure and project type. Through extensive secondary research, Visiongain has identified a series of market trends that will impact the SURF market over the forecast timeframe.
The report will answer questions such as:
• How is the SURF market evolving?
• What is driving and restraining the SURF market dynamics?
• What are the market shares of the submarkets of the SURF Market in 2019?
• How will each SURF submarket segment grow over the forecast period and how much revenue will these submarkets account for in 2029?
• How will the market shares for each SURF market space develop from 2019-2029?
• Which SURF market space will be the main driver for the overall market from 2019-2029?
• How will political and regulatory factors influence the market spaces and submarkets?
• Will leading national SURF markets broadly follow the macroeconomic dynamics, or will individual country sectors outperform the rest of the economy?
• How will the market shares of the market spaces change by 2029 and which geographical region will lead the market in 2029?
• Who are the leading players in the market?
Five Reasons Why You Must Order and Read This Report Today:
1) The report provides forecasts for the global subsea production & processing systems market, as well as for 3 hardware submarkets, for the period 2019-2029
• Umbilicals CAPEX 2019-2029
• Risers CAPEX 2019-2029
• Flowlines CAPEX 2019-2029
2) The report also forecasts and analyses the subsea production & processing systems market by water depth from 2019-2029
• Shallow water CAPEX 2019-2029
• Deepwater projects CAPEX 2019-2029
• Ultra-deepwater projects CAPEX 2019-2029
3) The report reveals where and how companies are investing in subsea P&P systems. We show you the prospects for the following regions, including individual breakdowns by hardware and water depth:
Africa
• Umbilicals CAPEX 2019-2029
• Risers CAPEX 2019-2029
• Flowlines CAPEX 2019-2029
• Shallow water CAPEX 2019-2029
• Deepwater projects CAPEX 2019-2029
• Ultra-deepwater projects CAPEX 2019-2029
Asia Pacific
• Umbilicals CAPEX 2019-2029
• Risers CAPEX 2019-2029
• Flowlines CAPEX 2019-2029
• Shallow water CAPEX 2019-2029
• Deepwater projects CAPEX 2019-2029
• Ultra-deepwater projects CAPEX 2019-2029
North America
• Umbilicals CAPEX 2019-2029
• Risers CAPEX 2019-2029
• Flowlines CAPEX 2019-2029
• Shallow water CAPEX 2019-2029
• Deepwater projects CAPEX 2019-2029
• Ultra-deepwater projects CAPEX 2019-2029
Western Europe
• Umbilicals CAPEX 2019-2029
• Risers CAPEX 2019-2029
• Flowlines CAPEX 2019-2029
• Shallow water CAPEX 2019-2029
• Deepwater projects CAPEX 2019-2029
• Ultra-deepwater projects CAPEX 2019-2029
South America
• Umbilicals CAPEX 2019-2029
• Risers CAPEX 2019-2029
• Flowlines CAPEX 2019-2029
• Shallow water CAPEX 2019-2029
• Deepwater projects CAPEX 2019-2029
• Ultra-deepwater projects CAPEX 2019-2029
Eurasia/Middle East
• Umbilicals CAPEX 2019-2029
• Risers CAPEX 2019-2029
• Flowlines CAPEX 2019-2029
• Shallow water CAPEX 2019-2029
• Deepwater projects CAPEX 2019-2029
• Ultra-deepwater projects CAPEX 2019-2029
4) The report includes Details & Analysis of Contracts, Projects and Programmes across the Six Different Regions & Individual Outlooks
African Subsea Production & Processing Systems Projects and Individual Outlooks
• Angola
• Cameroon
• Congo-Brazzaville
• Egypt
• Equatorial Guinea
• Gabon
• Ghana
• Mozambique
• Namibia
• Nigeria
• South Africa
• Tanzania
Asia Pacific Subsea Production & Processing Systems Projects and Individual Outlooks
• Australia
• Brunei
• China
• India
• Indonesia
• Malaysia
• Papua New Guinea
• Vietnam
Eurasia/Middle East Subsea Production & Processing Systems Projects and Individual Outlooks
• Black Sea
• Caspian Sea
• Persian Gulf
• Russian Arctic
North American Subsea Production & Processing Systems Projects and Individual Outlooks
• Alaska
• Canada
• Trinidad and Tobago
South American Production & Processing Systems Projects
• Brazil
Western European Subsea Production & Processing Systems Projects and Individual Outlooks
• Denmark
• Ireland
• Mediterranean Sea
• Netherlands
5) The report provides detailed profiles of the leading companies operating within the SURF market
• Acteon Group
• Aker Solutions
• Dril-Quip, Inc.
• EZRA Holdings Limited
• General Electric
• Halliburton
• Oceaneering International, Inc.
• Prysmian Group
• Saipem SpA
• Schlumberger Limited
• Subsea 7 SA
• TechnipFMC plc
This independent 264-page report guarantees you will remain better informed than your competitors. With 185 tables and figures examining the SURF market space, the report gives you a direct, detailed breakdown of the market. PLUS, Capital expenditure by Hardware and Water Depth Categories are broken down into the Shallow, Deep and Ultra Deep submarkets, as well as in-depth analysis of Contracts, Projects and Programmes from 2019-2029 that will keep your knowledge that one step ahead of your rivals.
This report is essential reading for you or anyone in the Oil and Gas sector. Purchasing this report today will help you to recognise those important market opportunities and understand the possibilities there. I look forward to receiving your order.
Visiongain is a trading partner with the US Federal Government
CCR Ref number: KD4R6
1. Report Overview
1.1 Global SURF Market Overview
1.2 Why You Should Read This Report
1.3 Global SURF Market Segmentation
1.4 Market Definition
1.5 How This Report Delivers
1.6 Key Questions Answered by This Analytical Report Include:
1.7 Who is This Report For?
1.8 Methodology
1.8.1 Primary Research
1.8.2 Secondary Research
1.8.3 Market Evaluation & Forecasting Methodology
1.9 Frequently Asked Questions (FAQ)
1.10 Associated Visiongain Reports
1.11 About Visiongain
2. Introduction to the Subsea Umbilicals, Risers & Flowlines Market
2.1 SURF Technology
2.2 The Wider Subsea System
2.3 Technical Challenges for SURF
2.4 The Economics of SURF
2.5 Brief History of Subsea Systems
3. Global Subsea Umbilicals, Risers & Flowlines Market 2019-2029
3.1 Oil Prices and the SURF Market
3.1.1 Visiongain’s Description and Analysis of the Oil Price Fall
3.1.2 Supply-Side Factors
3.1.2.1 Tight Oil
3.1.2.2 OPEC
3.1.3 Demand-Side Factors
3.1.3.1 Chinese and Indian Growth
3.1.3.2 Western Stagnation
3.1.4 Other Major Variables that Impact the Oil Price
3.1.4.1 North Africa
3.1.4.2 Russia
3.1.4.3 US Shale
3.1.4.4 Iran
3.1.4.5 International Incidents
3.1.5 Visiongain’s Oil Price Assumptions and Forecast
3.2 SURF Market Drivers & Restraints 2019
3.2.1 Global Energy Demand
3.2.2 The Impact of Oil Prices and SURF Technology on Marginal Field Profitability
3.2.3 Technological Diversification and Growth Opportunities
3.2.4 Avoiding Security Challenges
3.2.5 Harsh Environments Lead to Tough Challenges
3.2.6 Concerns about the Supply Chain and Relevant Skills
3.2.7 Is Regulation Enough to Appease Public Unease over Subsea and Deepwater Production?
3.2.8 The Cost of Subsea Developments and Access to Finance
4. Global Subsea Umbilicals, Risers & Flowlines Submarket Forecasts 2019-2029
4.1 The SURF Hardware Submarket Forecasts 2019-2029
4.1.1 The Umbilicals Submarket Forecast 2019-2029
4.1.2 The Risers Market Forecast 2019-2029
4.1.3 The Flowlines Market Forecast 2019-2029
4.2 The Subsea Production & Processing Systems Water Depth Submarket Forecasts 2019-2029
4.2.1 The Shallow Water Submarket Forecast 2019-2029
4.2.1.1 Shallow Water SURF Market Drivers and Restraints
4.2.1.2 Shallow Water SURF Contracts
4.2.2 The Deep Water Submarket Forecast 2019-2029
4.2.2.1 Deepwater SURF Market Drivers and Restraints
4.2.2.2 Deepwater SURF Contracts
4.2.3 The Ultra Deep Water Market Forecast 2019-2029
4.2.3.1 Ultra-Deepwater SURF Market Drivers and Restraints
4.2.3.2 Ultra-Deepwater SURF Contracts
5. The African Subsea Umbilicals, Risers & Flowlines Market Forecast 2019-2029
5.1 What is the Current Status of the Subsea Production & Processing Systems Market in Africa?
5.2 Drivers and Restraints in African SURF Market
5.3 What Potential is there in Africa for Subsea Production & Processing Systems?
5.3.1 Delays and Security Issues Continue to Plague the African Market
5.3.2 Political Instability and Delays to the Petroleum Industry Bill Defer Offshore Growth
5.4 Major African Subsea Production & Processing Systems Projects and Individualised Outlooks
5.4.1 Angola
5.4.2 Cameroon
5.4.3 Congo-Brazzaville
5.4.4 Egypt
5.4.5 Equatorial Guinea
5.4.6 Gabon
5.4.7 Ghana
5.4.8 Mozambique
5.4.9 Namibia
5.4.10 Nigeria
5.4.11 South Africa
5.4.12 Tanzania
6. The Asia Pacific Subsea Umbilicals, Risers and Flowlines Market Forecast 2019-2029
6.1 What is the Current Status of the Subsea Production & Processing Systems Market in Asia Pacific?
6.2 Drivers and Restraints in Asia Pacific SURF Market
6.3 What Potential is there in Asia Pacific for SURF?
6.4 Major Asia Pacific SURF Projects and Individualised Outlooks
6.4.1 Australia
6.4.2 Brunei
6.4.3 China
6.4.4 India
6.4.5 Indonesia
6.4.6 Malaysia
6.4.7 Papua New Guinea
6.4.8 Vietnam
7. The Eurasia/M East Subsea Umbilicals, Risers & Flowlines Market Forecast 2019-2029
7.1 Drivers and Restraints in Eurasia/Middle East SURF Market
7.2 Major Eurasia/Middle East SURF Projects and Individualised Outlooks
7.2.1 Black Sea
7.2.2 Caspian Sea
7.2.3 Persian Gulf
7.2.4 Russian Arctic
8. The North America Subsea Umbilicals, Risers and Flowlines Market Forecast 2019-2029
8.1 What is the Current Status of the Subsea Production & Processing Systems Market in the Gulf of Mexico?
8.2 Drivers and Restraints in the North American Subsea Production & Processing Systems Market
8.3 What Potential is there in the Gulf of Mexico for Subsea Production & Processing Systems Market?
8.3.1 The Prospects for Growth from Mexican Energy Reforms
8.3.2 Opportunities for Marginal Field Growth
8.3.3 The Role of an Established Supply Chain
8.3.4 Impacts from Environmental Regulations
8.3.5 US Shale Revolution
8.3.6 Is there a Continued Role for Subsea Production & Processing Systems in the Gulf of Mexico?
8.4 Major North American SURF Projects and Individualised Outlooks
8.4.1 Alaska
8.4.2 Canada
8.4.3 Trinidad and Tobago
9. The South America Subsea Umbilicals, Risers & Flowlines Market Forecast 2019-2029
9.1 What is the Current Status of the SURF Market in South America?
9.2 Drivers and Restraints in the South America SURF Market
9.3 What Potential is there in South America for SURF?
9.3.1 Growing Brazilian Energy Demand and Vast Reserves
9.3.2 The Presence of International Companies Helps to Meet Demand
9.3.3 An Over-Reliance on Petrobras?
9.3.4 Local Content Legislation and Project Delays
9.3.5 Are Brazil’s Subsea Sites too tough for Existing Technology?
9.3.6 Will International Competition Stunt Brazilian Development?
9.3.7 What is Happening in the Rest of South America?
10. The Western Europe Subsea Umbilicals, Risers & Flowlines Market Forecast 2019-2029
10.1 What is the Current Status of the SURF Market in the North Sea?
10.2 The Drivers and Restraints in the Western Europe SURF Market
10.3 What Potential is there in Western Europe for SURF?
10.3.1 Are Increased E&P and Expertise Enough to Counteract Declining Production in Norway?
10.3.2 Arctic Opportunities
10.3.3 What Role Does Expertise Play in the SURF Market?
10.3.4 High Costs and Low Levels of Exploration in the UK
10.3.5 Finding the Right Tax Balance in the Mature UK Market
10.4 Major Western European SURF Projects and Individualised Outlooks
10.4.1 Denmark
10.4.2 Ireland
10.4.3 Mediterranean Sea
10.4.4 Netherlands
11. PEST Analysis of the Subsea Umbilicals, Risers & Flowlines Market
11.1 Political
11.2 Economic
11.3 Social
11.4 Technological
12. The Leading Companies in the SURF Market
12.1 Acteon Group
12.2 Aker Solutions
12.3 Dril-Quip, Inc.
12.4 EZRA Holdings Limited
12.5 General Electric
12.6 Halliburton
12.7 Oceaneering International, Inc.
12.8 Prysmian Group
12.9 Saipem SpA
12.10 Schlumberger Limited
12.11 Subsea 7 SA
12.12 TechnipFMC plc
12.13 Other Companies Involved in the SURF Market
13. Conclusions and Recommendations
13.1 Key Findings
13.2 Recommendations
14. Glossary
Associated Visiongain Reports
Visiongain Report Sales Order Form
Appendix A
About Visiongain
Appendix B
Visiongain report evaluation form
List of Figures
Figure 1.1 Global Oil and Gas Consumption Forecasts 2015-2035 (MMtoe)
Figure 1.2 Global SURF Market Segmentation Overview
Figure 2.1 Diagrammatic Cross Section of a Subsea Umbilical
Figure 2.2 Economic Considerations for SURF Systems
Figure 2.3 Subsea Production Historical Timeline
Figure 2.4 Subsea Tree Orders and Installations 2013-2017
Figure 3.1 Global SURF Market Forecast 2019-2029 (US$mn, AGR %)
Figure 3.2 Global SURF Market Forecast by Region 2019-2029 (US$mn, AGR %)
Figure 3.3 WTI and Brent Oil Prices 2006-2018 ($/bbl)
Figure 3.4 Average Monthly OPEC Crude Oil Price July 2017-July 2018 ($/bbl)
Figure 3.5 China and India Annual GDP Growth 2012-2018 (%)
Figure 3.6 US Refined Product Consumption January 2014 to December 2015 Four-Week Average (Mbpd)
Figure 3.7 Visiongain’s Anticipated Brent Crude Oil Price 2018, 2019, 2020-2022, 2026-2025, 2026-2029 ($/bbl)
Figure 3.8 UK and Norwegian Oil Production 2006-2017 (Tbpd)
Figure 3.9 Cyclic SURF Technological Growth
Figure 4.1 Global SURF Hardware Submarket Forecasts 2019-2029 ($m)
Figure 4.2 Global SURF Hardware CAPEX Share Forecast 2019 (%)
Figure 4.3 Global SURF Hardware CAPEX Share Forecast 2024 (%)
Figure 4.4 Global SURF Hardware CAPEX Share Forecast 2029 (%)
Figure 4.5 Global Cumulative SURF Hardware CAPEX 2019-2029 ($mn)
Figure 4.6 Umbilicals Market Forecast 2019-2029 ($m, AGR %)
Figure 4.7 Umbilicals Market Share Forecast 2019, 2024 and 2029 (% Share)
Figure 4.8 The Umbilicals Submarket Forecast by Region 2019-2019 ($m)
Figure 4.9 The Umbilicals Market CAPEX Share Forecast by Region 2019 (%)
Figure 4.10 The Umbilicals Market CAPEX Share Forecast by Region 2024 (%)
Figure 4.11 The Umbilicals Market CAPEX Share Forecast by Region 2029 (%)
Figure 4.12 Risers Market Forecast 2019-2029 ($m, AGR %)
Figure 4.13 Risers Market Share Forecast 2019, 2024 and 2029 (% Share)
Figure 4.14 The Risers Market Forecast by Region 2019-2029 ($m)
Figure 4.15 The Risers Market CAPEX Share Forecast by Region 2019 (%)
Figure 4.16 The Risers Market CAPEX Share Forecast by Region 2024 (%)
Figure 4.17 The Risers Market CAPEX Share Forecast by Region 2029 (%)
Figure 4.18 Flowlines Market Forecast 2019-2029 ($m, AGR %)
Figure 4.19 Flowlines Market Share Forecast 2019, 2024 and 2029 (% Share)
Figure 4.20 The Flowlines Market Forecast by Region 2019-2029 ($m)
Figure 4.21 The Flowlines Market CAPEX Share Forecast by Region 2019 (%)
Figure 4.22 The Flowlines Market CAPEX Share Forecast by Region 2024 (%)
Figure 4.23 The Flowlines Market CAPEX Share Forecast by Region 2029 (%)
Figure 4.24 SURF Water Depth Market Forecasts 2019-2029 ($m)
Figure 4.25 SURF Water Depth CAPEX Share Forecast 2019 (%)
Figure 4.26 SURF Water Depth CAPEX Share Forecast 2024 (%)
Figure 4.27 SURF Water Depth CAPEX Share Forecast 2029 (%)
Figure 4.28 Cumulative SURF Water Depth CAPEX 2019-2029 ($mn)
Figure 4.29 Shallow Water Market Forecast 2019-2029 ($m, AGR %)
Figure 4.30 Shallow Water Market Share Forecast 2019, 2024 and 2029 (% Share)
Figure 4.31 The Shallow Water Market Forecast by Region 2019-2029 ($m)
Figure 4.32 The Shallow Water Market CAPEX Share Forecast by Region 2019 (%)
Figure 4.33 The Shallow Water Market CAPEX Share Forecast by Region 2024 (%)
Figure 4.34 The Shallow Water Market CAPEX Share Forecast by Region 2029 (%)
Figure 4.35 Deep Water Market Forecast 2019-2029 ($m, AGR %)
Figure 4.36 Deep Water Market Share Forecast 2019, 2024 and 2029 (% Share)
Figure 4.37 The Deep Water Market Forecast by Region 2019-2029 ($m)
Figure 4.38 The Deep Water Market CAPEX Share Forecast by Region 2019 (%)
Figure 4.39 The Deep Water Market CAPEX Share Forecast by Region 2024 (%)
Figure 4.40 The Deep Water Market CAPEX Share Forecast by Region 2029 (%)
Figure 4.41 Ultra Deep Water Market Forecast 2019-2029 ($m, AGR %)
Figure 4.42 Ultra Deep Water Market Share Forecast 2019, 2024 and 2029 (% Share)
Figure 4.43 The Ultra Deep Water Market Forecast by Region 2019-2029 ($m)
Figure 4.44 The Ultra Deep Water Market CAPEX Share Forecast by Region 2019 (%)
Figure 4.45 The Ultra Deep Water Market CAPEX Share Forecast by Region 2024 (%)
Figure 4.46 The Ultra Deep Water Market CAPEX Share Forecast by Region 2029 (%)
Figure 5.1 The African SURF Market Forecast 2019-2029 ($m, AGR %)
Figure 5.2 African SURF CAPEX Market Share Forecasts 2019, 2024 and 2029 (%)
Figure 5.3 African SURF Water Depth Market Forecasts 2019-2029 ($m)
Figure 5.4 African SURF Hardware Market Forecast 2019-2029 ($m)
Figure 5.5 Nigerian and Angolan Oil Production 2006-2017 (Tbpd)
Figure 6.1 The Asia Pacific SURF Market Forecast 2019-2029 ($m, AGR %)
Figure 6.2 Asia Pacific SURF CAPEX Market Share Forecasts 2019, 2024 and 2029 (%)
Figure 6.3 Asia Pacific SURF Water Depth Market Forecast 2019-2029 ($mn)
Figure 6.4 Asia Pacific SURF Hardware Market Forecast 2019-2029 ($mn)
Figure 6.5 Australian Oil and Natural Gas Production 1996-2015 (Mtoe)
Figure 6.6 Indonesian Oil Production 2006-2017 (Tbpd)
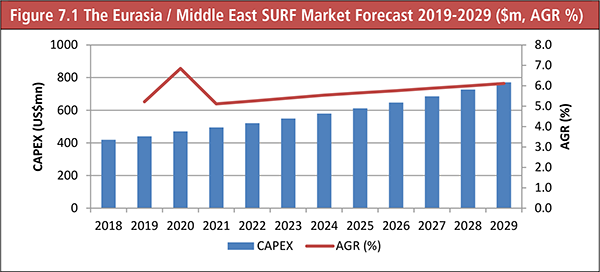
Figure 7.1 The Eurasia / Middle East SURF Market Forecast 2019-2029 ($m, AGR %)
Figure 7.2 The Eurasia / Middle East SURF CAPEX Market Share Forecast 2019, 2024 and 2029 (%)
Figure 7.3 Eurasia/Middle East SURF Water Depth Market Forecast 2019-2029 ($mn)
Figure 7.4 Eurasia/Middle East SURF Hardware Market Forecast 2019-2029 ($mn)
Figure 8.1 The North American SURF Market Forecast 2019-2029 ($m, AGR %)
Figure 8.2 The North American SURF CAPEX Market Share Forecasts 2019, 2024 and 2029 (%)
Figure 8.3 North American SURF Water Depth Market Forecast 2019-2029 ($mn)
Figure 8.4 North American SURF Hardware Market Forecast 2019-2029 ($mn)
Figure 8.5 Location of Active Offshore Oil and Gas Platforms in the US Gulf of Mexico
Figure 8.6 US Crude Oil Production 2007-2017 (Thousand bpd)
Figure 9.1 The South American SURF Market Forecast 2019-2029 ($m, AGR %)
Figure 9.2 The South American SURF CAPEX Market Share Forecast 2019, 2024 and 2029 (%)
Figure 9.3 South American SURF Water Depth Market Forecast 2019-2029 ($mn)
Figure 9.4 South American SURF Hardware Market Forecast 2019-2029 ($mn)
Figure 10.1 The Western European SURF Market Forecast 2019-2029 ($m, AGR %)
Figure 10.2 The Western European SURF CAPEX Market Share Forecast 2019, 2024 and 2029 (%)
Figure 10.3 Western Europe SURF Water Depth Market Forecast 2019-2029 ($mn)
Figure 10.4 Western Europe SURF Hardware Market Forecast 2019-2029 ($mn)
Figure 10.5 Norwegian Oil Production, Estimated Net Exports and Proved Reserves 2007-2017 (Thousand bpd, Bbbls)
Figure 10.6 The Number of Norwegian Exploration Wells Drilled 1970-2017
Figure 10.7 The Number of UK Exploration Wells Drilled 1970-2017
List of Tables
Table 1.1 Regional SURF Market Forecast 2019-2029 ($m, AGR %, Cumulative)
Table 2.1 Offshore Structures and Associated Water Depths (Structure, Water Category, Maximum Water Depth)
Table 2.2 Generations of Semi-submersibles (Riser Type, Characteristics)
Table 3.1 Global SURF Market Forecast 2019-2029 (US$mn, AGR %, CAGR %, Cumulative)
Table 3.2 Global SURF Market Forecast by Region 2019-2029 ($m, AGR %, Cumulative)
Table 3.3 Visiongain’s Anticipated Brent Crude Oil Price 2018, 2019, 2020-2022, 2023-2025, 2026-2029 ($/bbl)
Table 3.4 SURF Market Drivers & Restraints
Table 4.1 Global SURF Market Forecast by Hardware 2019-2029 ($m, AGR %, Cumulative)
Table 4.2 Global SURF Hardware Submarket CAGR Forecasts 2019-2024, 2024-2029 and 2019-2029 (%)
Table 4.3 Umbilicals Market Forecast 2019-2029 ($m, CAGR%, AGR %, Cumulative)
Table 4.4 The Umbilicals Market Forecast by Region 2019-2029 ($m, AGR %, Cumulative)
Table 4.5 The Risers Market Forecast 2019-2029 ($m, CAGR%, AGR %, Cumulative)
Table 4.6 The Risers Market Forecast by Region 2019-2029 ($m, AGR %, Cumulative)
Table 4.7 Flowlines Market Forecast 2019-2029 ($m, AGR %)
Table 4.8 The Flowlines Submarket Forecast by Region 2019-2029 ($m, AGR %, Cumulative)
Table 4.9 SURF Water Depth Market Forecasts 2019-2029 ($m, AGR %, Cumulative)
Table 4.10 SURF Water Depth Market CAGR Forecasts 2019-2024, 2024-2029 and 2019-2029 (%)
Table 4.11 Shallow Water Market Forecast 2019-2029 ($m, AGR %)
Table 4.12 The Shallow Water Market Forecast by Region 2019-2029 ($m, AGR %, Cumulative)
Table 4.13 Shallow Water SURF Market Drivers & Restraints
Table 4.14 Shallow Water SURF Contracts (Project Name, Location, Client, Contractor, Contract Period, $m Value, Water Depth, Details)
Table 4.15 Deep Water Market Forecast 2019-2029 ($m, AGR %)
Table 4.16 The Deep Water Submarket Forecast by Region 2019-2029 ($m, AGR %, Cumulative)
Table 4.17 Deepwater SURF Market Drivers & Restraints
Table 4.18 Deepwater SURF Contracts (Project Name, Location, Client, Contractor, Contract Period, $m Value, Water Depth, Details)
Table 4.19 Ultra Deep Water Market Forecast 2019-2029 ($m, AGR %)
Table 4.20 The Ultra Deep Water Market Forecast by Region 2019-2029 ($m, AGR %, Cumulative)
Table 4.21 Ultra-Deepwater SURF Market Drivers & Restraints
Table 4.22 Ultra-Deepwater SURF Contracts (Project Name, Location, Client, Contractor, Contract Period, $m Value, Water Depth, Details)
Table 5.1 The African SURF Market Forecast 2019-2029 ($m, AGR %, CAGR %, Cumulative)
Table 5.2 African SURF Water Depth & Hardware Submarket Forecasts 2019-2029 ($m, AGR %, Cumulative)
Table 5.3 Drivers and Restraints in African SURF Market
Table 5.4 African SURF Contracts (Project Name, Location, Client, Contractor, Contract Period, $m Value, Water Depth, Details)
Table 5.5 Potential Offshore Developments in Africa (Project, Operator, Water Depth, Country)
Table 6.1 The Asia Pacific SURF Market Forecast 2019-2029 ($m, AGR %, CAGR %, Cumulative)
Table 6.2 Asia Pacific SURF Water Depth & Hardware Submarket Forecasts 2019-2029 ($m, AGR %, Cumulative)
Table 6.3 Asia Pacific Deepwater Oil and Gas Fields (Project, Field Type, First Production, Operator, Country)
Table 6.4 Drivers and Restraints in Asia Pacific SURF Market
Table 6.5 Asia Pacific SURF Contracts (Project Name, Location, Client, Contractor, Contract Period, $m Value, Water Depth, Details)
Table 6.6 Potential Deepwater Offshore Developments in Asia Pacific (Project, Operator, Water Depth, Country)
Table 7.1 The Eurasia / Middle East SURF Market Forecast 2019-2029 ($m, AGR %, CAGR %, Cumulative)
Table 7.2 Eurasia / Middle East SURF Water Depth & Hardware Submarket Forecasts 2019-2029 ($m, AGR %, Cumulative)
Table 7.3 Drivers and Restraints in Eurasia/ Middle East SURF Market
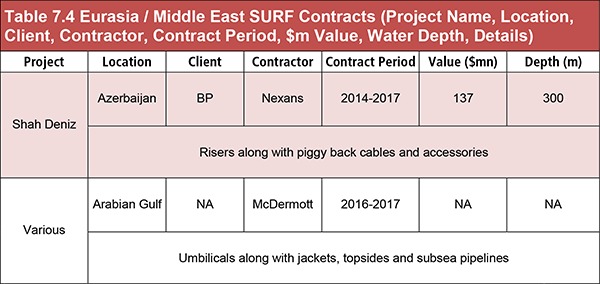
Table 7.4 Eurasia / Middle East SURF Contracts (Project Name, Location, Client, Contractor, Contract Period, $m Value, Water Depth, Details)
Table 8.1 The North American SURF Market Forecast 2019-2029 ($m, AGR %, CAGR %, Cumulative)
Table 8.2 North American SURF Water Depth & Hardware Submarket Forecasts 2019-2029 ($m, AGR %, Cumulative)
Table 8.3 Recent US Deepwater Projects (Field, Operator)
Table 8.4 Drivers and Restraints in the North American SURF Market
Table 8.5 North American SURF Contracts (Project Name, Location, Client, Contractor, Contract Period, $m Value, Water Depth, Details)
Table 8.6 Potential Deepwater and Ultra-Deepwater Developments in North America (Project, Operator, Country, Water Depth)
Table 9.1 The South American SURF Market Forecast 2019-2029 ($m, AGR %, CAGR %, Cumulative)
Table 9.2 South American SURF Water Depth & Hardware Submarket Forecasts 2019-2029 ($m, AGR %, Cumulative)
Table 9.3 Brazilian Deepwater FPSO Projects since 2010 (Name, Operator, Depth, Start Date, Completion Date)
Table 9.4 Drivers and Restraints in South America SURF Market
Table 9.5 South American SURF Contracts (Project Name, Location, Client, Contractor, Contract Period, $m Value, Water Depth, Details)
Table 10.1 The Western European SURF Market Forecast 2019-2029 ($m, AGR %, CAGR %, Cumulative)
Table 10.2 Western Europe SURF Water Depth & Hardware Submarket Forecasts 2019-2029 ($m, AGR %, Cumulative)
Table 10.3 Major North Sea Oil and Gas Fields with Subsea Production & Processing Systems (Project, Type, Water Depth, Operator, Production Start)
Table 10.4 Drivers and Restraints in the Western European SURF Market
Table 10.5 UK Oil and Gas Exploration Taxes (Tax, Details)
Table 10.6 UK Tax Allowance Field Types
Table 10.7 North Sea Subsea Production & Processing Systems Contracts (Project Name, Location, Client, Contractor, Contract Period, $m Value, Water Depth, Details)
Table 10.8 Potential Offshore Developments in the North Sea (Field Name, Location, Operator, Water Depth, Expected Production)
Table 10.9 Irish Offshore Fields with Subsea P&P Systems (Project, Majority Partner, Status)
Table 10.10 Irish Offshore Areas with Potential for Subsea P&P Systems (Field, Majority Partner, Water Depth, Estimated Reserves)
Table 12.1 Acteon Group 2017 (CEO, Strongest Business Region, HQ, Founded, No. of Employees, IR Contact, Ticker, Website)
Table 12.2 Aker Solutions 2018 (CEO, Strongest Business Region, HQ, Founded, No. of Employees, IR Contact, Ticker, Website)
Table 12.3 Aker Solutions Major SURF Contracts (Client, Project, Location, Award Date)
Table 12.4 Dril-Quip, Inc. Profile 2017 (CEO, Strongest Business Region, HQ, Founded, No. of Employees, IR Contact, Ticker, Website)
Table 12.5 Dril-Quip, Inc. Major Subsea Production & Processing Systems Contracts (Client, Project, Location, Award Year)
Table 12.6 EZRA Holdings Limited 2017 (CEO, Strongest Business Region, HQ, Founded, No. of Employees, IR Contact, Ticker, Website)
Table 12.7 EZRA Holdings Limited Major Subsea Production & Processing Systems Contracts (Client, Project, Location, Award Date)
Table 12.8 General Electric 2017 (CEO, Strongest Business Region, HQ, Founded, No. of Employees, IR Contact, Ticker, Website)
Table 12.9 General Electric Major Subsea Production & Processing Systems Contracts (Client, Project, Location, Award Year)
Table 12.10 Halliburton 2017 (CEO, Strongest Business Region, HQ, Founded, No. of Employees, IR Contact, Ticker, Website)
Table 12.11 Halliburton Major Subsea Production & Processing Systems Contracts (Client, Project, Location, Award Year)
Table 12.12 Oceaneering International Inc. 2017 (CEO, Strongest Business Region, HQ, Founded, No. of Employees, IR Contact, Ticker, Website)
Table 12.13 Oceaneering Service Divisions (Sector, Description)
Table 12.14 Oceaneering Subsea Production & Processing Systems Contracts (Client, Project, Location, Award Date)
Table 12.15 Prysmian Group 2017 (CEO, Strongest Business Region, HQ, Founded, No. of Employees, IR Contact, Ticker, Website)
Table 12.16 Saipem SpA 2017 (CEO, Strongest Business Region, HQ, Founded, No. of Employees, IR Contact, Ticker, Website)
Table 12.17 Saipem Major Subsea Production & Processing Systems Contracts (Client, Project, Location, Award Year)
Table 12.18 Schlumberger Limited 2017 (CEO, Strongest Business Region, HQ, Founded, No. of Employees, IR Contact, Ticker, Website)
Table 12.19 Schlumberger Limited Major Subsea Production & Processing Systems Contracts (Client, Project, Location, Award Year)
Table 12.20 Subsea 7 SA 2017 (CEO, Strongest Business Region, HQ, Founded, No. of Employees, IR Contact, Ticker, Website)
Table 12.21 Subsea 7 Major Subsea Production & Processing Systems Contracts (Client, Project, Location, Award Year)
Table 12.22 TechnipFMC plc 2017 (CEO, Strongest Business Region, HQ, Founded, No. of Employees, IR Contact, Ticker, Website)
Table 12.23 FMC Technologies Major Subsea Production & Processing Systems Contracts (Project, Client, Year Awarded, Depth, Location)
Table 12.24 Technip Subsea Production & Processing Systems Contracts (Client, Project, Location, Award Year)
Table 12.25 Other Leading Companies in the Subsea Production & Processing Systems Market (Company, Activity)
Table 13.1 Regional SURF Market Forecast 2019-2029 ($m, AGR %, Cumulative)
Table 13.2 SURF Water Depth and Hardware Market Forecasts 2019-2029 ($m, AGR %, Cumulative)