Laboratory Proficiency Testing Market

Laboratory Proficiency Testing Market by Industry (Clinical Diagnostics, Microbiology, Pharmaceutical, Food & Animal Feed, Water, Opioid), Technology (PCR, Cell Culture), and Region; Unmet Needs, Stakeholder & Buying Criteria - Global Forecast to 2028

Report Code: AST 7037 Oct, 2023, by marketsandmarkets.com

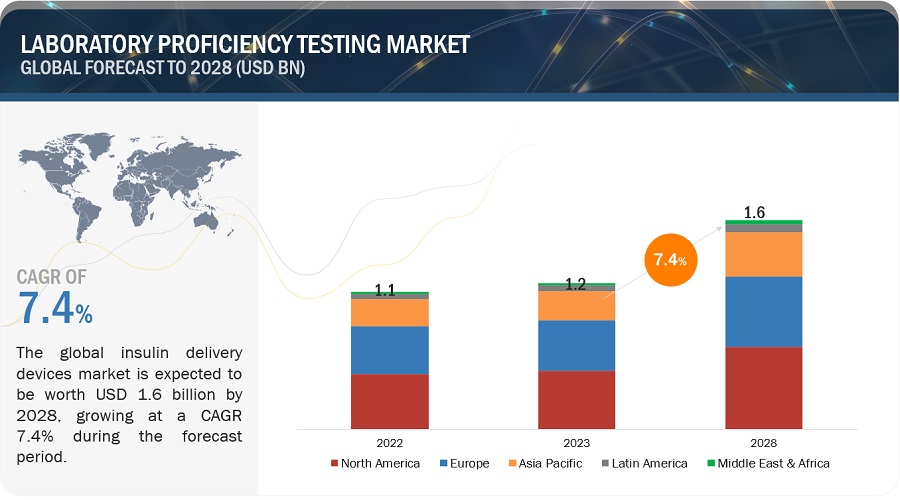
The global laboratory proficiency testing market in terms of revenue was estimated to be worth $1.2 billion in 2023 and is poised to reach $1.6 billion by 2028, growing at a CAGR of 7.4% from 2023 to 2028.The new research study consists of an industry trend analysis of the market. The new research study consists of industry trends, pricing analysis, patent analysis, conference and webinar materials, key stakeholders, and buying behaviour in the market. The proficiency testing market is projected to experience substantial expansion in the forecasted period due to its mandatory requirement for laboratories operating in various regulated industries like APIAC, CLIA, and CLSI. The market's growth is further bolstered by stringent safety and quality regulations governing food and pharmaceutical products, alongside a growing emphasis on water testing. However, the requirement of high capital investments for accurate and sensitive testing is expected to restrain the growth of this market during the forecast period.

In this report, the laboratory proficiency testing market is segmented based on industry, technology, and region.

Global Laboratory Proficiency Testing Market Trends
Laboratory Proficiency Testing Market

To know about the assumptions considered for the study, Request for Free Sample Report
Laboratory Proficiency Testing Market

Laboratory Proficiency Testing Market Dynamics

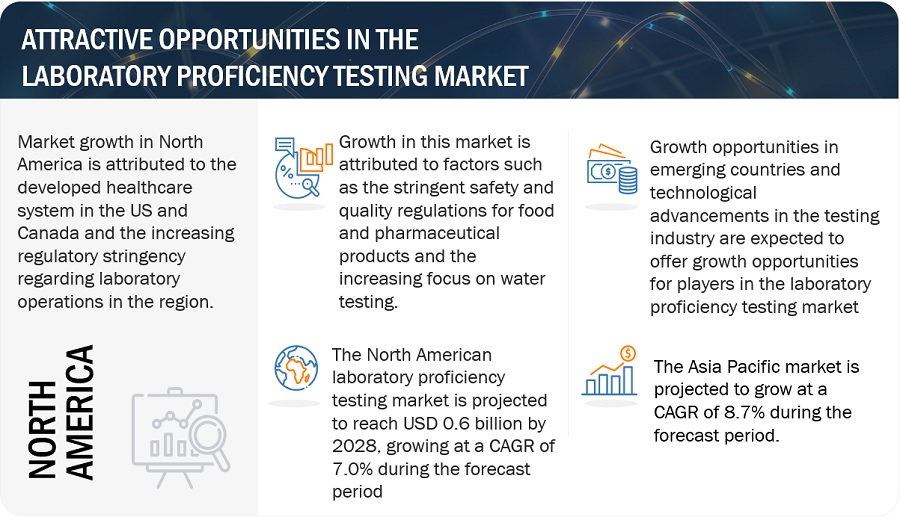
Driver: Stringent safety and quality regulations for food and pharmaceutical products

Growing complexities in the supply chain of food and pharmaceutical products, rising use of economic lack of adoption of proper hygiene, growing instances of adulteration, and sanitation practices during production, transportation, and storage, lack of awareness about allergens, growing instances of cross-contamination, and non-compliance with labeling laws have increased the incidence of contamination of final products, which in turn are responsible for large-scale outbreaks of foodborne illnesses in consumers. This has raised severe concerns among producers, regulatory authorities, end consumers, and other industry stakeholders.

To curb such violations, regulatory authorities across countries are focusing on framing and implementing strict safety and quality regulations. This has fueled the growth of the inspection, testing, and certification markets, with regulatory bodies such as the United States Department of Agriculture (USDA) and EFSA introducing guidelines for testing, inspection, and sampling services for the food industry to ensure the safety and quality of products. Thus, the increasing focus of regulatory organizations on product safety is driving the growth of the laboratory proficiency market.

Restraint: Requirement of high-capital investments for accurate and sensitive testing

The growing utilization of proficiency testing as a means for accreditation bodies to verify the credibility of laboratories engaged in accreditation initiatives is placing increased financial strain on the laboratories involved. The expenses tied to proficiency testing typically encompass the operational overhead costs of running a laboratory. These investments are necessary at different stages of proficiency testing programs, including program preparation, sample processing, sample handling, and shipment, as well as the interpretation and reporting phases. The need for thorough sample preparation necessitates laboratory analysts to employ sophisticated testing methodologies and advanced technologies. Advanced technologies, such as liquid chromatography (LC), high-performance liquid chromatography (HPLC), and spectrometry, are accurate, sensitive, and efficient. However, these technologies come with drawbacks, including prolonged sample preparation times and calibration challenges, contributing to the substantial investments needed for proficiency testing. Furthermore, many analytical methods are tailored to specific sample types, necessitating the adoption of more advanced techniques for substances like pharmaceuticals and opioids. This incorporation of advanced methods, however, escalates the overall testing expenses, thereby leading to increased capital outlays for laboratories.

Opportunity: Growth opportunities in emerging countries

Emerging economies such as China, India, and South Korea are expected to offer significant growth opportunities for players operating in the laboratory proficiency testing market. This can primarily be attributed to the presence of less stringent regulatory policies, low labor costs, and high growth in their respective pharmaceutical and food sectors.

These countries are attracting pharmaceutical companies not only because of the low-cost manufacturing advantage but also due to the high and growing incidence of chronic and infectious diseases, rising disposable income levels, improving access to healthcare services, and implementation of favorable government policies. The growing presence of global as well as local pharmaceutical and biopharmaceutical companies in these countries is, in turn, driving the demand for proficiency testing services.

Challenge: Logistical and data interpretation challenges

Participation in external PT programs, internal PT programs, and benchmarking or comparison studies (between laboratories using proficiency testing or reference materials) is needed for the validation and evaluation of test methods. However, certain logistical activities, such as shipping and handling of samples (availability of carriers or spills in traffic), need careful planning as they may potentially influence the end results. Also, the number of laboratories necessary to conduct a valid inter-laboratory comparison and the availability of a commercial PT program for a specific analyte of interest may also influence the overall results. These are some of the major challenges faced by laboratories while assessing their standards and gaining accreditation.

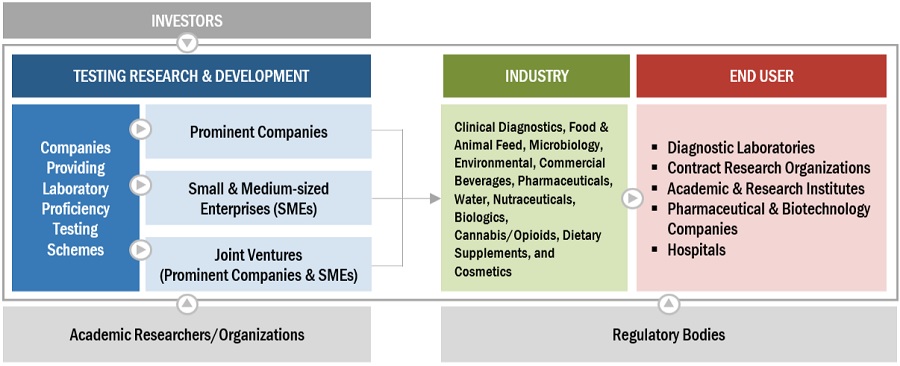
Laboratory Proficiency Testing Market Ecosystem Map
Laboratory Proficiency Testing Market Ecosystem

Based on industry, Clinical Diagnostics to account for the largest share of the laboratory proficiency testing industry during the forecast period.

Based on industry, the laboratory proficiency testing market is categorized into various segments, including clinical diagnostics, pharmaceuticals, microbiology, water analysis, environmental testing, food & animal feed, biologics, commercial beverages, cannabis/opioids, cosmetics, dietary supplements, and nutraceuticals. In the year 2022, the clinical diagnostics segment held the largest share of the market. This can be attributed to advancements in clinical diagnostic techniques, a rising demand for early and precise disease detection, increased government initiatives aimed at enhancing the quality and affordability of clinical diagnostic tests, and growing investments from both public and private sectors, including research funding and grants, aimed at developing innovative laboratory testing procedures.

Based on technology, the global laboratory proficiency testing market has been segmented into PCR, immunoassays, cell culture, spectrophotometry, chromatography , and other technologies. In 2022, the cell culture segment accounted for the largest share of the market. Growing awareness about the application of cell cultures in the production and testing of microbiology samples, biopharmaceuticals, and clinical diagnostic samples is supporting the growth of this market.

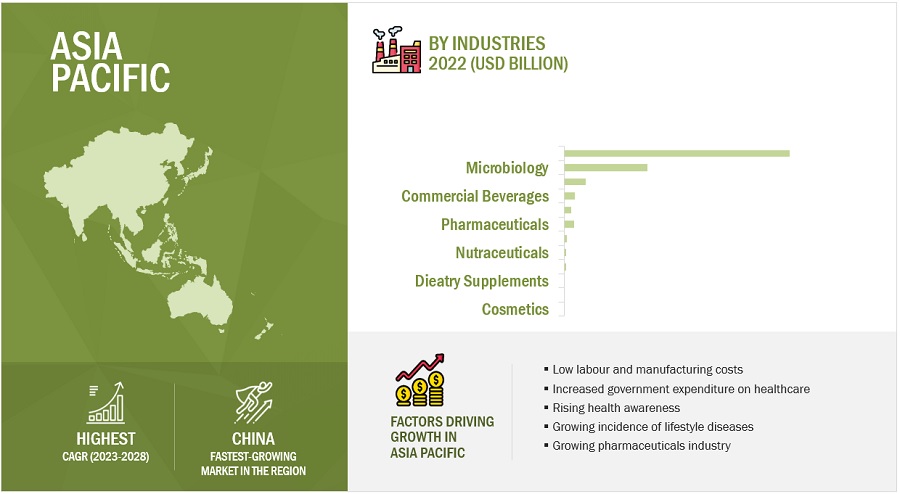
The APAC laboratory proficiency testing industry is projected to grow at the highest rate during the forecast period.

The laboratory proficiency testing market is anticipated to witness its highest growth rate in the Asia-Pacific (APAC) region during the forecast period. This can be attributed to the presence of emerging economies like China and India and the substantial expansion in outsourcing services in recent years. Additionally, Singapore is emerging as another promising market within the APAC region. Other than these APAC countries, Latin American countries also exhibit significant growth potential in the market. Most of this growth is driven by the significant growth in the healthcare industry. Technological advancements in clinical diagnostics, low-cost manufacturing advantage, microbiology, and pharmaceutical industries are contributing to the growth opportunities of the laboratory proficiency market in these regions.
Laboratory Proficiency Testing industry by Region

To know about the assumptions considered for the study, download the pdf brochure

The prominent players in this market are LGC Limited (UK), American Proficiency Institute (US), College of American Pathologists (US), Bio-Rad Laboratories (US), Randox Laboratories (UK), Merck (Germany), Fapas (UK), Waters Corporation (US), Weqas (UK), AOAC INTERNATIONAL (US).

Scope of the Laboratory Proficiency Testing Industry:

Report Metric

Details

Market Revenue in 2023

$1.2 billion

Estimated Value by 2028

$1.6 billion

Revenue Rate

Poised to grow at a CAGR of 7.4%

Market Driver

Stringent safety and quality regulations for food and pharmaceutical products

Market Opportunity

Growth opportunities in emerging countries

This report categorizes the global laboratory proficiency testing market to forecast revenue and analyze trends in each of the following submarkets:

By Industry

  • Clinical Diagnostics
    • Clinical Chemistry
    • Immunoassay/immunochemistry
    • Hematology
    • Molecular diagnostic
    • Cytology
    • Other Clinical Diagnostics
  • Microbiology
    • Pathogen Testing
    • Sterility Testing
    • Endotoxin & Pyrogen Testing
    • Growth Promotion Testing
    • Other Microbial Testing
  • Food & Animal Feed
    • Meat & Meat Products
    • Vegetables & Fruits
    • Dairy Products
    • Fish
    • Egss
    • Fat/oil
    • Other Food & Animal Feed
  • Commercial Beverages
    • Non-Alcoholic Beverages
    • Alcoholic Beverages
  • Environmental
  • Pharmaceuticals
    • Branded/Innovator Drugs
    • Generic Drugs
    • Over-THE -Counter Drugs
    • Biosimilars
  • Water
  • Nutraceuticals
  • Biologics
    • Monoclonal Antibodies
    • Vaccines
    • Blood
    • Tissue
  • Cannabis/Opioids
    • Potency Testing
    • Terpene Profiling
    • Residual Solvents
    • Pesticide Screening
    • Heavy Metal Testing
    • Other Cannabis/Opioids Testing
  • Dietary Supplements
  • Cosmetics
    • Trace Elements
    • Other Cosmetic Testing

By Technology

  • Cell Culture
  • PCR
  • Immunoassays
  • Chromatography
  • Spectrophotometry
  • Others

By Region

  • North America
    • US
    • Canada
  • Europe
    • Germany
    • UK
    • France
    • Italy
    • Spain
    • Russia
    • ROE
  • Asia Pacific
    • China
    • Japan
    • India
    • South Korea
    • RoPAC
  • Latin America
  • Middle East & Africa

Recent Developments of Laboratory Proficiency Testing Industry

  • In July 2023, LGC Limited (US) acquired Kavo International (US) to strengthen its portfolio of quality measurement tools.
  • In March 2023, the College of American Pathologists (US)launched a new proficiency testing program focused on the monkeypox (mpox) virus. By introducing the new mpox PT program, laboratories can enhance the quality assurance of their molecular testing process and contribute to the assurance of precise and dependent test outcomes, aiding in the detection of the mpox virus.
  • In April 2022, Spex CertiPrep (US) acquired NSI Lab Solutions (US) to strengthen its product portfolio in the proficiency testing segment.
  • In January 2022, Fera Science Ltd. - FAPAS (UK) formed a partnership with BioFront Technologies, which will act as the agent representing FAPAS proficiency testing services in the United States.
  • In October 2021, Waters Corporation (US) entered into a partnership with Sartorius AG (Germany). The objective of this collaboration was to offer bioprocess experts direct access to top-notch mass spectrometry (MS) data, thereby enhancing the efficiency and precision of biopharmaceutical process development.
  • Also in October 2021, Waters Corporation (US) partnered with the University of Delaware (US) to develop new analytical solutions for bioprocessing and biomanufacturing.

Frequently Asked Questions (FAQ):

To speak to our analyst for a discussion on the above findings, click Speak to Analyst

TABLE OF CONTENTS
 
1 INTRODUCTION (Page No. - 46)
    1.1 STUDY OBJECTIVES 
    1.2 MARKET DEFINITION 
           1.2.1 INCLUSIONS & EXCLUSIONS
    1.3 MARKET SCOPE 
           1.3.1 MARKETS COVERED
                    FIGURE 1 LABORATORY PROFICIENCY TESTING MARKET
           1.3.2 YEARS CONSIDERED
    1.4 CURRENCY 
    1.5 LIMITATIONS 
    1.6 STAKEHOLDERS 
    1.7 SUMMARY OF CHANGES 
 
2 RESEARCH METHODOLOGY (Page No. - 52)
    2.1 RESEARCH APPROACH 
          FIGURE 2 RESEARCH DESIGN
           2.1.1 SECONDARY DATA
                    2.1.1.1 Key data from secondary sources
           2.1.2 SECONDARY RESEARCH
           2.1.3 PRIMARY RESEARCH
                    FIGURE 3 PRIMARY SOURCES
                    2.1.3.1 Key data from primary sources
                                FIGURE 4 INSIGHTS FROM INDUSTRY EXPERTS
                    2.1.3.2 Breakdown of primary sources
                                FIGURE 5 BREAKDOWN OF PRIMARY INTERVIEWS: SUPPLY-SIDE AND DEMAND-SIDE PARTICIPANTS
                                FIGURE 6 BREAKDOWN OF PRIMARY INTERVIEW (SUPPLY SIDE): BY COMPANY TYPE,  DESIGNAITON AND REGION
    2.2 MARKET SIZE ESTIMATION 
           2.2.1 BOTTOM-UP APPROACH
                    FIGURE 7 LABORATORY PROFICIENCY TESTING INDUSTRY: BOTTOM-UP APPROACH
           2.2.2 TOP-DOWN APPROACH
                    FIGURE 8 MARKET: TOP-DOWN APPROACH
                    FIGURE 9 SUPPLY-SIDE MARKET SIZE ESTIMATION: REVENUE SHARE ANALYSIS
                    FIGURE 10 SUPPLY-SIDE MARKET SIZE ESTIMATION: MARKET (2022)
                    FIGURE 11 CAGR PROJECTIONS: SUPPLY-SIDE ANALYSIS
                    FIGURE 12 CAGR PROJECTIONS FROM ANALYSIS OF DRIVERS, RESTRAINTS, OPPORTUNITIES, AND CHALLENGES OF MARKET (2023–2028)
    2.3 MARKET BREAKDOWN AND DATA TRIANGULATION 
          FIGURE 13 DATA TRIANGULATION METHODOLOGY
    2.4 MARKET SHARE ESTIMATION 
    2.5 STUDY ASSUMPTIONS 
    2.6 RISK ASSESSMENT 
          TABLE 1 RISK ASSESSMENT: MARKET
    2.7 IMPACT OF RECESSION 
 
3 EXECUTIVE SUMMARY (Page No. - 67)
    FIGURE 14 LABORATORY PROFICIENCY TESTING MARKET, BY INDUSTRY,  2023 VS. 2028 (USD MILLION)
    FIGURE 15 LABORATORY PROFICIENCY TESTING INDUSTRY FOR CLINICAL DIAGNOSTICS INDUSTRY, BY TYPE, 2023 VS. 2028 (USD MILLION)
    FIGURE 16 MARKET FOR FOOD & ANIMAL FEED INDUSTRY, BY TYPE, 2023 VS. 2028 (USD MILLION)
    FIGURE 17 MARKET FOR MICROBIOLOGY INDUSTRY, BY TYPE, 2023 VS. 2028 (USD MILLION)
    FIGURE 18 MARKET FOR PHARMACEUTICAL INDUSTRY, BY TYPE, 2023 VS. 2028 (USD MILLION)
    FIGURE 19 MARKET, BY TECHNOLOGY,  2023 VS. 2028 (USD MILLION)
    FIGURE 20 GEOGRAPHICAL SNAPSHOT OF MARKET
 
4 PREMIUM INSIGHTS (Page No. - 75)
    4.1 LABORATORY PROFICIENCY TESTING MARKET OVERVIEW 
          FIGURE 21 STRINGENT SAFETY AND QUALITY REGULATIONS FOR FOOD AND PHARMACEUTICAL PRODUCTS TO DRIVE MARKET GROWTH
    4.2 LABORATORY PROFICIENCY TESTING INDUSTRY FOR CLINICAL DIAGNOSTICS INDUSTRY, BY TYPE (2023–2028) 
          FIGURE 22 CLINICAL CHEMISTRY SEGMENT TO REGISTER HIGHEST GROWTH RATE DURING FORECAST PERIOD
    4.3 ASIA PACIFIC: MARKET,  BY TECHNOLOGY AND COUNTRY (2022) 
          FIGURE 23 CELL CULTURE ACCOUNTED FOR LARGEST SHARE OF APAC MARKET IN 2022
    4.4 MARKET: GEOGRAPHIC MIX 
          FIGURE 24 CHINA TO REGISTER HIGHEST CAGR DURING FORECAST PERIOD
    4.5 MARKET:  DEVELOPED VS. EMERGING ECONOMIES 
          FIGURE 25 EMERGING ECONOMIES TO REGISTER HIGHER GROWTH RATES DURING FORECAST PERIOD
 
5 MARKET OVERVIEW (Page No. - 80)
    5.1 INTRODUCTION 
    5.2 MARKET DYNAMICS 
          FIGURE 26 LABORATORY PROFICIENCY TESTING MARKET: DRIVERS, RESTRAINTS, OPPORTUNITIES, AND CHALLENGES
           5.2.1 MARKET DRIVERS
                    5.2.1.1 Growing need for proficiency testing for operational excellence
                                FIGURE 27 CLIA-REGISTERED LABORATORIES GLOBALLY (2011–2022)
                    5.2.1.2 Stringent safety and quality regulations for food and pharmaceutical products
                                TABLE 2 FOOD SAFETY LEGISLATION IN DEVELOPING COUNTRIES
                                TABLE 3 REGULATORY AGENCIES FOR PHARMACEUTICAL INDUSTRY
                    5.2.1.3 Increasing focus on water testing
           5.2.2 MARKET RESTRAINTS
                    5.2.2.1 Requirement of high-capital investments for accurate and sensitive testing
                                TABLE 4 COST OF ADVANCED TECHNOLOGIES USED FOR PROFICIENCY TESTING
                    5.2.2.2 Complexity in testing techniques
           5.2.3 MARKET OPPORTUNITIES
                    5.2.3.1 Technological advancements in testing industry
                    5.2.3.2 Growth opportunities in emerging countries
                                FIGURE 28 PROJECTED PHARMACEUTICAL SALES IN ASIAN COUNTRIES (2022)
                    5.2.3.3 Increasing adoption of proficiency tests to prevent food adulteration
           5.2.4 MARKET CHALLENGES
                    5.2.4.1 Need for proficiency testing scheme harmonization
                    5.2.4.2 Logistical and data interpretation challenges
                    5.2.4.3 Dearth of skilled professionals
    5.3 INDUSTRY TRENDS 
           5.3.1 GROWING FOCUS ON ORGANIC GROWTH STRATEGIES
                    TABLE 5 NUMBER OF PRODUCT LAUNCHES, BY KEY PLAYER (JANUARY 2020 TO JULY 2023)
    5.4 TECHNOLOGY ANALYSIS 
    5.5 ECOSYSTEM ANALYSIS 
          TABLE 6 MARKET: ECOSYSTEM
          FIGURE 29 MARKET: ECOSYSTEM MAP
          FIGURE 30 MARKET: INDUSTRY AND TECHNOLOGY MAPPING
    5.6 VALUE CHAIN ANALYSIS 
          FIGURE 31 VALUE CHAIN ANALYSIS
    5.7 PORTER’S FIVE FORCES ANALYSIS 
          TABLE 7 MARKET: PORTER’S FIVE FORCES ANALYSIS
           5.7.1 THREAT OF NEW ENTRANTS
           5.7.2 THREAT OF SUBSTITUTES
           5.7.3 BARGAINING POWER OF BUYERS
           5.7.4 BARGAINING POWER OF SUPPLIERS
           5.7.5 INTENSITY OF COMPETITIVE RIVALRY
    5.8 PATENT ANALYSIS 
           5.8.1 PATENT PUBLICATION TRENDS FOR LABORATORY PROFICIENCY TESTING
                    FIGURE 32 PATENT PUBLICATION TRENDS (2011–2023)
           5.8.2 INSIGHTS: JURISDICTION AND TOP APPLICANT ANALYSIS
                    FIGURE 33 TOP APPLICANTS & OWNERS (COMPANIES/INSTITUTIONS) FOR PROFICIENCY TESTING PATENTS (JANUARY 2011–JULY 2023)
                    FIGURE 34 TOP APPLICANT COUNTRIES/REGIONS FOR PROFICIENCY TESTING PATENTS (JANUARY 2011–JULY 2023)
    5.9 TARIFF & REGULATORY LANDSCAPE 
           5.9.1 REGULATORY BODIES, GOVERNMENT AGENCIES, AND OTHER ORGANIZATIONS
                    TABLE 8 ICH QUALITY GUIDELINES FOR PHARMACEUTICAL GMP
                    TABLE 9 EUROPE: ACCREDITATION BODIES FOR MEDICAL LABORATORIES
                    TABLE 10 OVERVIEW OF GUIDELINES OF LABORATORY SERVICES
                    TABLE 11 RULES FOR PROFICIENCY TESTING LAID DOWN BY CNAS: REQUIREMENTS FOR SELECTION OF PROFICIENCY TESTING ACTIVITIES
           5.9.2 NORTH AMERICA
                    5.9.2.1 US
                    5.9.2.2 Canada
           5.9.3 EUROPE
                    TABLE 12 DEVELOPMENT OF GLP ACROSS COUNTRIES
                    TABLE 13 REGULATORY AUTHORITIES AND LAUNCH OF GLP MONITORING PROGRAMS IN EUROPEAN COUNTRIES
           5.9.4 ASIA PACIFIC
                    5.9.4.1 India
                    5.9.4.2 Japan
                    5.9.4.3 China
    5.1 PRICING ANALYSIS 
           5.10.1 AVERAGE SELLING PRICE TREND OF KEY PLAYERS, BY LABORATORY PROFICIENCY TESTING PROGRAM
                     TABLE 14 AVERAGE SELLING PRICE FOR LABORATORY PROFICIENCY TESTING PROGRAMS, BY KEY PLAYER (2022)
           5.10.2 INDICATIVE PRICING ANALYSIS, BY TECHNOLOGY
                     TABLE 15 AVERAGE PRICING ANALYSIS OF LABORATORY PROFICIENCY TESTING PROGRAMS (2022)
           5.10.3 INDICATIVE PRICING ANALYSIS, BY INDUSTRY
    5.11 TRENDS & DISRUPTIONS AFFECTING CUSTOMERS’ BUSINESSES 
           5.11.1 REVENUE SHIFT & NEW REVENUE POCKETS FOR MARKET
                     FIGURE 35 MARKET: TRENDS & DISRUPTIONS AFFECTING CUSTOMERS’ BUSINESSES
    5.12 KEY CONFERENCES & EVENTS IN 2023–2024 
           TABLE 16 MARKET: DETAILED LIST OF CONFERENCES & EVENTS
    5.13 KEY STAKEHOLDERS & BUYING CRITERIA 
           5.13.1 KEY STAKEHOLDERS IN BUYING PROCESS
                     FIGURE 36 INFLUENCE OF STAKEHOLDERS ON BUYING PROCESS OF LABORATORY PROFICIENCY TESTING SERVICES
                     TABLE 17 INFLUENCE OF STAKEHOLDERS ON BUYING PROCESS OF LABORATORY PROFICIENCY TESTING SERVICES (%)
           5.13.2 BUYING CRITERIA FOR LABORATORY PROFICIENCY TESTING SERVICES
                     FIGURE 37 KEY BUYING CRITERIA FOR INDUSTRIES
                     TABLE 18 KEY BUYING CRITERIA FOR INDUSTRIES
    5.14 UNMET NEEDS 
           TABLE 19 UNMET NEEDS IN MARKET
           5.14.1 END-USER EXPECTATIONS
                     TABLE 20 END-USER EXPECTATIONS IN MARKET
 
6 LABORATORY PROFICIENCY TESTING MARKET, BY INDUSTRY (Page No. - 111)
    6.1 INTRODUCTION 
          TABLE 21 LABORATORY PROFICIENCY TESTING INDUSTRY, BY INDUSTRY, 2021–2028 (USD MILLION)
    6.2 CLINICAL DIAGNOSTICS 
          TABLE 22 MARKET FOR CLINICAL DIAGNOSTICS INDUSTRY,  BY TYPE, 2021–2028 (USD MILLION)
          TABLE 23 MARKET FOR CLINICAL DIAGNOSTICS INDUSTRY,  BY COUNTRY, 2021–2028 (USD MILLION)
           6.2.1 DRIVERS
                    6.2.1.1 Increasing adoption of fully automated instruments and automation in laboratories
                    6.2.1.2 Growth opportunities in developing economies
           6.2.2 RESTRAINTS
                    6.2.2.1 Procedural shift from lab-based to home-based/point-of-care testing procedures
           6.2.3 MARKET FOR CLINICAL DIAGNOSTICS INDUSTRY, BY TYPE
                    6.2.3.1 Clinical chemistry
                               6.2.3.1.1 Ongoing development and launch of new clinical chemistry tests to support growth
                                               TABLE 24 MARKET FOR CLINICAL CHEMISTRY, BY COUNTRY, 2021–2028 (USD MILLION)
                    6.2.3.2 Immunology/immunochemistry
                               6.2.3.2.1 High adoption of novel immunology tests in developed countries to favor market growth
                                               TABLE 25 MARKET FOR IMMUNOLOGY/IMMUNOCHEMISTRY, BY COUNTRY, 2021–2028 (USD MILLION)
                    6.2.3.3 Hematology
                               6.2.3.3.1 Future breakthroughs in stem cell research, genetic therapies, and proteomics to boost market
                                               TABLE 26 MARKET FOR HEMATOLOGY, BY COUNTRY,  2021–2028 (USD MILLION)
                    6.2.3.4 Molecular diagnostics
                               6.2.3.4.1 Increasing incidence of influenza, tuberculosis, sexually transmitted diseases, and hepatitis to boost demand
                                               TABLE 27 MARKET FOR MOLECULAR DIAGNOSTICS,  BY COUNTRY, 2021–2028 (USD MILLION)
                    6.2.3.5 Cytology
                               6.2.3.5.1 Development of advanced techniques for anatomic pathology to propel growth
                                               TABLE 28 MARKET FOR CYTOLOGY,  BY COUNTRY, 2021–2028 (USD MILLION)
                    6.2.3.6 Other clinical diagnostic tests
                                TABLE 29 MARKET FOR OTHER CLINICAL DIAGNOSTIC TESTS, BY COUNTRY, 2021–2028 (USD MILLION)
    6.3 MICROBIOLOGY 
          TABLE 30 MARKET FOR MICROBIOLOGY INDUSTRY, BY TYPE,  2021–2028 (USD MILLION)
          TABLE 31 MARKET FOR MICROBIOLOGY INDUSTRY, BY COUNTRY, 2021–2028 (USD MILLION)
           6.3.1 DRIVERS
                    6.3.1.1 Stringent safety regulations
           6.3.2 MARKET FOR MICROBIOLOGY INDUSTRY, BY TYPE
                    6.3.2.1 Pathogen testing
                               6.3.2.1.1 Growing need to detect pathogens and spoilage in food & beverage industry to boost market
                                               TABLE 32 MARKET FOR PATHOGEN TESTING, BY COUNTRY, 2021–2028 (USD MILLION)
                    6.3.2.2 Sterility testing
                               6.3.2.2.1 Need to provide accurate investigations of quality of raw materials in pharmaceutical industry to support adoption
                                               TABLE 33 MARKET FOR STERILITY TESTING, BY COUNTRY, 2021–2028 (USD MILLION)
                    6.3.2.3 Endotoxin & pyrogen testing
                               6.3.2.3.1 Need to detect bacterial toxins and pyrogens in products intended for human use to favor growth
                                               TABLE 34 MARKET FOR ENDOTOXIN & PYROGEN TESTING,  BY COUNTRY, 2021–2028 (USD MILLION)
                    6.3.2.4 Growth promotion testing
                               6.3.2.4.1 Need to determine suitability of culture media used for microbial enumeration and sterility tests to fuel growth
                                               TABLE 35 MARKET FOR GROWTH PROMOTION TESTING,  BY COUNTRY, 2021–2028 (USD MILLION)
                    6.3.2.5 Other microbiology tests
                                TABLE 36 MARKET FOR OTHER MICROBIOLOGY TESTS,  BY COUNTRY, 2021–2028 (USD MILLION)
    6.4 FOOD & ANIMAL FEED 
          TABLE 37 MARKET FOR FOOD & ANIMAL FEED INDUSTRY,  BY TYPE, 2021–2028 (USD MILLION)
          TABLE 38 MARKET FOR FOOD & ANIMAL FEED INDUSTRY,  BY COUNTRY, 2021–2028 (USD MILLION)
           6.4.1 DRIVERS
                    6.4.1.1 Stringent food safety regulations
                    6.4.1.2 Increasing outbreaks of foodborne illnesses
                    6.4.1.3 Increasing demand for packaged food products
                    6.4.1.4 Increasing cases of chemical contamination in food processing and manufacturing
           6.4.2 RESTRAINTS
                    6.4.2.1 Lack of harmonization of food safety regulations
                    6.4.2.2 Lack of food control infrastructure in developing countries
           6.4.3 MARKET FOR FOOD & ANIMAL FEED INDUSTRY, BY TYPE
                    6.4.3.1 Meat & meat product testing
                               6.4.3.1.1 Growing availability of programs for testing of nitrates and nitrites in meat products to drive growth
                                               TABLE 39 MARKET FOR MEAT & MEAT PRODUCT TESTING,  BY COUNTRY, 2021–2028 (USD MILLION)
                    6.4.3.2 Fruit & vegetable testing
                               6.4.3.2.1 Growing outbreaks of foodborne illnesses to propel market
                                               TABLE 40 MARKET FOR FRUIT & VEGETABLE TESTING,  BY COUNTRY, 2021–2028 (USD MILLION)
                    6.4.3.3 Dairy product testing
                               6.4.3.3.1 Stringent regulations and increasing consumer demand for high-quality and safe dairy products to propel growth
                                               TABLE 41 MARKET FOR DAIRY PRODUCT TESTING,  BY COUNTRY, 2021–2028 (USD MILLION)
                    6.4.3.4 Fish testing
                               6.4.3.4.1 Need to check for authenticity, adulteration, and presence of allergens in fish and fish products to fuel growth
                                               TABLE 42 MARKET FOR FISH TESTING,  BY COUNTRY, 2021–2028 (USD MILLION)
                    6.4.3.5 Egg testing
                               6.4.3.5.1 Need to detect Fipronil in eggs and egg-based products to favor market growth
                                               TABLE 43 MARKET FOR EGG TESTING,  BY COUNTRY, 2021–2028 (USD MILLION)
                    6.4.3.6 Fat/oil testing
                               6.4.3.6.1 Growing demand for fat/oil proficiency testing programs to boost market
                                                TABLE 44 MARKET FOR FAT/OIL TESTING,  BY COUNTRY, 2021–2028 (USD MILLION)
                    6.4.3.7 Other food & animal feed tests
                                TABLE 45 MARKET FOR OTHER FOOD & ANIMAL FEED TESTS,  BY COUNTRY, 2021–2028 (USD MILLION)
    6.5 COMMERCIAL BEVERAGES 
          TABLE 46 MARKET FOR COMMERCIAL BEVERAGES INDUSTRY, BY TYPE, 2021–2028 (USD MILLION)
          TABLE 47 MARKET FOR COMMERCIAL BEVERAGES INDUSTRY, BY COUNTRY, 2021–2028 (USD MILLION)
           6.5.1 DRIVERS
                    6.5.1.1 Rising consumption of commercial beverages
           6.5.2 RESTRAINTS
                    6.5.2.1 High capital investments
           6.5.3 MARKET FOR COMMERCIAL BEVERAGES INDUSTRY, BY TYPE
                    6.5.3.1 Non-alcoholic beverages
                               6.5.3.1.1 Increasing awareness about presence of antioxidants in non-alcohol beverages to drive consumption
                                               TABLE 48 MARKET FOR NON-ALCOHOLIC BEVERAGES, BY COUNTRY, 2021–2028 (USD MILLION)
                    6.5.3.2 Alcoholic beverages
                               6.5.3.2.1 Rapid economic growth and changes in lifestyles to support demand for alcoholic beverages
                                               TABLE 49 MARKET FOR ALCOHOLIC BEVERAGES, BY COUNTRY, 2021–2028 (USD MILLION)
    6.6 ENVIRONMENTAL 
           6.6.1 NEED TO REDUCE EMISSIONS AND PREVENT EXPOSURE TO TOXIC CHEMICALS TO BOOST MARKET
                    TABLE 50 MARKET FOR ENVIRONMENTAL INDUSTRY, BY COUNTRY, 2021–2028 (USD MILLION)
           6.6.2 DRIVERS
                    6.6.2.1 Privatization of environmental testing services
                    6.6.2.2 Environment protection regulations
                                TABLE 51 PROMINENT ENVIRONMENT PROTECTION REGULATIONS, BY COUNTRY
                    6.6.2.3 Availability of cost- and time-efficient customized testing services
           6.6.3 RESTRAINTS
                    6.6.3.1 Lack of basic supporting infrastructure
    6.7 PHARMACEUTICAL 
          TABLE 52 MARKET FOR PHARMACEUTICAL INDUSTRY, BY TYPE, 2021–2028 (USD MILLION)
          TABLE 53 MARKET FOR PHARMACEUTICAL INDUSTRY,  BY COUNTRY, 2021–2028 (USD MILLION)
           6.7.1 DRIVERS
                    6.7.1.1 Stringent quality control in production of pharmaceutical products
                    6.7.1.2 Growth in pharmaceutical industry
                                FIGURE 38 GLOBAL PHARMACEUTICAL DRUG SALES, 2012–2022 (USD BILLION)
                    6.7.1.3 Surge in generics market
                    6.7.1.4 Emerging biosimilars market
           6.7.2 RESTRAINTS
                    6.7.2.1 Cost- and time-intensive drug manufacturing process
           6.7.3 MARKET FOR PHARMACEUTICAL INDUSTRY, BY TYPE
                    6.7.3.1 Branded/innovator drug testing
                               6.7.3.1.1 Rising demand for prescription drugs for treatment of various diseases to support growth
                                               TABLE 54 MARKET FOR BRANDED/INNOVATOR DRUG TESTING, BY COUNTRY, 2021–2028 (USD MILLION)
                    6.7.3.2 Generic drug testing
                               6.7.3.2.1 Government initiatives to promote usage of generics to control healthcare expenses
                                               TABLE 55 MARKET FOR GENERIC DRUG TESTING, BY COUNTRY, 2021–2028 (USD MILLION)
                    6.7.3.3 Over-the-counter drug testing
                               6.7.3.3.1 Increased penetration of OTC drugs in emerging markets to fuel growth
                                               TABLE 56 MARKET FOR OVER-THE-COUNTER DRUG TESTING, BY COUNTRY, 2021–2028 (USD MILLION)
                    6.7.3.4 Biosimilar testing
                               6.7.3.4.1 Growing demand for biosimilar drugs due to cost-effectiveness to boost adoption
                                               TABLE 57 MARKET FOR BIOSIMILAR TESTING,  BY COUNTRY, 2021–2028 (USD MILLION)
    6.8 WATER 
          TABLE 58 MARKET FOR WATER INDUSTRY, BY COUNTRY,  2021–2028 (USD MILLION)
           6.8.1 DRIVERS
                    6.8.1.1 Growing industrial applications
                    6.8.1.2 Increasing need for microbial water quality analysis
           6.8.2 RESTRAINTS
                    6.8.2.1 Limited market penetration in non-industrial applications
    6.9 NUTRACEUTICAL 
           6.9.1 GROWING NUTRACEUTICAL MARKET TO INCREASE NEED FOR PROFICIENCY TESTING
                    TABLE 59 MARKET FOR NUTRACEUTICAL INDUSTRY,  BY COUNTRY, 2021–2028 (USD MILLION)
    6.10 BIOLOGICS 
           TABLE 60 MARKET FOR BIOLOGICS INDUSTRY, BY TYPE,  2021–2028 (USD MILLION)
           TABLE 61 MARKET FOR BIOLOGICS INDUSTRY, BY COUNTRY,  2021–2028 (USD MILLION)
           6.10.1 DRIVERS
                    6.10.1.1 Growing R&D investments in life science industry
                    6.10.1.2 High incidence and large economic burden of chronic diseases
           6.10.2 RESTRAINTS
                    6.10.2.1 Dearth of skilled professionals
           6.10.3 MARKET FOR BIOLOGICS INDUSTRY, BY TYPE
                    6.10.3.1 Monoclonal antibody testing
                               6.10.3.1.1 Growing number of mAb product candidates currently in development to boost market
                                                TABLE 62 MARKET FOR MONOCLONAL ANTIBODY TESTING,  BY COUNTRY, 2021–2028 (USD MILLION)
                    6.10.3.2 Vaccine testing
                               6.10.3.2.1 Increased global vaccine production to drive market growth
                                                TABLE 63 MARKET FOR VACCINE TESTING,  BY COUNTRY, 2021–2028 (USD MILLION)
                    6.10.3.3 Blood testing
                               6.10.3.3.1 Growing need to test for quality and safety of blood and blood products to fuel growth
                                                TABLE 64 MARKET FOR BLOOD TESTING, BY COUNTRY, 2021–2028 (USD MILLION)
                    6.10.3.4 Tissue testing
                               6.10.3.4.1 Growing use of tissue-based therapies for treatment of various diseases to favor market growth
                                                TABLE 65 MARKET FOR TISSUE TESTING, BY COUNTRY, 2021–2028 (USD MILLION)
    6.11 CANNABIS/OPIOIDS 
           TABLE 66 MARKET FOR CANNABIS/OPIOIDS INDUSTRY,  BY TYPE, 2021–2028 (USD MILLION)
           TABLE 67 MARKET FOR CANNABIS/OPIOIDS INDUSTRY,  BY COUNTRY, 2021–2028 (USD MILLION)
           6.11.1 DRIVERS
                    6.11.1.1 Legalization of medical cannabis and growing number of cannabis testing laboratories
                    6.11.1.2 Emerging markets
                    6.11.1.3 Growing adoption of LIMS in cannabis testing laboratories
                    6.11.1.4 Increasing awareness
           6.11.2 RESTRAINTS
                    6.11.2.1 Dearth of trained laboratory professionals
                    6.11.2.2 Lack of industry standards for cannabis testing
                    6.11.2.3 High start-up costs for cannabis testing laboratories
           6.11.3 MARKET FOR CANNABIS/OPIOIDS INDUSTRY, BY TYPE
                    6.11.3.1 Potency testing
                               6.11.3.1.1 Increasing legalization of medical cannabis to boost market
                                                TABLE 68 MARKET FOR POTENCY TESTING, BY COUNTRY, 2021–2028 (USD MILLION)
                    6.11.3.2 Terpene profiling
                               6.11.3.2.1 Growing demand for terpene profiling for confirming identity and authenticity of select products to support growth
                                                TABLE 69 MARKET FOR TERPENE PROFILING, BY COUNTRY, 2021–2028 (USD MILLION)
                    6.11.3.3 Residual solvent testing
                               6.11.3.3.1 Need to remove residual solvents due to their harmful effects to boost demand
                                                TABLE 70 MARKET FOR RESIDUAL SOLVENT TESTING,  BY COUNTRY, 2021–2028 (USD MILLION)
                    6.11.3.4 Pesticide screening
                               6.11.3.4.1 Importance of pesticide removal prior to cannabis consumption to propel market
                                                TABLE 71 MARKET FOR PESTICIDE SCREENING, BY COUNTRY, 2021–2028 (USD MILLION)
                    6.11.3.5 Heavy metal testing
                               6.11.3.5.1 Need to ensure cannabis products are free from toxic metals to drive growth
                                                TABLE 72 MARKET FOR HEAVY METAL TESTING, BY COUNTRY, 2021–2028 (USD MILLION)
                    6.11.3.6 Other cannabis/opioids tests
                                 TABLE 73 MARKET FOR OTHER CANNABIS/OPIOIDS TESTS,  BY COUNTRY, 2021–2028 (USD MILLION)
    6.12 DIETARY SUPPLEMENTS 
           6.12.1 NEED TO ENSURE SAFETY AND QUALITY OF DIETARY SUPPLEMENTS TO DRIVE MARKET
                     TABLE 74 MARKET FOR DIETARY SUPPLEMENTS INDUSTRY,  BY COUNTRY, 2021–2028 (USD MILLION)
    6.13 COSMETIC 
           TABLE 75 MARKET FOR COSMETIC INDUSTRY, BY TYPE,  2021–2028 (USD MILLION)
           TABLE 76 MARKET FOR COSMETIC INDUSTRY, BY COUNTRY,  2021–2028 (USD MILLION)
           6.13.1 DRIVERS
                    6.13.1.1 Opposition to animal testing
                    6.13.1.2 Customer interest in environmentally friendly and sustainable product ingredients in cosmetics and personal care products
           6.13.2 MARKET FOR COSMETIC INDUSTRY, BY TYPE
                    6.13.2.1 Trace elements testing
                               6.13.2.1.1 Need to detect contaminants such as arsenic and lead in cosmetics to drive growth
                                               TABLE 77 MARKET FOR TRACE ELEMENTS TESTING,  BY COUNTRY, 2021–2028 (USD MILLION)
                    6.13.2.2 Other cosmetic tests
                                 TABLE 78 MARKET FOR OTHER COSMETIC TESTS, BY COUNTRY,  2021–2028 (USD MILLION)
 
7 LABORATORY PROFICIENCY TESTING MARKET, BY TECHNOLOGY (Page No. - 184)
    7.1 INTRODUCTION 
          TABLE 79 LABORATORY PROFICIENCY TESTING INDUSTRY, BY TECHNOLOGY,  2021–2028 (USD MILLION)
    7.2 CELL CULTURE 
           7.2.1 GROWING USE OF CELL CULTURES IN PRODUCTION AND TESTING OF VARIOUS BIOPHARMACEUTICALS TO SUPPORT MARKET GROWTH
                    TABLE 80 MARKET FOR CELL CULTURE, BY COUNTRY,  2021–2028 (USD MILLION)
    7.3 POLYMERASE CHAIN REACTION (PCR) 
           7.3.1 HIGH SPECIFICITY AND ACCURACY OF PCR TO BOOST DEMAND
                    TABLE 81 MARKET FOR PCR, BY COUNTRY,  2021–2028 (USD MILLION)
    7.4 IMMUNOASSAYS 
           7.4.1 EMERGENCE OF COST-EFFECTIVE TECHNOLOGIES AND LABORATORY AUTOMATION FOR IMMUNOASSAYS TO DRIVE MARKET
                    TABLE 82 MARKET FOR IMMUNOASSAYS, BY COUNTRY,  2021–2028 (USD MILLION)
    7.5 CHROMATOGRAPHY 
           7.5.1 HIGH ADOPTION OF CHROMATOGRAPHY IN BIOLOGICS AND PHARMACEUTICAL INDUSTRY TO DRIVE MARKET
                    TABLE 83 MARKET FOR CHROMATOGRAPHY, BY COUNTRY,  2021–2028 (USD MILLION)
    7.6 SPECTROPHOTOMETRY 
           7.6.1 TECHNOLOGICAL ADVANCEMENTS TO DRIVE MARKET GROWTH
                    TABLE 84 MARKET FOR SPECTROPHOTOMETRY, BY COUNTRY,  2021–2028 (USD MILLION)
    7.7 OTHER TECHNOLOGIES 
          TABLE 85 MARKET FOR OTHER TECHNOLOGIES, BY COUNTRY,  2021–2028 (USD MILLION)
 
8 LABORATORY PROFICIENCY TESTING MARKET, BY REGION (Page No. - 195)
    8.1 INTRODUCTION 
          TABLE 86 LABORATORY PROFICIENCY TESTING INDUSTRY, BY REGION, 2021–2028 (USD MILLION)
    8.2 NORTH AMERICA 
           8.2.1 NORTH AMERICA: RECESSION IMPACT
                    FIGURE 39 NORTH AMERICA: LABORATORY PROFICIENCY TESTING MARKET SNAPSHOT
                    TABLE 87 NORTH AMERICA: MARKET, BY COUNTRY,  2021–2028 (USD MILLION)
                    TABLE 88 NORTH AMERICA: MARKET, BY INDUSTRY,  2021–2028 (USD MILLION)
                    TABLE 89 NORTH AMERICA: MARKET FOR CLINICAL DIAGNOSTICS INDUSTRY, BY TYPE, 2021–2028 (USD MILLION)
                    TABLE 90 NORTH AMERICA: MARKET FOR MICROBIOLOGY INDUSTRY, BY TYPE, 2021–2028 (USD MILLION)
                    TABLE 91 NORTH AMERICA: MARKET FOR FOOD & ANIMAL FEED INDUSTRY, BY TYPE, 2021–2028 (USD MILLION)
                    TABLE 92 NORTH AMERICA: MARKET FOR COMMERCIAL BEVERAGES INDUSTRY, BY TYPE, 2021–2028 (USD MILLION)
                    TABLE 93 NORTH AMERICA: MARKET FOR PHARMACEUTICAL INDUSTRY, BY TYPE, 2021–2028 (USD MILLION)
                    TABLE 94 NORTH AMERICA: MARKET FOR BIOLOGICS INDUSTRY, BY TYPE, 2021–2028 (USD MILLION)
                    TABLE 95 NORTH AMERICA: MARKET FOR COSMETIC INDUSTRY, BY TYPE, 2021–2028 (USD MILLION)
                    TABLE 96 NORTH AMERICA: MARKET FOR CANNABIS/OPIOIDS INDUSTRY, BY TYPE, 2021–2028 (USD MILLION)
                    TABLE 97 NORTH AMERICA: LABORATORY PROFICIENCY TESTING INDUSTRY, BY TECHNOLOGY,  2021–2028 (USD MILLION)
           8.2.2 US
                    8.2.2.1 US to dominate North American laboratory proficiency testing market during forecast period
                                TABLE 98 US: MARKET, BY INDUSTRY,  2021–2028 (USD MILLION)
                                TABLE 99 US: MARKET FOR CLINICAL DIAGNOSTICS INDUSTRY, BY TYPE, 2021–2028 (USD MILLION)
                                TABLE 100 US: MARKET FOR MICROBIOLOGY INDUSTRY,  BY TYPE, 2021–2028 (USD MILLION)
                                TABLE 101 US: MARKET FOR FOOD & ANIMAL FEED INDUSTRY, BY TYPE, 2021–2028 (USD MILLION)
                                TABLE 102 US: MARKET FOR COMMERCIAL BEVERAGES INDUSTRY, BY TYPE, 2021–2028 (USD MILLION)
                                TABLE 103 US: MARKET FOR PHARMACEUTICAL INDUSTRY,  BY TYPE, 2021–2028 (USD MILLION)
                                TABLE 104 US: MARKET FOR BIOLOGICS INDUSTRY, BY TYPE,  2021–2028 (USD MILLION)
                                TABLE 105 US: MARKET FOR COSMETIC INDUSTRY, BY TYPE,  2021–2028 (USD MILLION)
                                TABLE 106 US: MARKET FOR CANNABIS/OPIOIDS INDUSTRY, BY TYPE, 2021–2028 (USD MILLION)
                                TABLE 107 US: MARKET, BY TECHNOLOGY,  2021–2028 (USD MILLION)
           8.2.3 CANADA
                    8.2.3.1 Growing demand for analytical testing services to support growth
                                TABLE 108 CANADA: LABORATORY PROFICIENCY TESTING MARKET, BY INDUSTRY,  2021–2028 (USD MILLION)
                                TABLE 109 CANADA: MARKET FOR CLINICAL DIAGNOSTICS INDUSTRY, BY TYPE, 2021–2028 (USD MILLION)
                                TABLE 110 CANADA: MARKET FOR MICROBIOLOGY INDUSTRY, BY TYPE, 2021–2028 (USD MILLION)
                                TABLE 111 CANADA: MARKET FOR FOOD & ANIMAL FEED INDUSTRY, BY TYPE, 2021–2028 (USD MILLION)
                                TABLE 112 CANADA: MARKET FOR COMMERCIAL BEVERAGES INDUSTRY, BY TYPE, 2021–2028 (USD MILLION)
                                TABLE 113 CANADA: MARKET FOR PHARMACEUTICAL INDUSTRY, BY TYPE, 2021–2028 (USD MILLION)
                                TABLE 114 CANADA: MARKET FOR BIOLOGICS INDUSTRY,  BY TYPE, 2021–2028 (USD MILLION)
                                TABLE 115 CANADA: MARKET FOR COSMETIC INDUSTRY,  BY TYPE, 2021–2028 (USD MILLION)
                                TABLE 116 CANADA: MARKET FOR CANNABIS/OPIOIDS INDUSTRY, BY TYPE, 2021–2028 (USD MILLION)
                                TABLE 117 CANADA: LABORATORY PROFICIENCY TESTING INDUSTRY, BY TECHNOLOGY,  2021–2028 (USD MILLION)
    8.3 EUROPE 
           8.3.1 EUROPE: RECESSION IMPACT
                    TABLE 118 EUROPE: LABORATORY PROFICIENCY TESTING MARKET, BY COUNTRY,  2021–2028 (USD MILLION)
                    TABLE 119 EUROPE: MARKET, BY INDUSTRY,  2021–2028 (USD MILLION)
                    TABLE 120 EUROPE: MARKET FOR CLINICAL DIAGNOSTICS INDUSTRY, BY TYPE, 2021–2028 (USD MILLION)
                    TABLE 121 EUROPE: MARKET FOR PHARMACEUTICAL INDUSTRY, BY TYPE, 2021–2028 (USD MILLION)
                    TABLE 122 EUROPE: MARKET FOR BIOLOGICS INDUSTRY,  BY TYPE, 2021–2028 (USD MILLION)
                    TABLE 123 EUROPE: MARKET FOR MICROBIOLOGY INDUSTRY, BY TYPE, 2021–2028 (USD MILLION)
                    TABLE 124 EUROPE: MARKET FOR COSMETIC INDUSTRY,  BY TYPE, 2021–2028 (USD MILLION)
                    TABLE 125 EUROPE: MARKET FOR CANNABIS/OPIOIDS INDUSTRY, BY TYPE, 2021–2028 (USD MILLION)
                    TABLE 126 EUROPE: MARKET FOR FOOD & ANIMAL FEED INDUSTRY, BY TYPE, 2021–2028 (USD MILLION)
                    TABLE 127 EUROPE: MARKET FOR COMMERCIAL BEVERAGES INDUSTRY, BY TYPE, 2021–2028 (USD MILLION)
                    TABLE 128 EUROPE: MARKET, BY TECHNOLOGY,  2021–2028 (USD MILLION)
           8.3.2 GERMANY
                    8.3.2.1 Germany to dominate laboratory proficiency testing market in Europe during forecast period
                                TABLE 129 GERMANY: MARKET, BY INDUSTRY, 2021–2028 (USD MILLION)
                                TABLE 130 GERMANY: MARKET FOR CLINICAL DIAGNOSTICS INDUSTRY, BY TYPE, 2021–2028 (USD MILLION)
                                TABLE 131 GERMANY: MARKET FOR MICROBIOLOGY INDUSTRY, BY TYPE, 2021–2028 (USD MILLION)
                                TABLE 132 GERMANY: MARKET FOR PHARMACEUTICAL INDUSTRY, BY TYPE, 2021–2028 (USD MILLION)
                                TABLE 133 GERMANY: MARKET FOR BIOLOGICS INDUSTRY,  BY TYPE, 2021–2028 (USD MILLION)
                                TABLE 134 GERMANY: MARKET FOR COSMETIC INDUSTRY,  BY TYPE, 2021–2028 (USD MILLION)
                                TABLE 135 GERMANY: MARKET FOR CANNABIS/OPIOIDS INDUSTRY, BY TYPE, 2021–2028 (USD MILLION)
                                TABLE 136 GERMANY: MARKET FOR FOOD & ANIMAL FEED INDUSTRY, BY TYPE, 2021–2028 (USD MILLION)
                                TABLE 137 GERMANY: MARKET FOR COMMERCIAL BEVERAGES INDUSTRY, BY TYPE, 2021–2028 (USD MILLION)
                                TABLE 138 GERMANY: LABORATORY PROFICIENCY TESTING INDUSTRY, BY TECHNOLOGY,  2021–2028 (USD MILLION)
           8.3.3 FRANCE
                    8.3.3.1 France to become most attractive destination for FDI projects in Europe
                                TABLE 139 FRANCE: LABORATORY PROFICIENCY TESTING MARKET, BY INDUSTRY,  2021–2028 (USD MILLION)
                                TABLE 140 FRANCE: MARKET FOR CLINICAL DIAGNOSTICS INDUSTRY, BY TYPE, 2021–2028 (USD MILLION)
                                TABLE 141 FRANCE: MARKET FOR MICROBIOLOGY INDUSTRY, BY TYPE, 2021–2028 (USD MILLION)
                                TABLE 142 FRANCE: MARKET FOR PHARMACEUTICAL INDUSTRY, BY TYPE, 2021–2028 (USD MILLION)
                                TABLE 143 FRANCE: MARKET FOR BIOLOGICS INDUSTRY,  BY TYPE, 2021–2028 (USD MILLION)
                                TABLE 144 FRANCE: MARKET FOR COSMETIC INDUSTRY,  BY TYPE, 2021–2028 (USD MILLION)
                                TABLE 145 FRANCE: MARKET FOR CANNABIS/OPIOIDS INDUSTRY, BY TYPE, 2021–2028 (USD MILLION)
                                TABLE 146 FRANCE: MARKET FOR FOOD & ANIMAL FEED INDUSTRY, BY TYPE, 2021–2028 (USD MILLION)
                                TABLE 147 FRANCE: MARKET FOR COMMERCIAL BEVERAGES INDUSTRY, BY TYPE, 2021–2028 (USD MILLION)
                                TABLE 148 FRANCE: MARKET, BY TECHNOLOGY,  2021–2028 (USD MILLION)
           8.3.4 UK
                    8.3.4.1 Increased government funding for biopharmaceutical research to support growth
                                TABLE 149 UK: LABORATORY PROFICIENCY TESTING MARKET, BY INDUSTRY,  2021–2028 (USD MILLION)
                                TABLE 150 UK: MARKET FOR CLINICAL DIAGNOSTICS INDUSTRY, BY TYPE, 2021–2028 (USD MILLION)
                                TABLE 151 UK: MARKET FOR MICROBIOLOGY INDUSTRY,  BY TYPE, 2021–2028 (USD MILLION)
                                TABLE 152 UK: MARKET FOR PHARMACEUTICAL INDUSTRY,  BY TYPE, 2021–2028 (USD MILLION)
                                TABLE 153 UK: MARKET FOR BIOLOGICS INDUSTRY, BY TYPE,  2021–2028 (USD MILLION)
                                TABLE 154 UK: MARKET FOR COSMETIC INDUSTRY, BY TYPE,  2021–2028 (USD MILLION)
                                TABLE 155 UK: MARKET FOR CANNABIS/OPIOIDS INDUSTRY, BY TYPE, 2021–2028 (USD MILLION)
                                TABLE 156 UK: MARKET FOR FOOD & ANIMAL FEED INDUSTRY, BY TYPE, 2021–2028 (USD MILLION)
                                TABLE 157 UK: MARKET FOR COMMERCIAL BEVERAGES INDUSTRY, BY TYPE, 2021–2028 (USD MILLION)
                                TABLE 158 UK: LABORATORY PROFICIENCY TESTING INDUSTRY, BY TECHNOLOGY,  2021–2028 (USD MILLION)
           8.3.5 ITALY
                    8.3.5.1 Increasing number of clinical trials to drive market growth
                                TABLE 159 ITALY: LABORATORY PROFICIENCY TESTING MARKET, BY INDUSTRY,  2021–2028 (USD MILLION)
                                TABLE 160 ITALY: MARKET FOR PHARMACEUTICAL INDUSTRY, BY TYPE, 2021–2028 (USD MILLION)
                                TABLE 161 ITALY: MARKET FOR CLINICAL DIAGNOSTICS INDUSTRY, BY TYPE, 2021–2028 (USD MILLION)
                                TABLE 162 ITALY: MARKET FOR MICROBIOLOGY INDUSTRY,  BY TYPE, 2021–2028 (USD MILLION)
                                TABLE 163 ITALY: MARKET FOR BIOLOGICS INDUSTRY, BY TYPE,  2021–2028 (USD MILLION)
                                TABLE 164 ITALY: MARKET FOR COSMETIC INDUSTRY, BY TYPE,  2021–2028 (USD MILLION)
                                TABLE 165 ITALY: MARKET FOR CANNABIS/OPIOIDS INDUSTRY, BY TYPE, 2021–2028 (USD MILLION)
                                TABLE 166 ITALY: MARKET FOR FOOD & ANIMAL FEED INDUSTRY, BY TYPE, 2021–2028 (USD MILLION)
                                TABLE 167 ITALY: MARKET FOR COMMERCIAL BEVERAGES INDUSTRY, BY TYPE, 2021–2028 (USD MILLION)
                                TABLE 168 ITALY: MARKET, BY TECHNOLOGY,  2021–2028 (USD MILLION)
           8.3.6 SPAIN
                    8.3.6.1 Growth in biologics industry and rising consumption of biosimilars to boost market
                                TABLE 169 SPAIN: LABORATORY PROFICIENCY TESTING MARKET, BY INDUSTRY,  2021–2028 (USD MILLION)
                                TABLE 170 SPAIN: MARKET FOR CLINICAL DIAGNOSTICS INDUSTRY, BY TYPE, 2021–2028 (USD MILLION)
                                TABLE 171 SPAIN: MARKET FOR MICROBIOLOGY INDUSTRY, BY TYPE, 2021–2028 (USD MILLION)
                                TABLE 172 SPAIN: MARKET FOR PHARMACEUTICAL INDUSTRY, BY TYPE, 2021–2028 (USD MILLION)
                                TABLE 173 SPAIN: MARKET FOR BIOLOGICS INDUSTRY,  BY TYPE, 2021–2028 (USD MILLION)
                                TABLE 174 SPAIN: MARKET FOR COSMETIC INDUSTRY, BY TYPE,  2021–2028 (USD MILLION)
                                TABLE 175 SPAIN: MARKET FOR CANNABIS/OPIOIDS INDUSTRY, BY TYPE, 2021–2028 (USD MILLION)
                                TABLE 176 SPAIN: MARKET FOR FOOD & ANIMAL FEED INDUSTRY, BY TYPE, 2021–2028 (USD MILLION)
                                TABLE 177 SPAIN: MARKET FOR COMMERCIAL BEVERAGES INDUSTRY, BY TYPE, 2021–2028 (USD MILLION)
                                TABLE 178 SPAIN: MARKET, BY TECHNOLOGY,  2021–2028 (USD MILLION)
           8.3.7 RUSSIA
                    8.3.7.1 Growth in pharmaceutical and water testing industries to favor market growth
                                TABLE 179 RUSSIA: LABORATORY PROFICIENCY TESTING MARKET, BY INDUSTRY,  2021–2028 (USD MILLION)
                                TABLE 180 RUSSIA: MARKET FOR CLINICAL DIAGNOSTICS INDUSTRY, BY TYPE, 2021–2028 (USD MILLION)
                                TABLE 181 RUSSIA: MARKET FOR MICROBIOLOGY INDUSTRY, BY TYPE, 2021–2028 (USD MILLION)
                                TABLE 182 RUSSIA: MARKET FOR PHARMACEUTICAL INDUSTRY, BY TYPE, 2021–2028 (USD MILLION)
                                TABLE 183 RUSSIA: MARKET FOR BIOLOGICS INDUSTRY, BY TYPE, 2021–2028 (USD MILLION)
                                TABLE 184 RUSSIA: MARKET FOR COSMETIC INDUSTRY, BY TYPE, 2021–2028 (USD MILLION)
                                TABLE 185 RUSSIA: MARKET FOR CANNABIS/OPIOIDS INDUSTRY, BY TYPE, 2021–2028 (USD MILLION)
                                TABLE 186 RUSSIA: MARKET FOR FOOD & ANIMAL FEED INDUSTRY, BY TYPE, 2021–2028 (USD MILLION)
                                TABLE 187 RUSSIA: MARKET FOR COMMERCIAL BEVERAGES INDUSTRY, BY TYPE, 2021–2028 (USD MILLION)
                                TABLE 188 RUSSIA: LABORATORY PROFICIENCY TESTING INDUSTRY, BY TECHNOLOGY,  2021–2028 (USD MILLION)
           8.3.8 REST OF EUROPE
                    TABLE 189 REST OF EUROPE: LABORATORY PROFICIENCY TESTING MARKET, BY INDUSTRY,  2021–2028 (USD MILLION)
                    TABLE 190 REST OF EUROPE: MARKET FOR CLINICAL DIAGNOSTICS INDUSTRY, BY TYPE, 2021–2028 (USD MILLION)
                    TABLE 191 REST OF EUROPE: MARKET FOR MICROBIOLOGY INDUSTRY, BY TYPE, 2021–2028 (USD MILLION)
                    TABLE 192 REST OF EUROPE: MARKET FOR PHARMACEUTICAL INDUSTRY, BY TYPE, 2021–2028 (USD MILLION)
                    TABLE 193 REST OF EUROPE: MARKET FOR BIOLOGICS INDUSTRY, BY TYPE, 2021–2028 (USD MILLION)
                    TABLE 194 REST OF EUROPE: MARKET FOR COSMETIC INDUSTRY, BY TYPE, 2021–2028 (USD MILLION)
                    TABLE 195 REST OF EUROPE: MARKET FOR CANNABIS/OPIOIDS INDUSTRY, BY TYPE, 2021–2028 (USD MILLION)
                    TABLE 196 REST OF EUROPE: MARKET FOR FOOD & ANIMAL FEED INDUSTRY, BY TYPE, 2021–2028 (USD MILLION)
                    TABLE 197 REST OF EUROPE: MARKET FOR COMMERCIAL BEVERAGES INDUSTRY, BY TYPE, 2021–2028 (USD MILLION)
                    TABLE 198 REST OF EUROPE: MARKET, BY TECHNOLOGY,  2021–2028 (USD MILLION)
    8.4 ASIA PACIFIC 
           8.4.1 ASIA PACIFIC: RECESSION IMPACT
                    FIGURE 40 ASIA PACIFIC: LABORATORY PROFICIENCY TESTING MARKET SNAPSHOT
                    TABLE 199 ASIA PACIFIC: MARKET, BY COUNTRY,  2021–2028 (USD MILLION)
                    TABLE 200 ASIA PACIFIC: MARKET, BY INDUSTRY,  2021–2028 (USD MILLION)
                    TABLE 201 ASIA PACIFIC: MARKET FOR CLINICAL DIAGNOSTICS INDUSTRY, BY TYPE, 2021–2028 (USD MILLION)
                    TABLE 202 ASIA PACIFIC: MARKET FOR MICROBIOLOGY INDUSTRY, BY TYPE, 2021–2028 (USD MILLION)
                    TABLE 203 ASIA PACIFIC: MARKET FOR COMMERCIAL BEVERAGES INDUSTRY, BY TYPE, 2021–2028 (USD MILLION)
                    TABLE 204 ASIA PACIFIC: MARKET FOR PHARMACEUTICAL INDUSTRY, BY TYPE, 2021–2028 (USD MILLION)
                    TABLE 205 ASIA PACIFIC: MARKET FOR BIOLOGICS INDUSTRY, BY TYPE, 2021–2028 (USD MILLION)
                    TABLE 206 ASIA PACIFIC: MARKET FOR FOOD & ANIMAL FEED INDUSTRY, BY TYPE, 2021–2028 (USD MILLION)
                    TABLE 207 ASIA PACIFIC: MARKET FOR COSMETIC INDUSTRY, BY TYPE, 2021–2028 (USD MILLION)
                    TABLE 208 ASIA PACIFIC: MARKET FOR CANNABIS/OPIOIDS INDUSTRY, BY TYPE, 2021–2028 (USD MILLION)
                    TABLE 209 ASIA PACIFIC: MARKET, BY TECHNOLOGY,  2021–2028 (USD MILLION)
           8.4.2 JAPAN
                    8.4.2.1 Japan to dominate APAC laboratory proficiency testing market during forecast period
                                TABLE 210 JAPAN: MARKET, BY INDUSTRY,  2021–2028 (USD MILLION)
                                TABLE 211 JAPAN: MARKET FOR CLINICAL DIAGNOSTICS INDUSTRY, BY TYPE, 2021–2028 (USD MILLION)
                                TABLE 212 JAPAN: MARKET FOR MICROBIOLOGY INDUSTRY,  BY TYPE, 2021–2028 (USD MILLION)
                                TABLE 213 JAPAN: MARKET FOR FOOD & ANIMAL FEED INDUSTRY, BY TYPE, 2021–2028 (USD MILLION)
                                TABLE 214 JAPAN: MARKET FOR COMMERCIAL BEVERAGES INDUSTRY, BY TYPE, 2021–2028 (USD MILLION)
                                TABLE 215 JAPAN: MARKET FOR PHARMACEUTICAL INDUSTRY, BY TYPE, 2021–2028 (USD MILLION)
                                TABLE 216 JAPAN: MARKET FOR BIOLOGICS INDUSTRY,  BY TYPE, 2021–2028 (USD MILLION)
                                TABLE 217 JAPAN: MARKET FOR COSMETIC INDUSTRY, BY TYPE,  2021–2028 (USD MILLION)
                                TABLE 218 JAPAN: MARKET FOR CANNABIS/OPIOIDS INDUSTRY, BY TYPE, 2021–2028 (USD MILLION)
                                TABLE 219 JAPAN: LABORATORY PROFICIENCY TESTING INDUSTRY, BY TECHNOLOGY,  2021–2028 (USD MILLION)
           8.4.3 CHINA
                    8.4.3.1 Growth of pharmaceutical and biologics testing to drive market
                                TABLE 220 CHINA: LABORATORY PROFICIENCY TESTING MARKET, BY INDUSTRY,  2021–2028 (USD MILLION)
                                TABLE 221 CHINA: MARKET FOR CLINICAL DIAGNOSTICS INDUSTRY, BY TYPE, 2021–2028 (USD MILLION)
                                TABLE 222 CHINA: MARKET FOR MICROBIOLOGY INDUSTRY,  BY TYPE, 2021–2028 (USD MILLION)
                                TABLE 223 CHINA: MARKET FOR FOOD & ANIMAL FEED INDUSTRY, BY TYPE, 2021–2028 (USD MILLION)
                                TABLE 224 CHINA: MARKET FOR COMMERCIAL BEVERAGES INDUSTRY, BY TYPE, 2021–2028 (USD MILLION)
                                TABLE 225 CHINA: MARKET FOR PHARMACEUTICAL INDUSTRY, BY TYPE, 2021–2028 (USD MILLION)
                                TABLE 226 CHINA: MARKET FOR BIOLOGICS INDUSTRY,  BY TYPE, 2021–2028 (USD MILLION)
                                TABLE 227 CHINA: MARKET FOR COSMETIC INDUSTRY, BY TYPE,  2021–2028 (USD MILLION)
                                TABLE 228 CHINA: MARKET FOR CANNABIS/OPIOIDS INDUSTRY, BY TYPE, 2021–2028 (USD MILLION)
                                TABLE 229 CHINA: MARKET, BY TECHNOLOGY,  2021–2028 (USD MILLION)
           8.4.4 INDIA
                    8.4.4.1 Increasing government support for biotechnology R&D to support market growth
                                TABLE 230 INDIA: LABORATORY PROFICIENCY TESTING MARKET, BY INDUSTRY,  2021–2028 (USD MILLION)
                                TABLE 231 INDIA: MARKET FOR CLINICAL DIAGNOSTICS INDUSTRY, BY TYPE, 2021–2028 (USD MILLION)
                                TABLE 232 INDIA: MARKET FOR MICROBIOLOGY INDUSTRY,  BY TYPE, 2021–2028 (USD MILLION)
                                TABLE 233 INDIA: MARKET FOR FOOD & ANIMAL FEED INDUSTRY, BY TYPE, 2021–2028 (USD MILLION)
                                TABLE 234 INDIA: MARKET FOR COMMERCIAL BEVERAGES INDUSTRY, BY TYPE, 2021–2028 (USD MILLION)
                                TABLE 235 INDIA: MARKET FOR PHARMACEUTICAL INDUSTRY, BY TYPE, 2021–2028 (USD MILLION)
                                TABLE 236 INDIA: MARKET FOR BIOLOGICS INDUSTRY, BY TYPE,  2021–2028 (USD MILLION)
                                TABLE 237 INDIA: MARKET FOR COSMETIC INDUSTRY, BY TYPE,  2021–2028 (USD MILLION)
                                TABLE 238 INDIA: MARKET FOR CANNABIS/OPIOIDS INDUSTRY, BY TYPE, 2021–2028 (USD MILLION)
                                TABLE 239 INDIA: MARKET, BY TECHNOLOGY,  2021–2028 (USD MILLION)
           8.4.5 SOUTH KOREA
                    8.4.5.1 Investments in biopharmaceutical research to propel market
                                TABLE 240 SOUTH KOREA: LABORATORY PROFICIENCY TESTING MARKET, BY INDUSTRY,  2021–2028 (USD MILLION)
                                TABLE 241 SOUTH KOREA: MARKET FOR CLINICAL DIAGNOSTICS INDUSTRY, BY TYPE, 2021–2028 (USD MILLION)
                                TABLE 242 SOUTH KOREA: MARKET FOR MICROBIOLOGY INDUSTRY, BY TYPE, 2021–2028 (USD MILLION)
                                TABLE 243 SOUTH KOREA: MARKET FOR FOOD & ANIMAL FEED INDUSTRY, BY TYPE, 2021–2028 (USD MILLION)
                                TABLE 244 SOUTH KOREA: MARKET FOR COMMERCIAL BEVERAGES INDUSTRY, BY TYPE, 2021–2028 (USD MILLION)
                                TABLE 245 SOUTH KOREA: MARKET FOR PHARMACEUTICAL INDUSTRY, BY TYPE, 2021–2028 (USD MILLION)
                                TABLE 246 SOUTH KOREA: MARKET FOR BIOLOGICS INDUSTRY, BY TYPE, 2021–2028 (USD MILLION)
                                TABLE 247 SOUTH KOREA: MARKET FOR COSMETIC INDUSTRY, BY TYPE, 2021–2028 (USD MILLION)
                                TABLE 248 SOUTH KOREA: MARKET FOR CANNABIS/OPIOIDS INDUSTRY, BY TYPE, 2021–2028 (USD MILLION)
                                TABLE 249 SOUTH KOREA: LABORATORY PROFICIENCY TESTING INDUSTRY, BY TECHNOLOGY,  2021–2028 (USD MILLION)
           8.4.6 REST OF ASIA PACIFIC
                    TABLE 250 REST OF ASIA PACIFIC: LABORATORY PROFICIENCY TESTING MARKET, BY INDUSTRY,  2021–2028 (USD MILLION)
                    TABLE 251 REST OF ASIA PACIFIC: MARKET FOR CLINICAL DIAGNOSTICS INDUSTRY, BY TYPE, 2021–2028 (USD MILLION)
                    TABLE 252 REST OF ASIA PACIFIC: MARKET FOR MICROBIOLOGY INDUSTRY, BY TYPE, 2021–2028 (USD MILLION)
                    TABLE 253 REST OF ASIA PACIFIC: MARKET FOR FOOD & ANIMAL FEED INDUSTRY, BY TYPE, 2021–2028 (USD MILLION)
                    TABLE 254 REST OF ASIA PACIFIC: MARKET FOR COMMERCIAL BEVERAGES INDUSTRY, BY TYPE, 2021–2028 (USD MILLION)
                    TABLE 255 REST OF ASIA PACIFIC: MARKET FOR PHARMACEUTICAL INDUSTRY, BY TYPE, 2021–2028 (USD MILLION)
                    TABLE 256 REST OF ASIA PACIFIC: MARKET FOR BIOLOGICS INDUSTRY, BY TYPE, 2021–2028 (USD MILLION)
                    TABLE 257 REST OF ASIA PACIFIC: MARKET FOR COSMETIC INDUSTRY, BY TYPE, 2021–2028 (USD MILLION)
                    TABLE 258 REST OF ASIA PACIFIC: MARKET FOR CANNABIS/OPIOIDS INDUSTRY, BY TYPE, 2021–2028 (USD MILLION)
                    TABLE 259 REST OF ASIA PACIFIC: MARKET, BY TECHNOLOGY, 2021–2028 (USD MILLION)
    8.5 LATIN AMERICA 
           8.5.1 FINANCIAL AND ECONOMIC LIMITATIONS IN LATIN AMERICAN COUNTRIES TO LIMIT MARKET GROWTH
           8.5.2 LATIN AMERICA: RECESSION IMPACT
                    TABLE 260 LATIN AMERICA: LABORATORY PROFICIENCY TESTING MARKET, BY INDUSTRY,  2021–2028 (USD MILLION)
                    TABLE 261 LATIN AMERICA: MARKET FOR CLINICAL DIAGNOSTICS INDUSTRY, BY TYPE, 2021–2028 (USD MILLION)
                    TABLE 262 LATIN AMERICA: MARKET FOR MICROBIOLOGY INDUSTRY, BY TYPE, 2021–2028 (USD MILLION)
                    TABLE 263 LATIN AMERICA: MARKET FOR FOOD & ANIMAL FEED INDUSTRY, BY TYPE, 2021–2028 (USD MILLION)
                    TABLE 264 LATIN AMERICA: MARKET FOR COMMERCIAL BEVERAGES INDUSTRY, BY TYPE, 2021–2028 (USD MILLION)
                    TABLE 265 LATIN AMERICA: MARKET FOR PHARMACEUTICAL INDUSTRY, BY TYPE, 2021–2028 (USD MILLION)
                    TABLE 266 LATIN AMERICA: MARKET FOR BIOLOGICS INDUSTRY, BY TYPE, 2021–2028 (USD MILLION)
                    TABLE 267 LATIN AMERICA: MARKET FOR COSMETIC INDUSTRY, BY TYPE, 2021–2028 (USD MILLION)
                    TABLE 268 LATIN AMERICA: MARKET FOR CANNABIS/OPIOIDS INDUSTRY, BY TYPE, 2021–2028 (USD MILLION)
                    TABLE 269 LATIN AMERICA: MARKET, BY TECHNOLOGY,  2021–2028 (USD MILLION)
    8.6 MIDDLE EAST & AFRICA 
           8.6.1 GROWING AWARENESS OF HEALTHCARE AND ANALYTICAL TESTING TO SUPPORT MARKET GROWTH
                    TABLE 270 FOOD SAFETY LEGISLATION IN AFRICAN COUNTRIES
           8.6.2 MIDDLE EAST & AFRICA: RECESSION IMPACT
                    TABLE 271 MIDDLE EAST & AFRICA: LABORATORY PROFICIENCY TESTING MARKET, BY INDUSTRY,  2021–2028 (USD MILLION)
                    TABLE 272 MIDDLE EAST & AFRICA: MARKET FOR CLINICAL DIAGNOSTICS INDUSTRY, BY TYPE, 2021–2028 (USD MILLION)
                    TABLE 273 MIDDLE EAST & AFRICA: MARKET FOR MICROBIOLOGY INDUSTRY, BY TYPE, 2021–2028 (USD MILLION)
                    TABLE 274 MIDDLE EAST & AFRICA: MARKET FOR FOOD & ANIMAL FEED INDUSTRY, BY TYPE, 2021–2028 (USD MILLION)
                    TABLE 275 MIDDLE EAST & AFRICA: MARKET FOR COMMERCIAL BEVERAGES INDUSTRY, BY TYPE, 2021–2028 (USD MILLION)
                    TABLE 276 MIDDLE EAST & AFRICA: MARKET FOR PHARMACEUTICAL INDUSTRY, BY TYPE, 2021–2028 (USD MILLION)
                    TABLE 277 MIDDLE EAST & AFRICA: MARKET FOR BIOLOGICS INDUSTRY, BY TYPE, 2021–2028 (USD MILLION)
                    TABLE 278 MIDDLE EAST & AFRICA: MARKET FOR COSMETIC INDUSTRY, BY TYPE, 2021–2028 (USD MILLION)
                    TABLE 279 MIDDLE EAST & AFRICA: MARKET FOR CANNABIS/OPIOIDS INDUSTRY, BY TYPE, 2021–2028 (USD MILLION)
                    TABLE 280 MIDDLE EAST & AFRICA: LABORATORY PROFICIENCY TESTING INDUSTRY, BY TECHNOLOGY, 2021–2028 (USD MILLION)
 
9 COMPETITIVE LANDSCAPE (Page No. - 302)
    9.1 OVERVIEW 
    9.2 STRATEGIES ADOPTED BY KEY PLAYERS 
          FIGURE 41 KEY DEVELOPMENTS BY LEADING PLAYERS IN LABORATORY PROFICIENCY TESTING MARKET, 2020–2023
    9.3 RIGHT TO WIN 
    9.4 REVENUE SHARE ANALYSIS 
    9.5 MARKET RANKING ANALYSIS 
          FIGURE 43 RANK OF COMPANIES IN GLOBAL LABORATORY PROFICIENCY TESTING INDUSTRY (2022)
    9.6 COMPANY EVALUATION MATRIX 
           9.6.1 STARS
           9.6.2 EMERGING LEADERS
           9.6.3 PERVASIVE PLAYERS
           9.6.4 PARTICIPANTS
                    FIGURE 44 LABORATORY PROFICIENCY TESTING INDUSTRY: COMPANY EVALUATION QUADRANT FOR KEY PLAYERS (2022)
           9.6.5 COMPANY FOOTPRINT
                    TABLE 281 COMPANY FOOTPRINT: LABORATORY PROFICIENCY TESTING INDUSTRY (2022)
                    9.6.5.1 Company industry footprint
                                TABLE 282 INDUSTRY FOOTPRINT: LABORATORY PROFICIENCY TESTING INDUSTRY (2022)
                    9.6.5.2 Company regional footprint
                                TABLE 283 REGIONAL FOOTPRINT: LABORATORY PROFICIENCY TESTING INDUSTRY (2022)
    9.7 START-UPS/SMES EVALUATION MATRIX 
           9.7.1 PROGRESSIVE COMPANIES
           9.7.2 STARTING BLOCKS
           9.7.3 RESPONSIVE COMPANIES
           9.7.4 DYNAMIC COMPANIES
                    FIGURE 45 LABORATORY PROFICIENCY TESTING INDUSTRY: COMPANY EVALUATION QUADRANT FOR START-UPS/SMES (2022)
           9.7.5 COMPETITIVE BENCHMARKING
                    TABLE 284 START-UP/SME FOOTPRINT: LABORATORY PROFICIENCY TESTING INDUSTRY (2022)
                    9.7.5.1 Company industry footprint
                                TABLE 285 START-UP/SME INDUSTRY FOOTPRINT: LABORATORY PROFICIENCY TESTING INDUSTRY (2022)
                    9.7.5.2 Company regional footprint
                                TABLE 286 START-UP/SME REGIONAL FOOTPRINT: LABORATORY PROFICIENCY TESTING INDUSTRY (2022)
    9.8 COMPETITIVE SITUATION AND TRENDS 
           9.8.1 MARKET: PRODUCT LAUNCHES
                    TABLE 287 KEY PRODUCT LAUNCHES, JANUARY 2020–AUGUST 2023
           9.8.2 MARKET: DEALS
                    TABLE 288 KEY DEALS, JANUARY 2020–AUGUST 2023
           9.8.3 MARKET: OTHER DEVELOPMENTS
                    TABLE 289 OTHER KEY DEVELOPMENTS, JANUARY 2020–AUGUST 2023
 
10 COMPANY PROFILES (Page No. - 319)
     10.1 KEY PLAYERS 
(Business Overview, Products Offered, Recent Developments, and MnM View (Key strengths/Right to Win, Strategic Choices Made, and Weaknesses and Competitive Threats))*
             10.1.1 LGC LIMITED
                        TABLE 290 LGC LIMITED: BUSINESS OVERVIEW
                        FIGURE 46 LGC LIMITED: COMPANY SNAPSHOT (2022)
             10.1.2 COLLEGE OF AMERICAN PATHOLOGISTS
                        TABLE 291 COLLEGE OF AMERICAN PATHOLOGISTS: BUSINESS OVERVIEW
                        FIGURE 47 COLLEGE OF AMERICAN PATHOLOGISTS: COMPANY SNAPSHOT (2022)
             10.1.3 BIO-RAD LABORATORIES, INC.
                        TABLE 292 BIO-RAD LABORATORIES, INC.: BUSINESS OVERVIEW
                        FIGURE 48 BIO-RAD LABORATORIES, INC.: COMPANY SNAPSHOT (2022)
             10.1.4 MERCK KGAA
                        TABLE 293 MERCK KGAA: BUSINESS OVERVIEW
                        FIGURE 49 MERCK KGAA: COMPANY SNAPSHOT (2022)
             10.1.5 AMERICAN PROFICIENCY INSTITUTE
                        TABLE 294 AMERICAN PROFICIENCY INSTITUTE: BUSINESS OVERVIEW
             10.1.6 RANDOX LABORATORIES LTD.
                        TABLE 295 RANDOX LABORATORIES LTD.: BUSINESS OVERVIEW
             10.1.7 FAPAS (A DIVISION OF FERA SCIENCE LTD.)
                        TABLE 296 FAPAS: BUSINESS OVERVIEW
             10.1.8 WATERS CORPORATION
                        TABLE 297 WATERS CORPORATION: BUSINESS OVERVIEW
                        FIGURE 50 WATERS CORPORATION: COMPANY SNAPSHOT (2022)
             10.1.9 QACS
                        TABLE 298 QACS: BUSINESS OVERVIEW
             10.1.10 WEQAS
                        TABLE 299 WEQAS: BUSINESS OVERVIEW
             10.1.11 AOAC INTERNATIONAL
                        TABLE 300 AOAC INTERNATIONAL: BUSINESS OVERVIEW
             10.1.12 BIPEA
                        TABLE 301 BIPEA: BUSINESS OVERVIEW
             10.1.13 SPEX CERTIPREP
                        TABLE 302 SPEX CERTIPREP: BUSINESS OVERVIEW
             10.1.14 ABSOLUTE STANDARDS INC.
                        TABLE 303 ABSOLUTE STANDARDS INC.: BUSINESS OVERVIEW
             10.1.15 TRILOGY ANALYTICAL LABORATORY
                        TABLE 304 TRILOGY ANALYTICAL LABORATORY: BUSINESS OVERVIEW
             10.1.16 ADVANCED ANALYTICAL SOLUTIONS
                        TABLE 305 ADVANCED ANALYTICAL SOLUTIONS: BUSINESS OVERVIEW
             10.1.17 AMERICAN INDUSTRIAL HYGIENE ASSOCIATION
                        TABLE 306 AMERICAN INDUSTRIAL HYGIENE ASSOCIATION: BUSINESS OVERVIEW
             10.1.18 MATRIX SCIENCES
                        TABLE 307 MATRIX SCIENCES: BUSINESS OVERVIEW
             10.1.19 AASHVI PROFICIENCY TESTING & ANALYTICAL SERVICES
                        TABLE 308 AASHVI PROFICIENCY TESTING & ANALYTICAL SERVICES: BUSINESS OVERVIEW
             10.1.20 GLOBAL PROFICIENCY LTD.
                        TABLE 309 GLOBAL PROFICIENCY LTD.: BUSINESS OVERVIEW
             10.1.21 THE EMERALD TEST
                        TABLE 310 THE EMERALD TEST: BUSINESS OVERVIEW
     10.2 OTHER PLAYERS 
             10.2.1 FLUXANA GMBH & CO. KG
             10.2.2 PHENOVA INC.
             10.2.3 FARE LABS
             10.2.4 GO PLUS SERVICES SDN BHD.
             10.2.5 MUVA KEMPTEN GMBH
 
*Details on Business Overview, Products Offered, Recent Developments, and MnM View (Key strengths/Right to Win, Strategic Choices Made, and Weaknesses and Competitive Threats) might not be captured in case of unlisted companies.
 
11 APPENDIX (Page No. - 391)
     11.1 DISCUSSION GUIDE 
     11.2 KNOWLEDGESTORE: MARKETSANDMARKETS’  SUBSCRIPTION PORTAL 
     11.3 CUSTOMIZATION OPTIONS 
     11.4 RELATED REPORT 
     11.5 AUTHOR DETAILS 

This research study involved the extensive use of secondary sources, directories, and databases to identify and collect information useful to the study on the laboratory proficiency testing market. Primary sources were largely several industry experts from core and related industries and preferred suppliers, laboratory proficiency testing service providers, hospitals and clinical diagnostic laboratories, specialty laboratories, distributors, contract research organizations, academic & research institutes,  and technology developers. Primary sources also included standard and certification organizations from companies and organizations related to all segments of this industry’s value chain.

Secondary Research

In the secondary research process, various sources such as D&B, Bloomberg Business, and Factiva; white papers; annual reports; and companies’ house documents were referred to, to identify and collect information useful for a technical, market-oriented, and commercial study of the laboratory proficiency testing market. These secondary sources include  Clinical and Laboratory Standards Institute (CLSI), Clinical Laboratory Improvement Amendments (CLIA), National Accreditation Board for Testing and Calibration Laboratories (NABL), National Association for Proficiency Testing (NAPT), International Organization for Standardization (ISO), World Health Organization (WHO), Quality Council of India (QCI), and College of American Pathologists (CAP). Secondary research was mainly used to obtain key information about the industry’s supply chain, the total pool of key players, market classification, and segmentation according to industry trends to the bottom-most level and regional markets. It was also used to obtain information about the key developments from a market-oriented perspective.

Primary Research

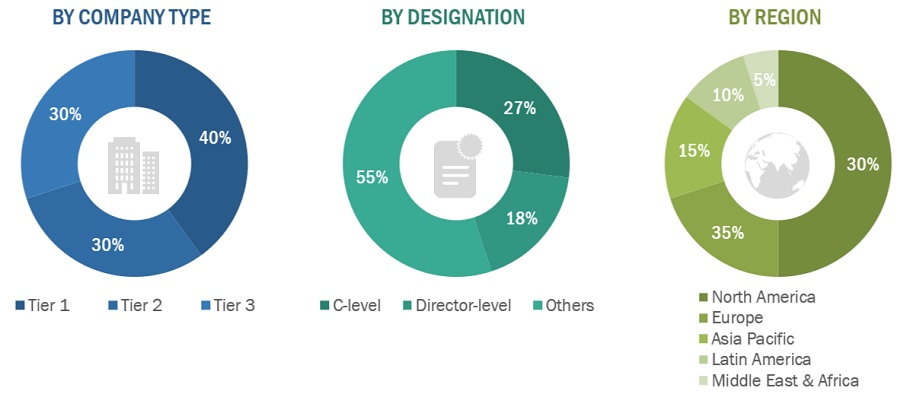
The laboratory proficiency testing market comprises several stakeholders such as laboratory proficiency testing service providers, end-users such as hospitals and clinical diagnostic laboratories and regulatory organizations in the supply chain. Various primary sources from both the supply and demand sides of the market were interviewed to obtain qualitative and quantitative information. The primary interviewees from the demand side include key opinion leaders in the hospitals and clinical laboratories, food testing laboratories, analytical laboratories, water, environmental testing laboratories, and cannabis testing laboratories, among others. The primary sources from the supply side include CEOs, vice presidents, marketing and sales directors, technology and innovation directors, and related key executives from various key companies operating in the laboratory proficiency testing market. Various primary sources from both the supply and demand sides of the market were interviewed to obtain qualitative and quantitative information. Given below is the breakdown of primary respondents:
Laboratory Proficiency Testing Market Size, and Share

Note 1: C-level primaries include CEOs, COOs, CTOs, and VPs.

Note 2: Other primaries include sales managers, marketing managers, and product managers.

Note 3: Companies are classified into tiers based on their total revenue. As of 2021: Tier 1 = >USD 1 billion, Tier 2 = USD 500 million to USD 1 billion, and Tier 3 = <USD 500 million.

To know about the assumptions considered for the study, download the pdf brochure

COMPANY NAME

DESIGNATION

Merck

Head of Field Sales Advanced Analytical

Cardinal Foods, LLC

QA Manager

Global Proficiency Testing Ltd.

Project Manager

Market Size Estimation

Both top-down and bottom-up approaches have been used to estimate and validate the size of the laboratory proficiency testing market and to estimate the size of various other dependent submarkets in the overall laboratory proficiency testing market.

The research methodology used to estimate the market size includes the following details:

  • The market value of laboratory proficiency testing for clinical diagnostics, food and animal feed, microbiology, environmental, commercial beverages, pharmaceuticals, water, nutraceuticals, biologics, cannabis, dietary supplements, and cosmetics have been extracted from the repository and validated through secondary and primary research.
  • The market shares of the polymerase chain reaction (PCR), cell culture, immunoassay, chromatography, spectroscopy, and other technologies have been extracted from the repository and validated through secondary and primary research.
  • This entire procedure includes the study of the annual and financial reports of the top market players and extensive interviews for key insights from industry leaders such as CEOs, VPs, directors, and marketing executives.
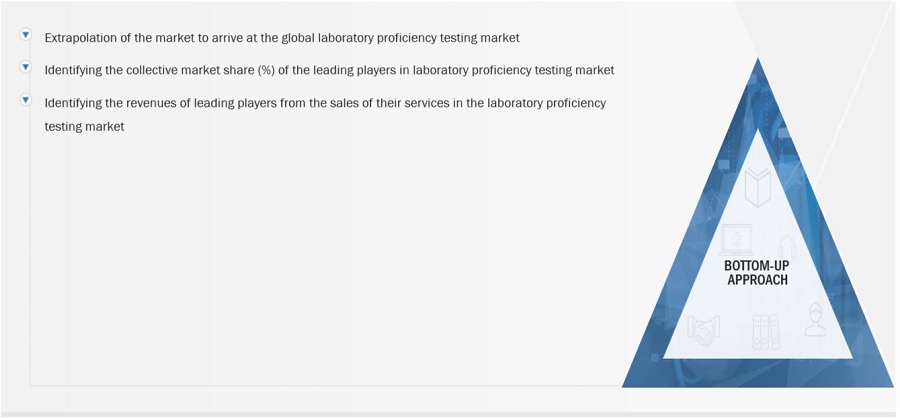
  • The bottom-up approach has been applied to different regions and other segments of the laboratory proficiency testing market. All percentage shares, splits, and breakdowns have been determined by using secondary sources and verified through primary sources.
  • All possible parameters that affect the markets covered in this research study have been accounted for, viewed in extensive detail, verified through primary research, and analyzed to get the final quantitative and qualitative data. 
  • This data is consolidated and added with detailed inputs and analysis from MarketsandMarkets and presented in this report.

Approach to calculating the revenue of different players in the Laboratory Proficiency Testing market.

In this report, the global laboratory proficiency testing market size was arrived at by using the revenue share analysis of leading players. For this purpose, major players in the market were identified, and their revenues from the laboratory proficiency testing business were determined through various insights gathered during the primary and secondary research phases. Secondary research included the study of the annual and financial reports of the top market players. In contrast, primary research included extensive interviews with key opinion leaders, such as CEOs, directors, and key market players’ marketing executives.

Approach to derive the market size and estimate market growth.

The total size of the laboratory proficiency testing market was arrived at after data triangulation from three different approaches, as mentioned below. After each approach, the weighted average of the three approaches was taken based on the level of assumptions used in each approach.
Laboratory Proficiency Testing Market Size, and Share

To know about the assumptions considered for the study, Request for Free Sample Report

Laboratory Proficiency Testing Market Size, and Share

Data Triangulation

After arriving at the overall market size from the market size estimation process explained above, the total market was split into several segments and subsegments. To complete the overall market engineering process and to arrive at the exact statistics for all segments and subsegments, data triangulation and market breakdown procedures were employed, wherever applicable. The data was triangulated by studying various factors and trends from both the demand and supply sides.

Market Definition

Proficiency testing (PT) is the testing of unknown samples sent to a laboratory from an approved provider to evaluate the ability of the laboratory to produce an analytical test along with the verification of the accuracy and reliability of its testing; PT can also be used to validate the entire testing process, including competency of the testing personnel. Proficiency testing comprises an inter-laboratory system for the regular testing of the accuracy that the participant laboratories can achieve. In its usual form, the organizers of the scheme distribute portions of a homogeneous material to each of the participants who analyze the material under typical conditions and report the result to the organizers. The organizers compile the results and inform the participants of the outcome, usually in the form of a score relating to the accuracy of the result.

Key Stakeholders

  • Healthcare analytical testing service providers
  • Laboratory proficiency testing service providers
  • Hospitals and clinical diagnostic laboratories
  • Pharmaceutical & biotechnology companies
  • Contract research organizations (CROs)
  • Food & animal feed testing service providers
  • Water and environmental testing companies
  • Cannabis/opioid testing service providers
  • Commercial beverages and cosmetics testing companies
  • Venture capitalists and investors
  • Group purchasing organizations (GPOs)
  • Research institutes and government organizations
  • Market research and consulting firms
  • Contract manufacturing organizations (CMOs)

Report Objectives

  • To define, describe, and forecast the global laboratory proficiency testing market on the basis of industry, technology, and region
  • To provide detailed information regarding the major factors influencing the market growth (drivers, restraints, opportunities, and challenges)
  • To analyze micromarkets1 with respect to individual growth trends, future prospects, and contributions to the overall laboratory proficiency testing market
  • To analyze the opportunities in the market for stakeholders and provide details of the competitive landscape for key market players
  • To forecast the size of the laboratory proficiency testing market with respect to five major regions, namely, North America, Europe, Asia Pacific, Latin America, and the Middle East and Africa
  • To profile the key players in the global laboratory proficiency testing market and comprehensively analyze their core competencies2 and market shares in terms of key market developments, product portfolios, and financials
  • To track and analyze competitive developments such as mergers and acquisitions, expansions, partnerships, product launches, collaborations, and agreements of leading players in the global laboratory proficiency testing market

Available Customizations

With the given market data, MarketsandMarkets offers customizations as per your company’s specific needs. The following customization options are available for the report:

Product Analysis

  • Product Matrix: Detailed comparison of the product portfolios of the top companies

Geographic Analysis

  • Further breakdown of the Latin American laboratory proficiency testing market into Brazil, Mexico, and others.
Custom Market Research Services

We will customize the research for you, in case the report listed above does not meet with your exact requirements. Our custom research will comprehensively cover the business information you require to help you arrive at strategic and profitable business decisions.

Request Customization

Instant Answers with GPT - Ask Now!

Ask real questions. Get complete answers !
Report Code
AST 7037
Published ON
Oct, 2023
Choose License Type
BUY NOW
  • SHARE
X
Request Customization
Speak to Analyst
Speak to Analyst
OR FACE-TO-FACE MEETING
PERSONALIZE THIS RESEARCH
  • Triangulate with your Own Data
  • Get Data as per your Format and Definition
  • Gain a Deeper Dive on a Specific Application, Geography, Customer or Competitor
  • Any level of Personalization
REQUEST A FREE CUSTOMIZATION
LET US HELP YOU!
  • What are the Known and Unknown Adjacencies Impacting the Laboratory Proficiency Testing Market
  • What will your New Revenue Sources be?
  • Who will be your Top Customer; what will make them switch?
  • Defend your Market Share or Win Competitors
  • Get a Scorecard for Target Partners
CUSTOMIZED WORKSHOP REQUEST
+1-888-600-6441
  • Call Us
  • +1-888-600-6441 (Corporate office hours)
  • +1-888-600-6441 (US/Can toll free)
  • +44-800-368-9399 (UK office hours)
CONNECT WITH US
ABOUT TRUST ONLINE
©2024 MarketsandMarkets Research Private Ltd. All rights reserved
DMCA.com Protection Status Website Feedback